

Rising Google Ads costs in Singapore may come from a weak landing page experience, not from your bids. Landing page quality score rates how well your keywords, ads, and landing pages match a searcher’s intent.
Most advertisers treat it as a metric to trim at the end of a review. Landing page experience is the component most advertisers under-invest in and the easiest to fix. A page that answers the query quickly will outperform a beautiful page that does not.
Key takeaways
- Quality Score runs from 1 to 10 and is a diagnostic indicator, not an auction input. Google says so explicitly. A weak score still tracks higher cost per click, because the same weak signals that produce it also produce a higher price in the auction.
- Each of the three components is rated only above average, average or below average, against advertisers who showed for the exact same search over the last 90 days. There is no numeric sub-score to chase.
- AdAlysis’s reverse-engineering of the visible score puts landing page experience and expected click-through rate at about 39% each, with ad relevance at 22%. It is an outside estimate, not a Google disclosure — but it explains why one below-average component pins your score near 6.
- Relevance beats polish. Match the keyword, ad headline and page headline before redesigning anything.
- Mobile speed matters most in Singapore, where much browsing happens on mobile data.
- One caution on the old advice: the “valid AMP click rate” column is empty for most sites in 2026, and AMP is not worth adopting. Mobile-friendly click rate is the check that still does work.
What Landing Page Quality Score is, and what it is not
Landing Page Quality Score is Google’s 1-to-10 diagnostic rating of how well your keyword, ad and landing page compare to other advertisers competing for the same search. It is reported at the keyword level, so it tells you which term underperforms — not which campaign does.
Google is unusually direct about its status, and the wording is worth quoting because so much advice ignores it: Quality Score “is not a key performance indicator and should not be optimised or aggregated with the rest of your data”, and “is not an input in the ad auction” (About Quality Score).
Both halves of that matter.
It is not an auction input, which means a 4 does not mechanically add a surcharge to your click. What happens is indirect: the components behind the score — expected click-through rate, ad relevance, landing page experience — are the same quality signals used to rank ads and set minimum bids. Fix the components and your price falls. Chase the number itself and nothing happens.
It should not be aggregated. Averaging Quality Score across a campaign produces a meaningless figure, because keywords with no meaningful data report “—” and because the score is a rolling window rather than a live reading.
That window is the other thing most guides get wrong. Quality Score is calculated from historical impressions for exact searches of that keyword over roughly the last 90 days. Two consequences follow, both practical:
- Changing match types will not change your Quality Score. A broad keyword inherits the score from the exact-match search data behind it.
- The score moves slowly. A single week’s movement is noise, not a verdict — which is why the advice to “review trends over several weeks” is right, though the reason is the 90-day window rather than caution alone.
Google introduced Quality Score in August 2005, alongside quality-based minimum bids. Google’s contemporaneous account is still the clearest explanation of the mechanism: high-scoring keywords are “rewarded with a lower minimum bid”, and low-quality keywords “receive higher minimum bids, often making them inactive for search because their maximum CPC does not meet the minimum bid”. That is why a weak score can cost you in two different ways: a higher price, or no impressions at all.
The three components, and how they actually combine
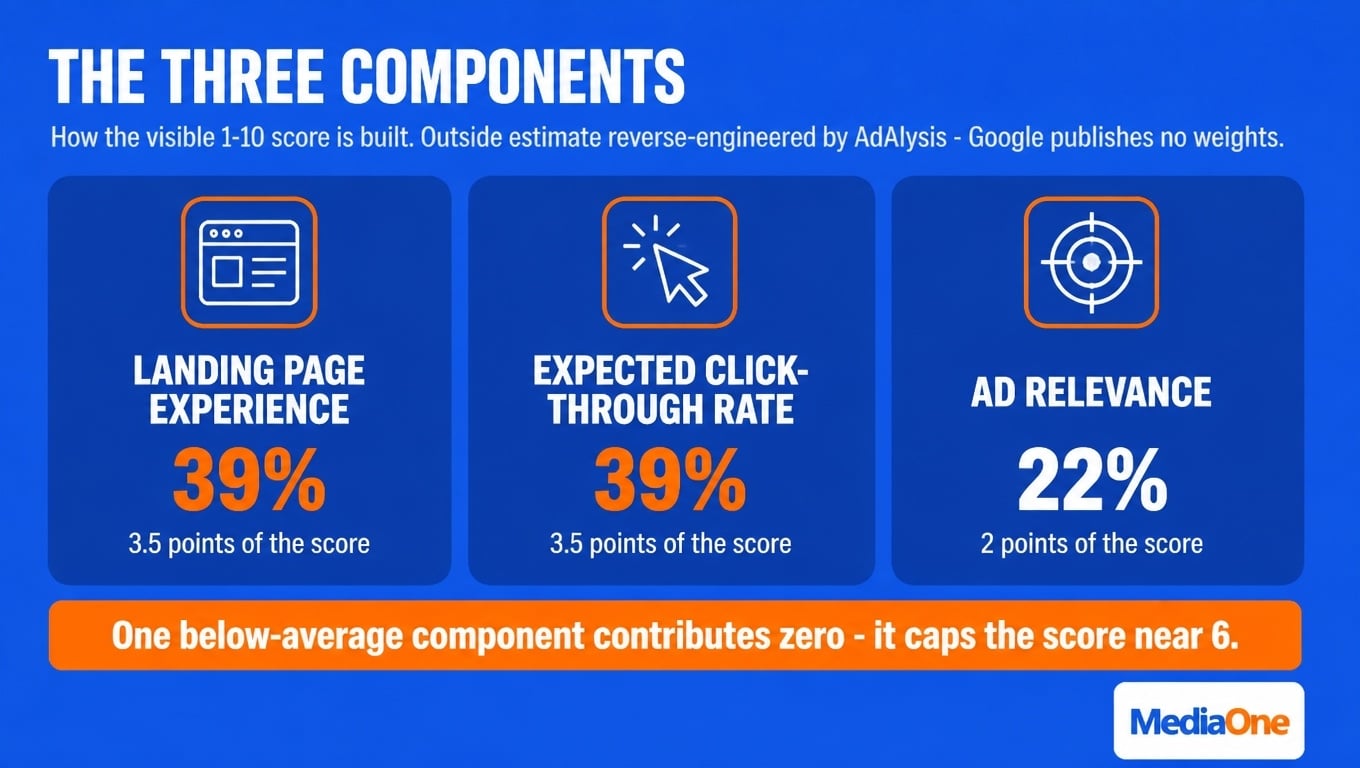
Quality Score is built from three components, each rated against other advertisers bidding on the same search:
- Expected click-through rate — the likelihood your ad is clicked when shown, based on its history.
- Ad relevance — how closely your ad text matches the intent behind the search.
- Landing page experience — how relevant, useful and easy the page is for someone who clicked.
Most advertisers work on the first two because they control the ad copy, and the third is where the cheap wins are.
The arithmetic that makes the score readable
Google does not publish weights. AdAlysis reverse-engineered the visible score and published the point values, and the structure is more useful than the percentages (AdAlysis):
|
Component |
Above average |
Average |
Below average |
|
Landing page experience |
3.5 |
1.75 |
0 |
|
Expected click-through rate |
3.5 |
1.75 |
0 |
|
Ad relevance |
2 |
1 |
0 |
The visible score is 1 + the three point values. Several things fall out of that immediately, and they are more actionable than a percentage:
|
Your score |
What it implies |
|
10 |
All three above average — 1 + 3.5 + 3.5 + 2 |
|
8–9 |
Two above average, one average or below |
|
6–7 |
One component is below average, or all three are merely average |
|
5 or below |
Two or more below average — the keyword rarely belongs in this ad group |
The row that matters is 6–7. That band is where most underperforming accounts sit, and it is ambiguous by design: you cannot tell from the number alone whether you have a weak page or weak ad copy. You have to open the three sub-ratings and look. That is the whole reason the components are reported separately.
Two corrections to the common summary. Landing page experience does not carry “the greatest weight” — it is tied with expected click-through rate at roughly 39% each, with ad relevance at 22%. And the practical implication is stronger than the ranking implies: because a below-average component contributes zero, a single failing component caps your score at about 8 even if everything else is perfect, and typical mixed accounts land at 6.
Landing page experience: the component that moves the needle
Landing page experience is the component advertisers most often leave alone, and usually the cheapest to fix. Google’s own definition is broader than speed: it asks whether the page is relevant and useful to the person who clicked, and its landing page guidance adds transparency and ease of navigation on any device.
That framing matters, because it means a fast page that answers the wrong question still scores poorly. A relevant page that loads in four seconds scores better than a beautiful page that loads in one and talks about something else.
The speed number everyone misattributes
You have seen this claim: “a 1-second delay in page load can reduce conversions by 7%”, attributed to Google. It is not Google’s.
The 7% figure comes from Aberdeen Group, whose widely cited research found that a one-second delay meant 7% fewer conversions, 11% fewer page views and a 16% drop in customer satisfaction (summary via Forbes).
Google’s own published figure is different, and specific to mobile retail: “a 1-second delay in mobile can impact mobile conversions by up to 20 percent” (Google Ads landing pages help).
That is the number to use for a Singapore account, for one reason: it is a mobile figure, and for most Singapore advertisers the majority of paid clicks now come from mobile — check your own device split in Google Ads before assuming otherwise. If you are going to quote a speed statistic in a client report, quote Google’s mobile one — it is both more relevant and more defensible than a 2008 desktop-era aggregate.
Mobile checks that still work, and one that no longer does
In Google Ads, go to Campaigns → Insights and reports → Landing pages. Two columns matter:
- Mobile-friendly click rate. Below 100% means Google’s Mobile-Friendly test failed on at least some clicks to that page. This is the operative check. A “—” means the page received no mobile clicks at all, which is its own problem.
- Valid AMP click rate. The old advice — “if this is below 100%, the page does not always load as valid AMP, fix it” — needs retiring. If your page has no AMP markup, the column simply reads “—”, which is the state of most sites. And AMP no longer carries the advantage it was built for: Google stopped requiring AMP for Top Stories in June 2021, and ended cache-served AMP pages in July 2026 (Search Engine Journal). Do not add AMP in 2026 to chase a column that is empty for your competitors too.
For Singapore specifically, test on mobile data rather than office wi-fi, and on a mid-range Android rather than the newest iPhone. A page that loads in 1.4 seconds on your connection can take four on a mid-range phone on a crowded MRT platform, and that is the condition your Quality Score is being judged in.
Message match above the fold
The headline should repeat the ad’s promise and the keyword the visitor searched. If the ad says “same-day delivery in Singapore” and the page opens with a generic slogan, the message breaks, and the landing page experience falls even if the rest of the page is good.
This is the cheapest fix in the entire account and the one most often skipped, because it requires someone to look at the ad and the page side by side. Do that before any redesign.
How to check, benchmark and improve your score
Quality Score lives in the Keywords tab. Add the “Quality Score” column plus its three sub-ratings, and add the historical versions too — “Quality Score (hist.)”, “Landing Page Exper. (hist.)” — because those are what let you see a trend rather than a snapshot. Segment by day to see the daily change.
Then work at two levels:
- Keyword level tells you which specific term is dragging, and therefore which landing page to fix.
- Ad group level tells you where effort pays. A weighted view — Quality Score multiplied by impressions and spend — surfaces the ad groups where a weak score is actually costing money, rather than the ones that merely look bad.
Reading the score bands
Use the arithmetic above rather than the folklore. A score of 7 or above is generally healthy, but check the sub-ratings before relaxing: 7 can hide one average component, and an average component is an open invitation to a competitor.
A score of 6 or below is a clear signal to act, always starting with whichever sub-rating says “below average”. If all three say “average”, the answer is not one fix, but three small ones, and the fastest is usually the page.
Set scores against your actual cost per click and conversion rate. A high score on a keyword that never converts is not a win — and if conversions are the weak link rather than quality, start with a PPC conversion audit.
How to test a landing page change
Change one thing at a time, or you learn nothing. Duplicate the page, alter only the headline or the first-screen layout, keep the ad copy fixed, and compare the sub-ratings over the same period. Because the score runs on a 90-day window, expect the effect to appear gradually rather than overnight — and judge it on conversion rate as well as the rating, since the rating is a proxy and revenue is not. Conversion rate optimisation strategies cover how to read that properly.
The Relevance-Speed Audit
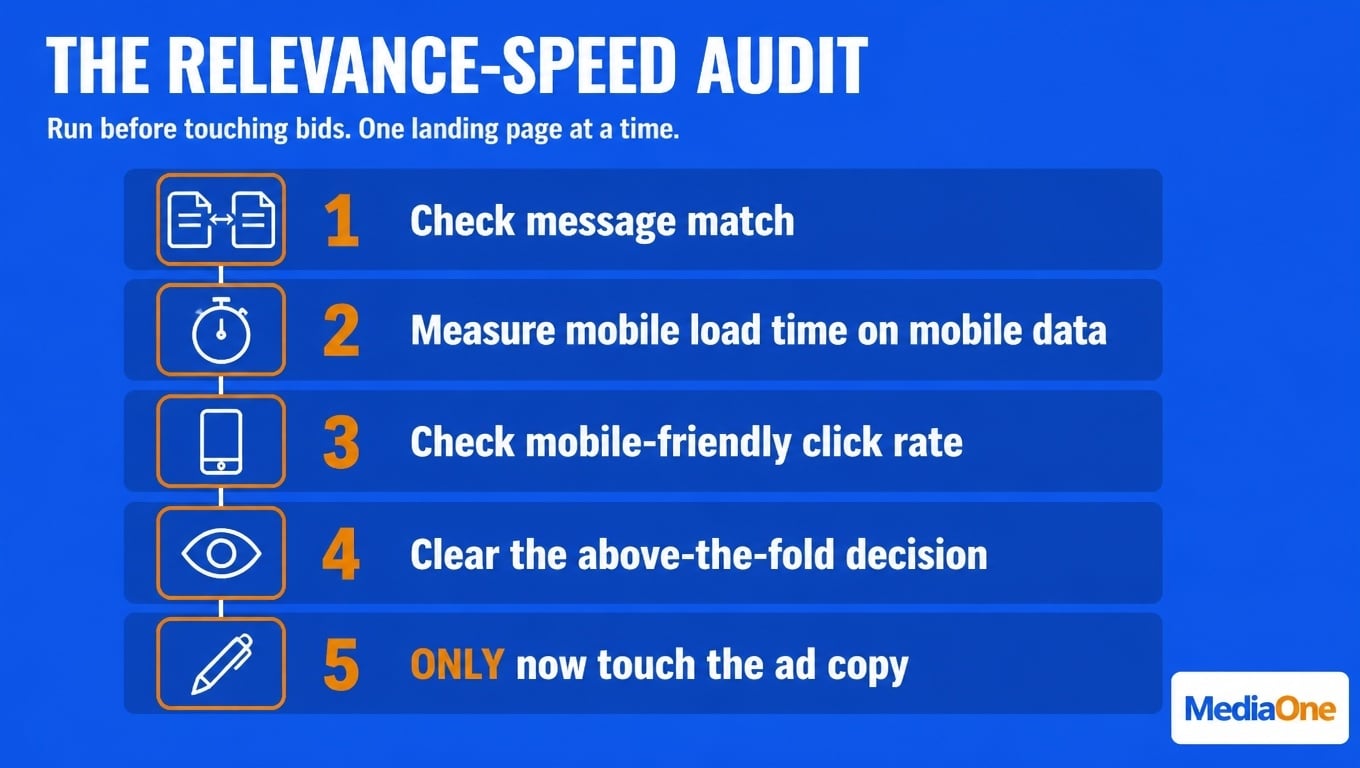
This is the sequence to run before touching bids. It works on one landing page at a time, ordered so that each step makes the next one cheaper.
The five steps
- Check message match. Put the ad and the page side by side. Does the keyword appear in the ad headline and the page headline? Does the page deliver the specific promise the ad made? If no, stop here — nothing downstream can compensate.
- Measure mobile load time on a mid-range device over mobile data. Use PageSpeed Insights and check the mobile result, not desktop; our walkthrough of testing page speed goes past the headline number. Fix anything slow before touching design; a design change on a slow page is wasted work. Our framework for optimising web pages treats speed and conversion as one job.
- Confirm mobile-friendliness in the landing pages report. Mobile-friendly click rate below 100% names the URL to fix.
- Clear the above-the-fold decision. The call to action and the answer to the query both visible without scrolling. If the visitor has to scroll to learn whether the page is what they wanted, the page is failing the “useful” half of landing page experience.
- Only now touch the ad copy — and change it to match the page you now have, not the page you wish you had.
The audit sheet
Score each page 0, 1 or 2 on each line. Two rounds of this across a dozen pages tells you more than any single Quality Score reading.
|
Check |
0 |
1 |
2 |
|
Keyword appears in ad headline and page headline |
Neither |
One of the two |
Both |
|
Page delivers the ad’s specific promise |
Different offer |
Partly |
Exactly |
|
Mobile load time (on mobile data) |
Over 4s |
2.5–4s |
Under 2.5s |
|
Mobile-friendly click rate |
Below 90% |
90–99% |
100% |
|
Primary action visible without scrolling |
No |
Below fold |
Above fold |
Anything scoring 0 on the first two rows is a message-match failure, and it outranks every speed fix: the fastest page in the account will not rescue an ad that promises something the page does not deliver. Score 0 or 1 on rows three and four and you have a speed problem worth real engineering time — our Core Web Vitals guide covers the technical fixes. Score 2 throughout and the page is not your constraint — look at the offer or the keyword instead.
Where the fixes rank
|
Finding |
Typical effort |
Typical effect on the score |
|
Message mismatch between ad and page |
Hours — copy and one headline |
Fast and large; often moves the sub-rating within weeks |
|
Mobile page slow |
Days — images, scripts, hosting |
Steady; also cuts cost per click elsewhere |
|
Page not mobile-friendly |
Days |
Removes a hard ceiling |
|
Ad copy weak, page fine |
Hours |
Improves ad relevance only |
|
Ad group holds unrelated keywords |
Hours, then structural |
Improves relevance across the group |
Common Landing Page Quality Score mistakes to avoid
- Rewriting ads while the page stays untouched. The most expensive mistake, because it feels productive. Ad copy can only promise what the page delivers. If the page opens with an unrelated headline, no amount of headline testing will fix landing page experience — check the mobile-friendly click rate before you write another ad.
- Treating the score as a KPI. Google explicitly warns against this. Optimising the number without watching cost per click and conversion rate produces accounts that look healthy and lose money.
- Reading one week’s reading as a verdict. The score reflects roughly 90 days of exact-match history. Judge trends, not readings.
- Letting ad groups sprawl. Loosely related keywords under one ad force a single headline to serve several intents, which lowers ad relevance for all of them. Keep each ad group to one intent and one matching page — keyword research is where that grouping gets decided.
- Aggregating the score across a campaign. Averaging a 3 and a 9 gives 6, a number that describes no keyword in the account. If you are weighing campaign types at the same time, Performance Max vs Search ads explains where each fits.
Fix your Quality Score with MediaOne Marketing
The pattern in most Singapore accounts we open is the same: ad copy has been tested weekly for a year, and no one has looked at the landing page since it launched. That is the gap this article describes, and it is where we start.
MediaOne Marketing runs Google Ads management and PPC for Singapore businesses, and a Quality Score review is part of onboarding rather than an upsell. We audit the three sub-ratings across your highest-spend ad groups, run the Relevance-Speed Audit on the pages behind them, and tell you which component is actually costing you money—with the arithmetic, not a hunch.
|
What we hand back |
Why it changes what you do next |
|
Sub-ratings for your top ad groups, weighted by spend |
You see where the score is costing money, not where it merely looks bad |
|
A ranked page-fix list with effort estimates |
You can brief a developer with it, or we can do the work |
|
Mobile speed measured on a mid-range device over mobile data |
The condition your Quality Score is actually judged in |
|
A straight verdict if bids, not quality, are the problem |
Some accounts do not have a quality problem, and we say so |
If your cost per click has climbed and the ad copy is already good, the page is the place to look. Talk to us, and we will tell you which component is holding the account back — and if the answer is that your budget or bidding strategy is the constraint instead, our Google Ads budget guide for Singapore and our SEM budget planning guide are the place to start.
Frequently asked questions
Does a higher Quality Score always lower my cost per click?
Usually, but not mechanically. Google states plainly that Quality Score is not an auction input, so the score itself does not set your price. What lowers your cost is improving the components behind it, because those same quality signals are used to rank ads and set minimum bids. Aggressive competitors can still raise your costs, so treat a high score as a reason costs can fall, not a guarantee.
How often does Google update Quality Score?
The score is calculated from historical impressions for exact searches over roughly the last 90 days, so it moves slowly rather than continuously. You can segment by day and add the historical columns to see movement, but a dip in one week is noise. Look for a sustained pattern before restructuring anything.
Can a landing page alone raise my Quality Score?
It can, and it is often the fastest route — but only if the page is the component that is below average. Check the three sub-ratings first. If landing page experience already reads “above average”, your ceiling is set by expected click-through rate or ad relevance, and page work will not move the score.
Is a score of 10 necessary to run profitable campaigns?
No. Profitability depends on whether a keyword converts at a cost you can afford. Plenty of profitable accounts run at 7 or 8. Aim for a score that keeps keywords eligible and your cost per click reasonable, then put your attention on conversion rate — which is where the money actually is, and what our CRO service is built around.
Does Quality Score affect Display and Shopping campaigns?
Quality Score is a keyword-level measure, so it applies directly to Search. Display and Shopping use different quality signals. You can still track post-click experience across all three in the landing pages report, and you should — a slow page costs you in every campaign type that points at it.
Why is my Quality Score stuck at 6?
Almost always because one component is rated below average, or because all three sit at average. The point arithmetic makes this explicit: all three above average gives 10, all three average gives about 5–6, and one below-average component contributes nothing, however good the others are. Open the sub-ratings — the one that says “below average” is the fix.