
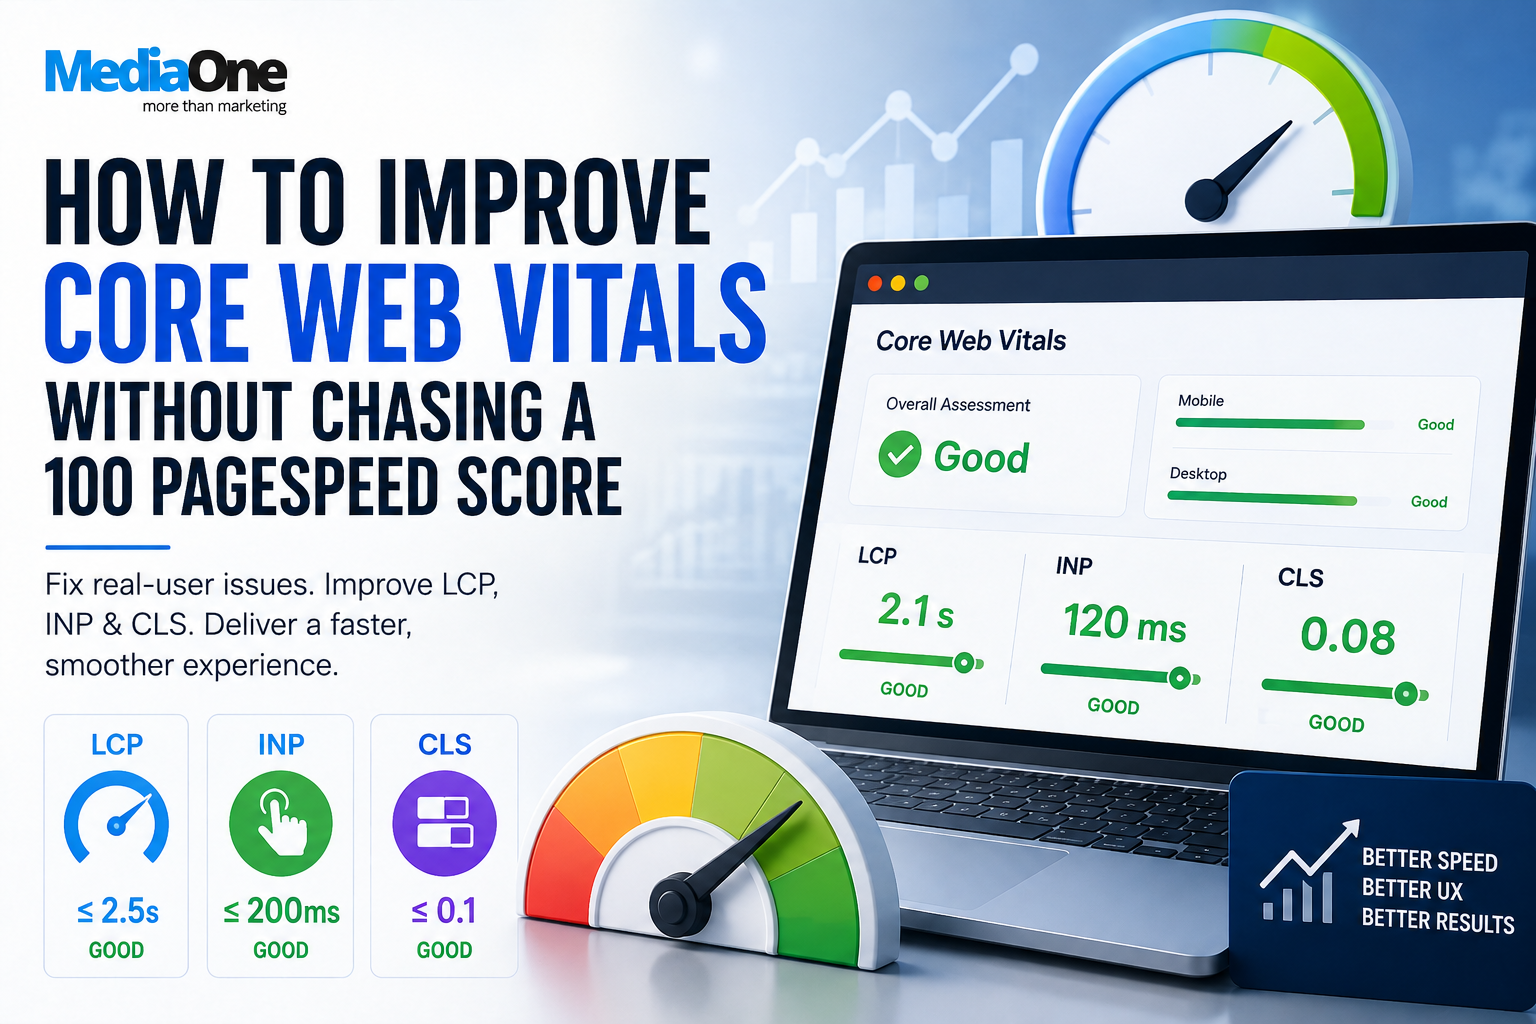
AI Summary

A good PageSpeed score can sit alongside a failed Core Web Vitals report in Search Console, because Lighthouse runs a controlled lab test while Google’s assessment uses real-user field data. We start by finding which metric real users are failing (LCP, INP or CLS), checking mobile and desktop separately, and looking for a shared template behind the problem. We then fix the specific cause, such as a late LCP image, a slow interaction or content that shifts without reserved space, and audit third-party scripts before rebuilding the frontend. Search Console can stay red after a fix because CrUX uses a rolling 28-day window. We prioritise revenue and lead-generation pages over chasing a perfect 100, and we measure conversions alongside the technical metrics.
Your PageSpeed Insights score is 95.
Lighthouse looks green. Maybe GTmetrix gives the page an A.
Then you open Google Search Console and see:
Core Web Vitals: Failed.
This is where Core Web Vitals optimisation becomes unnecessarily confusing.
Usually, neither tool is wrong. You are simply looking at two different types of performance data.
Google’s Core Web Vitals assessment is based on real-user experience data. Lighthouse, on the other hand, runs a controlled lab test. A page can perform beautifully in that simulation and still struggle for real visitors using slower phones, weaker processors, less reliable connections or completely different browsing conditions.
So we would not begin by asking:
How do we turn 95 into 100?
The better question is:
Which Core Web Vital are real users failing, and what is actually causing it?
That changes the entire optimisation process.
Key Takeaways
- Start with real-user data. Field data tells you whether visitors are actually passing Core Web Vitals, lab tools help diagnose why.
- Fix the failing metric, not every PageSpeed recommendation. LCP, INP and CLS usually require different fixes.
- A good Lighthouse score does not guarantee a Core Web Vitals pass.
- Search Console does not update instantly. CrUX uses a rolling 28-day period.
- Do not lazy-load your likely LCP image.
- Audit third-party scripts. Marketing and analytics tools can quietly become major performance costs.
- Look for template-level problems. One shared fix can improve hundreds, thousands or even millions of URLs.
- Measure marketing outcomes too. Conversion rate, abandonment and revenue per visitor matter more than a perfect synthetic score.
First: Understand What Google Is Actually Measuring
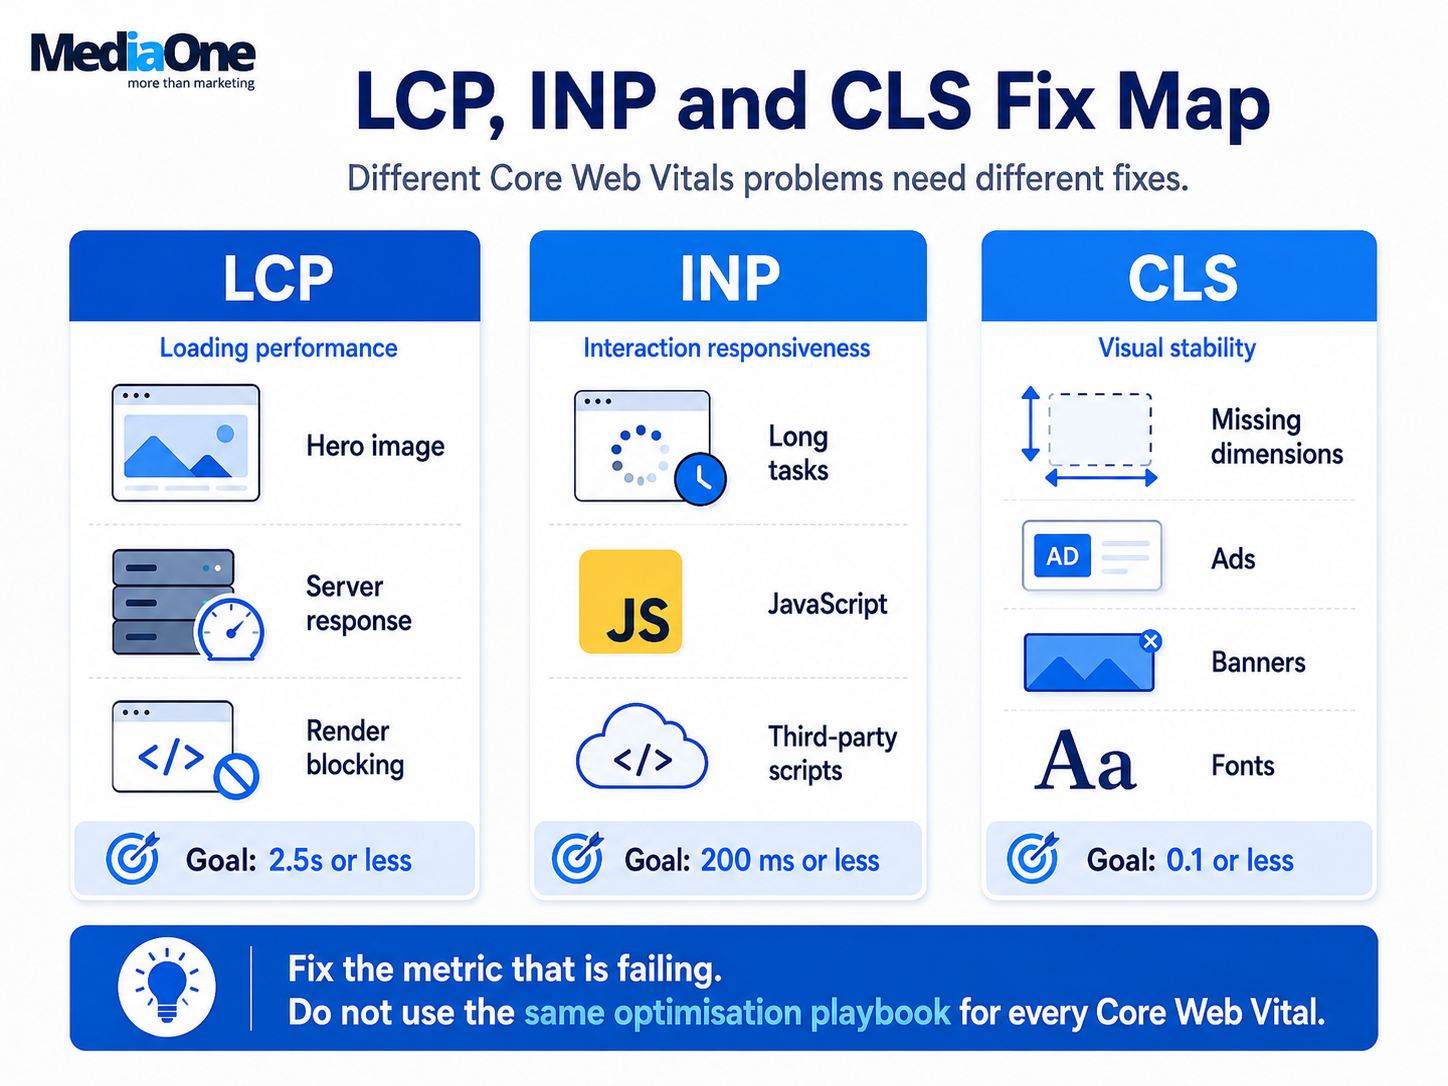
Google’s current Core Web Vitals consist of three metrics: Largest Contentful Paint, Interaction to Next Paint and Cumulative Layout Shift.
According to Google’s current Core Web Vitals documentation, the recommended thresholds are:
| Metric | What It Measures | Good |
| LCP | Loading performance | ≤ 2.5 seconds |
| INP | Interaction responsiveness | ≤ 200 ms |
| CLS | Visual stability | ≤ 0.1 |
These thresholds are assessed at the 75th percentile. In plain English, the experience needs to be good for most users, not just the person running Lighthouse from a fast laptop.
If you are working from an old optimisation checklist, there is another important correction.
FID is no longer a Core Web Vital.
Interaction to Next Paint replaced First Input Delay in March 2024. Google later refreshed its page-experience documentation to reflect INP as the current responsiveness metric.
For non-technical teams, the acronyms are less important than the experiences behind them.
LCP is basically:
How long am I waiting for the main thing I came here to see?
INP is:
I clicked something. How long until the page responds?
CLS is:
Why did that button just move while I was trying to press it?
That is the level at which troubleshooting should begin.
Core Web Vitals Matter, but They Are Not an SEO Cheat Code
Core Web Vitals are used by Google’s ranking systems.
That does not mean a page with perfect Core Web Vitals automatically outranks a more useful page.
Google makes this distinction unusually clear in its page-experience guidance: good Core Web Vitals do not guarantee top rankings, and trying to achieve a perfect score purely for SEO may not be the best use of your time.
That is important because performance work has a cost.
An engineering team can spend several days moving a Lighthouse score from 97 to 100 while a high-value landing page still has poor copy, weak internal linking or a checkout problem.
We would treat Core Web Vitals as:
Remove measurable performance friction so it does not hold an otherwise useful page back.
Not:
Reach 100 and Google will reward us.
Site speed is one part of the wider SEO picture alongside crawlability, content quality, architecture, internal linking and authority. MediaOne’s guide to ranking on Google Singapore covers that broader relationship.
Why PageSpeed Can Look Good While Search Console Still Says You Failed
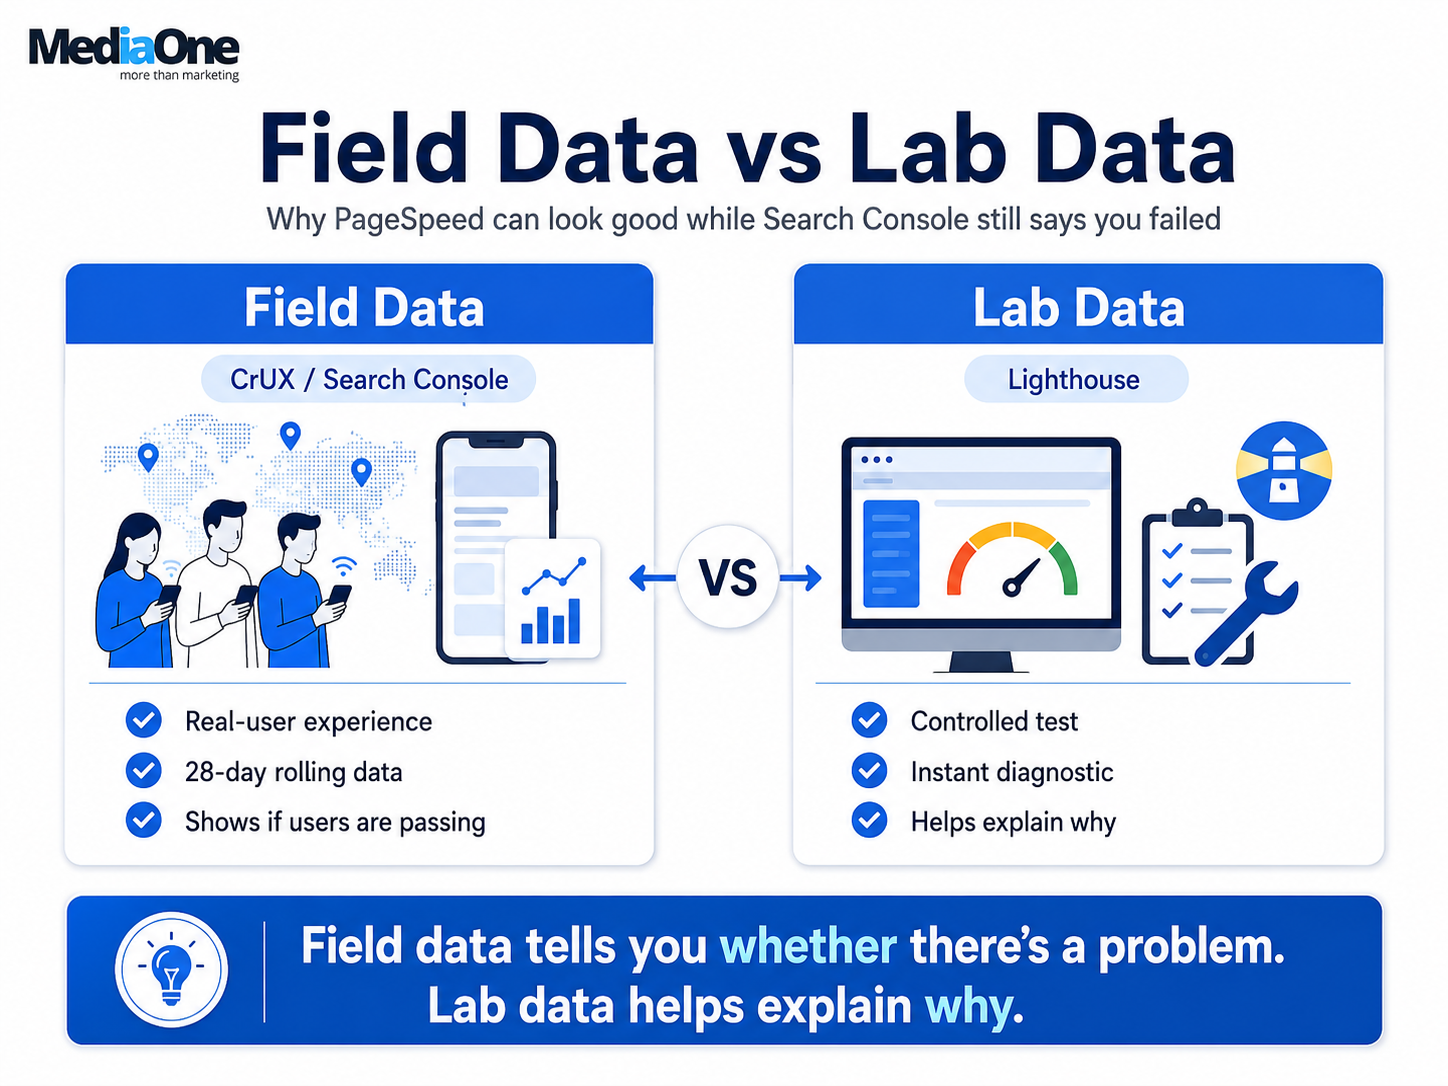
This is probably the most important distinction in the entire guide.


PageSpeed Insights can show both field and lab data, but they answer different questions.
Field Data Tells You What Happened to Real Users
The field section uses the Chrome User Experience Report, or CrUX.
It reflects eligible Chrome users under real browsing conditions.
That means actual variation in:
- devices
- CPUs
- connections
- locations
- browsing behaviour
CrUX is the better place to answer:
Are real visitors actually passing Core Web Vitals?
Lab Data Helps You Diagnose Why
Lighthouse runs a controlled simulation.
That makes it useful for identifying things such as render-blocking resources, oversized assets, JavaScript execution and resource-loading problems.
But one controlled test is not the same thing as thousands of real sessions.
Google’s own Core Web Vitals tools workflow recommends using field data to understand real-world performance and lab tools to diagnose likely causes.
The easiest rule to remember is:
Field data tells you whether there is a problem. Lab data helps explain why.
There is another wrinkle with INP.
A normal Lighthouse page-load test cannot directly measure INP because there is no real user interaction. Lighthouse instead uses metrics such as Total Blocking Time as a lab diagnostic that can help identify responsiveness problems.
So a green Lighthouse report does not automatically mean real users have good INP.
The MediaOne Core Web Vitals Troubleshooting Order
We would troubleshoot in this order:
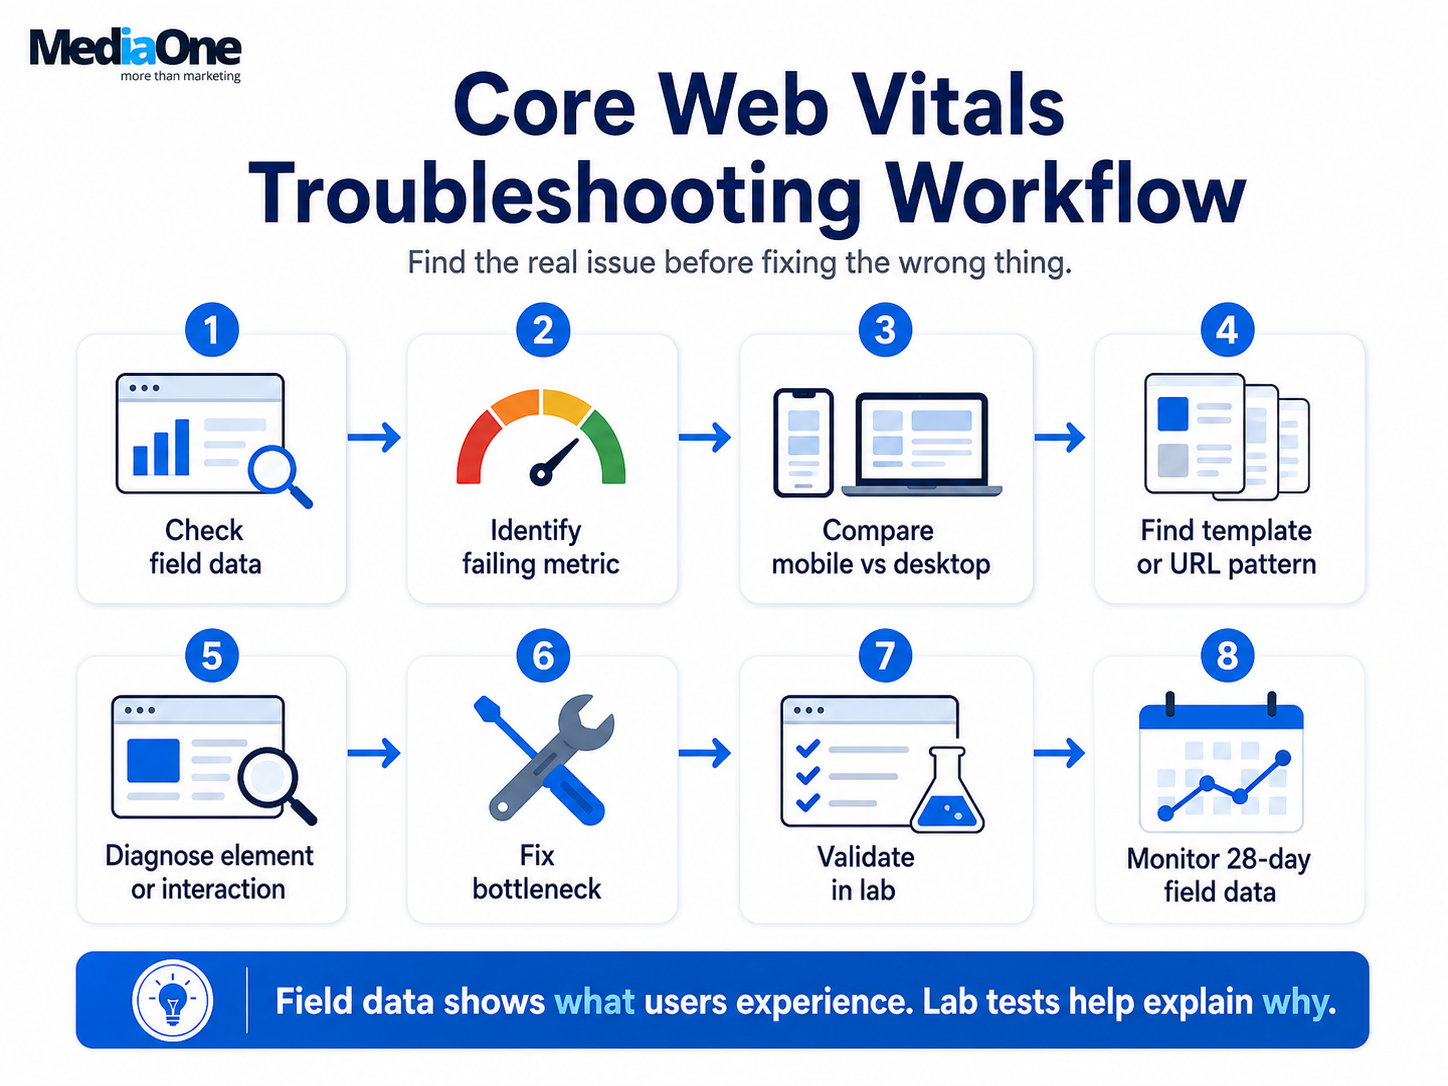
Field data → failing metric → device → template → specific cause → fix → lab validation → field monitoring
The order matters.
If Search Console says CLS is the problem, spending half a day compressing JavaScript bundles because Lighthouse suggested it may not solve what users are actually failing.
Likewise, if INP is poor, shaving another 30 KB from a hero image may make almost no difference to the interaction people are struggling with.
Fix the problem you have.
Not every recommendation a tool can generate.
1. Find the Failing Metric Before Changing the Site
Start with Search Console and PageSpeed Insights.
Then determine whether the affected group is primarily failing:
LCP
INP
CLS
Also check mobile and desktop independently.
A site can pass easily on desktop and struggle badly on mobile because mobile users may have slower processors, weaker networks and different responsive components.
If mobile is failing, optimise the mobile experience.
Do not use a fast desktop result to convince yourself that the problem does not exist.
2. Look for a Template Problem Before Fixing Individual URLs
Core Web Vitals problems often repeat.
Every blog article may use the same oversized hero image.
Every product page may load the same review widget.
Every landing page may initialise the same chat tool.
Every category may ship the same JavaScript bundle.
Search Console groups pages with similar performance characteristics, which makes this especially useful for identifying patterns.
If 600 URLs share the same component-level problem, fixing the template can be dramatically more valuable than optimising 600 pages individually.
GoDaddy provides a useful real-world example.
Its Websites + Marketing platform hosts millions of sites, so its team combined performance information with metadata about the templates and widgets those sites were using.
According to GoDaddy’s published Core Web Vitals case study on web.dev, sites using its popup modal performed around 12 Lighthouse points lower than sites without it. After identifying the issue, GoDaddy changed how the modal’s JavaScript loaded and applied similar lessons to shared functionality such as its cookie banner.
The team also reduced its common JavaScript bundle from more than 200 KB to around 90 KB.
When it began focusing on field data, its overall Core Web Vitals pass rate was around 40%, largely because CLS was underperforming. GoDaddy eventually raised its overall pass rate substantially through component-level improvements such as reserving space for images and improving shared assets.
The lesson is not to copy GoDaddy’s frontend.
It is:
Shared problems deserve shared fixes.
One template improvement may affect more users than dozens of isolated PageSpeed optimisations.
3. Improve LCP by Finding What Is Actually Late
Largest Contentful Paint measures how quickly the main visible content appears.
On a typical commercial page, the LCP element might be a hero image, product image, headline or prominent content block.
The mistake is to receive a poor LCP result and conclude:
Make everything faster.
That is too broad.
Ask:
What is the LCP element, and why is it appearing late?
Google’s LCP optimisation guide breaks the problem into resource discovery, priority, loading, rendering and the speed at which the initial HTML arrives.
Do Not Lazy-Load the LCP Image
This is one of the simplest mistakes to fix.
Lazy loading is useful for media that users may never scroll down far enough to see.
It is a bad idea for the main image they need immediately.
Google’s LCP guidance explicitly warns against lazy-loading the LCP image because doing so introduces unnecessary resource-load delay.
For a likely LCP image, something like this is much more appropriate:
<img
src=”/hero.webp”
width=”1200″
height=”675″
fetchpriority=”high”
alt=”Relevant description”
>
Keep loading=”lazy” for below-the-fold imagery instead.
Make the LCP Resource Easy to Discover
The browser cannot prioritise something it does not know exists.
LCP is often delayed when the hero image is injected by JavaScript, hidden inside a CSS background declaration or only discovered after client-side rendering begins.
Where practical, expose important resources in the initial HTML.
For critical images, fetchpriority=”high” can also signal their importance. Google’s Fetch Priority documentation specifically identifies LCP images as a use case for higher fetch priority.
Do not apply high priority to every image. If everything is urgent, nothing really is.
Check the Server Too
A perfectly compressed hero image cannot compensate for HTML that arrives late.
If Time to First Byte is poor, investigate:
- server processing
- caching
- redirects
- database work
- hosting
- geographic latency
Then look at render-blocking CSS and JavaScript if the resource has loaded but still takes too long to appear.
4. Improve INP by Finding the Slow Interaction
INP is not simply another loading metric.
A page may look completely loaded and still feel terrible to use.
Imagine someone taps “Add to Cart”.
Nothing happens.
Four hundred milliseconds later, the interface finally responds.
That is the kind of experience INP is designed to expose.
According to Google’s INP optimisation guidance on web.dev, a good INP is 200 milliseconds or less at the 75th percentile. Improving it starts with identifying the actual interaction responsible for the delay.
Do not start with:
Which JavaScript file should we optimise?
Start with:
What feels slow?
It might be:
- navigation
- search
- filters
- forms
- product selectors
- Add to Cart
- cookie controls
Reproduce the interaction in Chrome DevTools and inspect what occupies the main thread while the user is waiting.
Ship Less JavaScript Before Making JavaScript More Clever
Sometimes the best JavaScript optimisation is deleting JavaScript.
Marketing sites have a particular tendency to accumulate libraries, plugins and trackers over time.
A slider gets installed for one campaign.
A heatmap tool arrives during a CRO project.
A second analytics platform gets tested and never removed.
A chat widget goes live.
An A/B testing tool stays active long after the experiment ends.
Eventually the user has to download and execute all of them.
Code splitting and task yielding can help, but removing unnecessary work is often simpler.
5. Audit Third-Party Scripts Before Rebuilding the Frontend
This deserves its own section because it sits directly at the intersection of development and marketing.
Websites accumulate:
- analytics
- pixels
- chat
- testing tools
- embeds
- session recording
- consent software
- advertising scripts
No individual team thinks its script is the problem.
The visitor’s CPU does not care which department requested it.
Google’s guidance on third-party JavaScript performance recommends routinely auditing third-party resources and removing redundant functionality.
Before asking developers to rebuild large parts of a frontend, ask:
Do we still use this platform?
Does it need to load immediately?
Can it wait until consent or interaction?
Do we have two tools performing nearly the same job?
And most importantly:
What happens if we temporarily block it and retest?
Chrome DevTools makes request blocking useful for this exact kind of investigation.
But do not delete measurement infrastructure blindly in pursuit of a prettier score.
A page that loads 40 milliseconds faster but can no longer attribute conversions may be a worse marketing asset.
6. Improve CLS by Reserving Space Before Things Arrive
CLS is visual instability.
The classic example is simple.
You are about to tap a button.
An advertisement loads above it.
The entire page moves.
You press the wrong thing.
Google’s CLS optimisation guidance identifies unsized images, advertisements, embeds, dynamically inserted content and web fonts among the common causes.
Give Media Dimensions
Tell the browser how much space an image requires before the file arrives.
<img
src=”/product.webp”

width=”800″
height=”600″
alt=”Relevant product description”
>
The browser can reserve the correct aspect ratio instead of reflowing the page later.
Reserve Space for Ads and Embeds
If an advertisement, map, video or social embed will appear, plan for its dimensions.
Without reserved space, the experience becomes:
content appears → user starts reading → embed arrives → everything moves
Be Careful With Promotional Banners
A promotional banner inserted above an already rendered header can shift most of the viewport.
If the banner needs space, reserve it.
If an overlay provides an acceptable experience without pushing existing content down, that may be another option.
Check Font Behaviour
When a custom font replaces a fallback font, character widths can change.
That can alter line wrapping and move neighbouring content.

Use only the font weights you actually need, choose sensible fallbacks and test the loading behaviour rather than assuming fonts are visually harmless.
7. Why Search Console Can Stay Red After the Fix
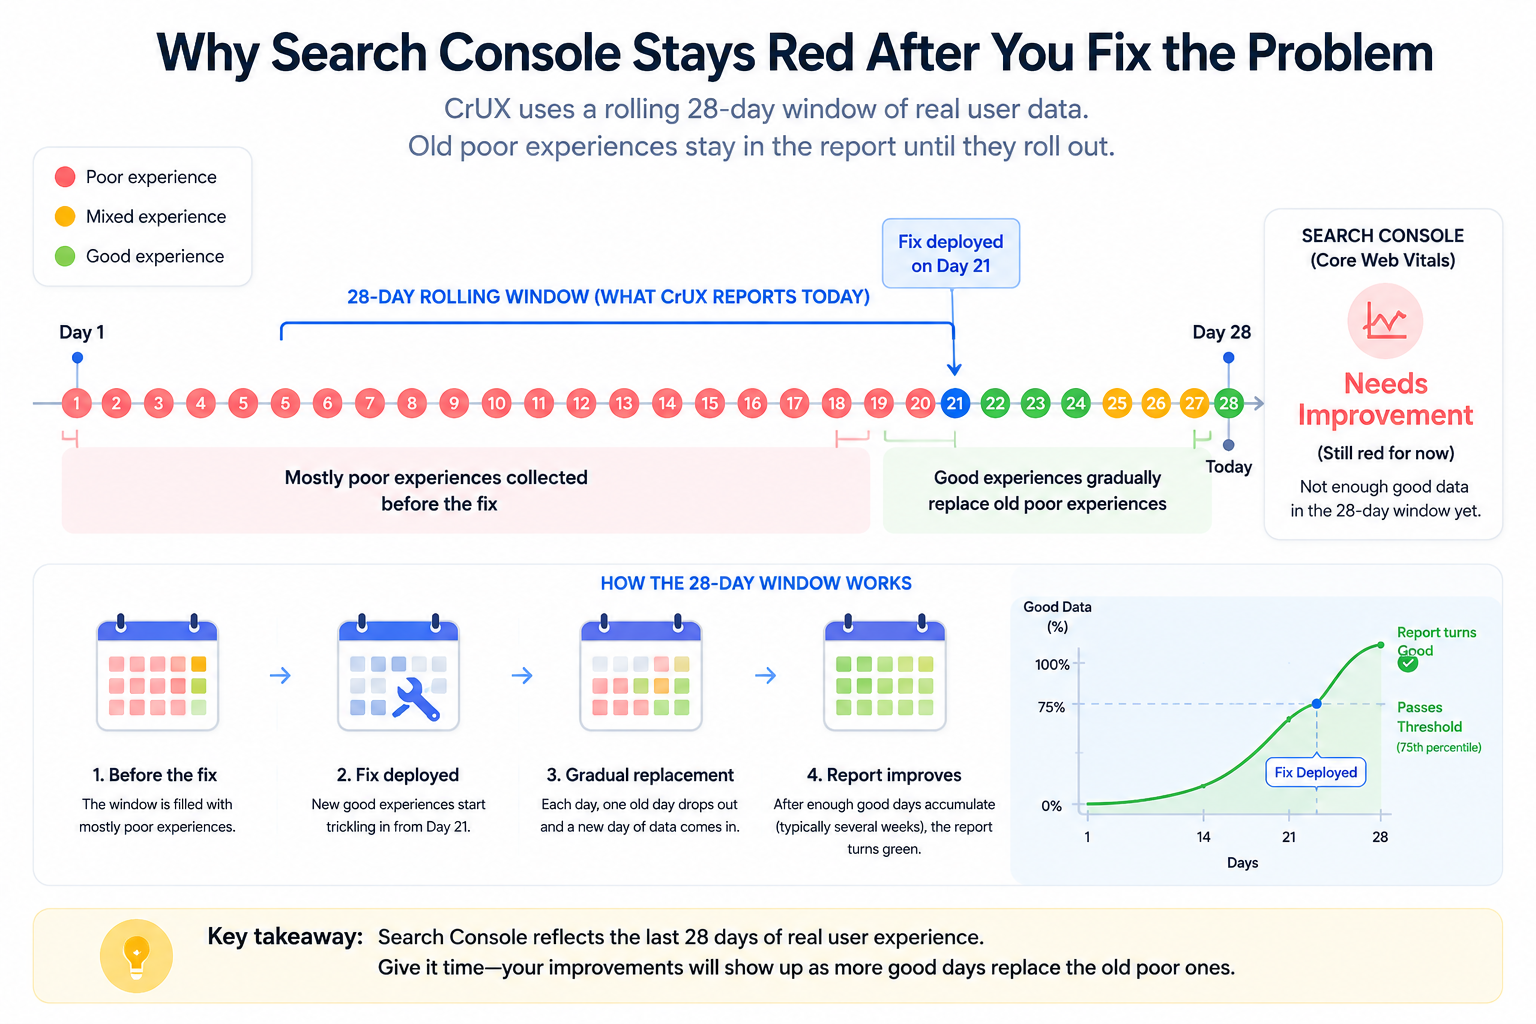
You deploy the fix today.
Lighthouse improves immediately.
Search Console is still red tomorrow.
That does not mean the fix failed.
CrUX works with a rolling 28-day dataset. Google’s Core Web Vitals tools documentation explains that the public field dataset reflects the previous 28 days of user experience.
Suppose the page had poor LCP for the previous three weeks.
The day after your fix, most of those old poor experiences are still inside the reporting period.
As more good sessions enter and older poor sessions roll out, the field result can gradually improve.
So:
A successful Lighthouse retest does not make Search Console turn green tomorrow.
If you need much faster feedback, collect your own Real User Monitoring data instead of depending entirely on public CrUX reporting.
What If PageSpeed Has No Field Data?
Not every URL receives enough eligible Chrome traffic to have page-level CrUX data.
PageSpeed Insights may show origin-level data or only Lighthouse diagnostics.
That does not mean the page automatically passes Core Web Vitals.
For lower-traffic properties, use representative templates, Chrome DevTools and your own RUM implementation where practical.
Google’s field-measurement guidance recommends collecting your own real-user performance data when CrUX does not provide enough detail.
You do not need to wait for Google’s dataset before fixing an obviously broken experience.
A 2026 Note for Single-Page Applications
There is one particularly current update worth adding for teams running React, Vue or other SPA architectures.
Chrome 151 introduced new APIs in 2026 that can measure Core Web Vitals across soft navigations, route changes where a single-page application updates its content and URL without performing a traditional full page load.
However, as of August 2026, Chrome says these APIs are only beginning to appear in tools such as web-vitals, RUM solutions and Chrome DevTools. They have not yet been fully integrated into CrUX, and browser support is still evolving.
The current web.dev SPA Core Web Vitals guidance is therefore especially relevant if your application feels slow after route transitions even though standard page-load reports look healthy.
This is another reason not to rely on one PageSpeed screenshot as the complete picture of performance.
Connect Core Web Vitals to Business Outcomes
Performance optimisation becomes easier to justify when it stops being an engineering score and becomes a commercial problem.
The question is not:
Did Lighthouse improve from 72 to 94?
It is:
Did users complete more of the journey after we removed the performance bottleneck?
Vodafone Put That Question Into an A/B Test
Vodafone provides one of the cleaner published examples.
According to Vodafone’s Core Web Vitals case study on web.dev, the company split traffic between an optimised landing page and a baseline version.
The optimised page achieved a 31% improvement in field LCP.
It also produced:
| Metric | Reported Change |
| LCP | 31% better |
| Sales | +8% |
| Lead-to-visit rate | +15% |
| Cart-to-visit rate | +11% |
The test involved traffic from paid channels including search, social, display and mobile campaigns.
These are Vodafone’s results from that specific experiment.
They do not mean improving LCP by 31% universally generates 8% more sales.
The more useful lesson is that Vodafone measured the business outcome rather than treating the performance score as the final KPI.
That is exactly how marketing teams should approach performance work.
If 10,000 paid visits are already being purchased every month, making more of those visitors complete the journey can improve media efficiency even though the ad budget has not changed.
Measure changes in conversion rate, cost per acquisition, revenue per session and abandonment alongside the technical metric.
How We Would Prioritise Core Web Vitals Work
Engineering resources are finite.
So not every PageSpeed recommendation deserves equal treatment.
| Priority | What to Fix |
| Highest | Revenue or lead-generation pages failing Core Web Vitals |
| High | Shared templates affecting many high-traffic URLs |
| Medium | Important pages marked Needs Improvement |
| Lower | Low-traffic URLs with minor misses |
| Lowest | Already-passing pages where the only goal is 100/100 |
This is where performance becomes a business decision.
A change affecting 5,000 product pages and millions of sessions is usually more valuable than spending two days polishing one low-traffic blog post from 98 to 100.
If engineering work needs to be justified commercially, MediaOne’s guide to calculating SEO ROI goes deeper into evaluating SEO work through financial outcomes rather than vanity metrics.
Do You Actually Need a 100 PageSpeed Score?
Usually, no.
If real users are passing Core Web Vitals, high-value journeys work properly and the remaining Lighthouse recommendations offer very little business value, pushing a score from 96 to 100 can become optimisation for the sake of optimisation.
Google itself says trying to obtain a perfect page-experience score purely for SEO may not be the best use of your time.
That does not mean:
Ignore PageSpeed.
It means:
Know when another optimisation costs more than the problem it solves.
Do not remove useful analytics, attribution or legitimate customer functionality simply because Lighthouse dislikes the extra JavaScript.
Instead, ask whether those tools can be loaded more efficiently.
Performance optimisation still requires judgement.
A Practical Core Web Vitals Check
If we were reviewing a site today, we would keep the process short.
First, check real-user data.
Find the metric that is actually failing.
Separate mobile from desktop.
Look for a shared template or component.
For LCP, identify what appears late.
For INP, reproduce the slow interaction.
For CLS, find what moves.
Audit third-party scripts before assuming the entire frontend needs rebuilding.
Validate the technical fix in the lab.
Then wait for field data, or use your own RUM, to confirm whether users actually improved.
That sequence is much more useful than running Lighthouse 40 times until the number turns green.
Frequently Asked Questions
How do I improve Core Web Vitals quickly?
Start with the metric failing in field data. For LCP, find and prioritise the main visible element. For INP, identify the interaction blocked by main-thread work. For CLS, find what moves unexpectedly and reserve its space before it loads.
Why is Search Console failing when PageSpeed looks good?
You may be comparing field data with lab data. Search Console and CrUX reflect real-user experiences, while Lighthouse runs a controlled simulation.
How long until Search Console updates after I fix a Core Web Vitals issue?
Do not expect an immediate change. CrUX is based on a rolling 28-day dataset, so older poor experiences remain in the data while newer good experiences replace them. Lab improvements can be visible immediately, but field reporting takes longer.
Does improving Core Web Vitals guarantee higher rankings?
No. Google uses Core Web Vitals within its ranking systems, but good scores do not guarantee top positions. Relevance and overall page experience still matter.
Is a 100 PageSpeed Insights score necessary?
No. Passing Core Web Vitals for real users is more important than chasing a perfect synthetic score.
Which Core Web Vital should I fix first?
Fix the metric actually failing for users, then prioritise by traffic, conversions, revenue and how many URLs share the same underlying problem.
Can improving Core Web Vitals improve conversions?
It can, but the size of any improvement depends on the site. Vodafone’s controlled experiment associated a 31% LCP improvement with an 8% increase in sales.
Improve the User Experience, Not Just the Score
When improving Core Web Vitals, stop asking:
How do we get 100 in PageSpeed?
Ask:
What are real visitors waiting for, what is blocking their interactions, and what is moving when it should stay still?
Start with field data.
Use lab tools to diagnose the cause.
Fix the actual LCP element, INP interaction or CLS source.
Look for problems shared across templates before treating every URL separately.
And measure whether the change improved something that matters to the visitor or the business.
A perfect score is satisfying.
A faster, more responsive and more stable experience for real users is the actual goal.
If Core Web Vitals problems are part of a wider technical SEO issue, contact MediaOne to identify the templates and technical bottlenecks with the largest SEO and commercial impact.