
Web page optimisation is no longer optional. Every page element, including load time, heading structure, and form friction, influences search engine rankings and visitor conversions.


Speed optimisation, SEO work and UX improvements often happen in silos across different teams. The result: pages that rank well but convert poorly, or load fast but deliver a weak user experience.
This guide treats optimisation as a single, unified system. You will learn the seven core elements that matter most, how to audit your pages systematically and how to prioritise work by real impact. Whether you are an SEO specialist, marketer, developer or digital leader, you will find a framework you can act on immediately.
Key Takeaways
- Page optimisation is a seven-element framework, not a checklist: speed, on-page SEO, mobile responsiveness, content relevance, image optimisation, internal linking and user experience signals all matter equally.
- Core Web Vitals (which measure how fast your page loads, how responsive it is and how stable the visual layout remains) are a confirmed ranking factor. They directly influence bounce rate and conversion rate. Pages in the bottom quartile for speed lose significant conversions.
- Mobile-first optimisation will be essential in 2025. In many markets, over 65 per cent of web traffic is mobile. Pages must load in under 3 seconds on 4G and render properly on small screens.
- Schema markup and semantic HTML unlock visibility gains beyond keyword ranking. Rich snippets, breadcrumbs and FAQ schema may increase click-through rates from search results.
- Optimisation is iterative, not one-time. A single improvement rarely has a significant impact on its own. The framework in this guide shows you how to prioritise, measure and compound gains over time.
Why Web Page Optimisation Matters for Your Business
The Real Cost of Slow, Poorly Optimised Pages
A slow page costs money in three direct ways: abandoned visitors, lower search rankings, and fewer conversions.
Google research shows that as page load time increases, visitor abandonment rises significantly. At three seconds, bounce rates rise sharply. For an e-commerce site generating 10,000 monthly visitors at a 2 per cent conversion rate, a 30 per cent bounce increase means losing 60 conversions per month. At an average order value of SGD 150, that’s SGD 9,000 in lost monthly revenue from speed alone.
Poor optimisation also directly harms search visibility. Google’s search algorithm factors Core Web Vitals (how fast your page loads, how responsive it is to user input and how stable the layout remains) into ranking decisions. A site ranking fifth for a high-intent keyword might be placed there partly because competitors have optimised page speed and the site owner has not.
Poorly structured pages also fail to communicate relevance to search engines. A page with no heading hierarchy, no semantic markup and keyword misalignment signals low quality to Google. Even if the content is genuinely useful, the engine has no clear signal that it matches user intent.
In most cases, website load delays correlate with reduced conversion rates for retail sites. For a business with SGD 500,000 in monthly revenue, each significant delay represents a lost opportunity.
How Optimisation Affects Search Rankings and User Behaviour
Optimisation affects two distinct systems:
- Google’s ranking algorithm
- human user behaviour.
Both matter, and they operate differently.
Seach Rankings
Search engines reward optimised pages because optimisation signals quality. A fast, well-structured page with clear headings, semantic markup and mobile responsiveness shows that a site owner invested in user experience.
By comparison, slower, poorly structured competitors look neglected. That is why Google added Core Web Vitals to its ranking criteria in June 2021: it uses them as a quality signal.
User Behavior
User behaviour follows a different logic. A visitor who lands on your page cares nothing for SEO signals. They care whether:
- the page loads in under two seconds
- the content answers their question
- they can navigate the site on a phone
- they trust your brand enough to click your call-to-action
What Does Optimisation Do
Optimisation aligns both systems. A page optimised for speed, readability and conversion performs better in search results and converts more visitors into customers or leads. You are not trading off between pleasing algorithms and pleasing people. You serve both at once.
Optimised pages show measurable improvements across multiple areas. Users stay longer on pages with clear structure and fast load times. Click-through rates from search results rise when your title and meta description appear relevant. Mobile-responsive, fast pages with easy navigation encourage repeat visits. Other sites link more often to content on sites they trust.
A page optimised for 3G connections performs better for most of your users. An unoptimised page designed for desktop bandwidth becomes unusable on mobile networks that are common in older buildings or outer estates.
When you optimise across speed, search relevance and conversion elements together, the gains compound. A 30 per cent improvement in page speed does not yield 30 per cent more conversions. Typical results vary by site and industry, but optimisation often improves form simplification, clearer calls-to-action and better mobile layout at the same time. The system strengthens as a whole.
This is why optimisation matters: it is a direct lever on revenue, visibility and user retention.
The Seven Core Elements of Page Optimisation
Page optimisation is not a single task. It is a system of seven interconnected elements that work together to improve rankings, speed, user experience and conversions. These elements are measurable, independent and address different phases of how users find, load and interact with your page.
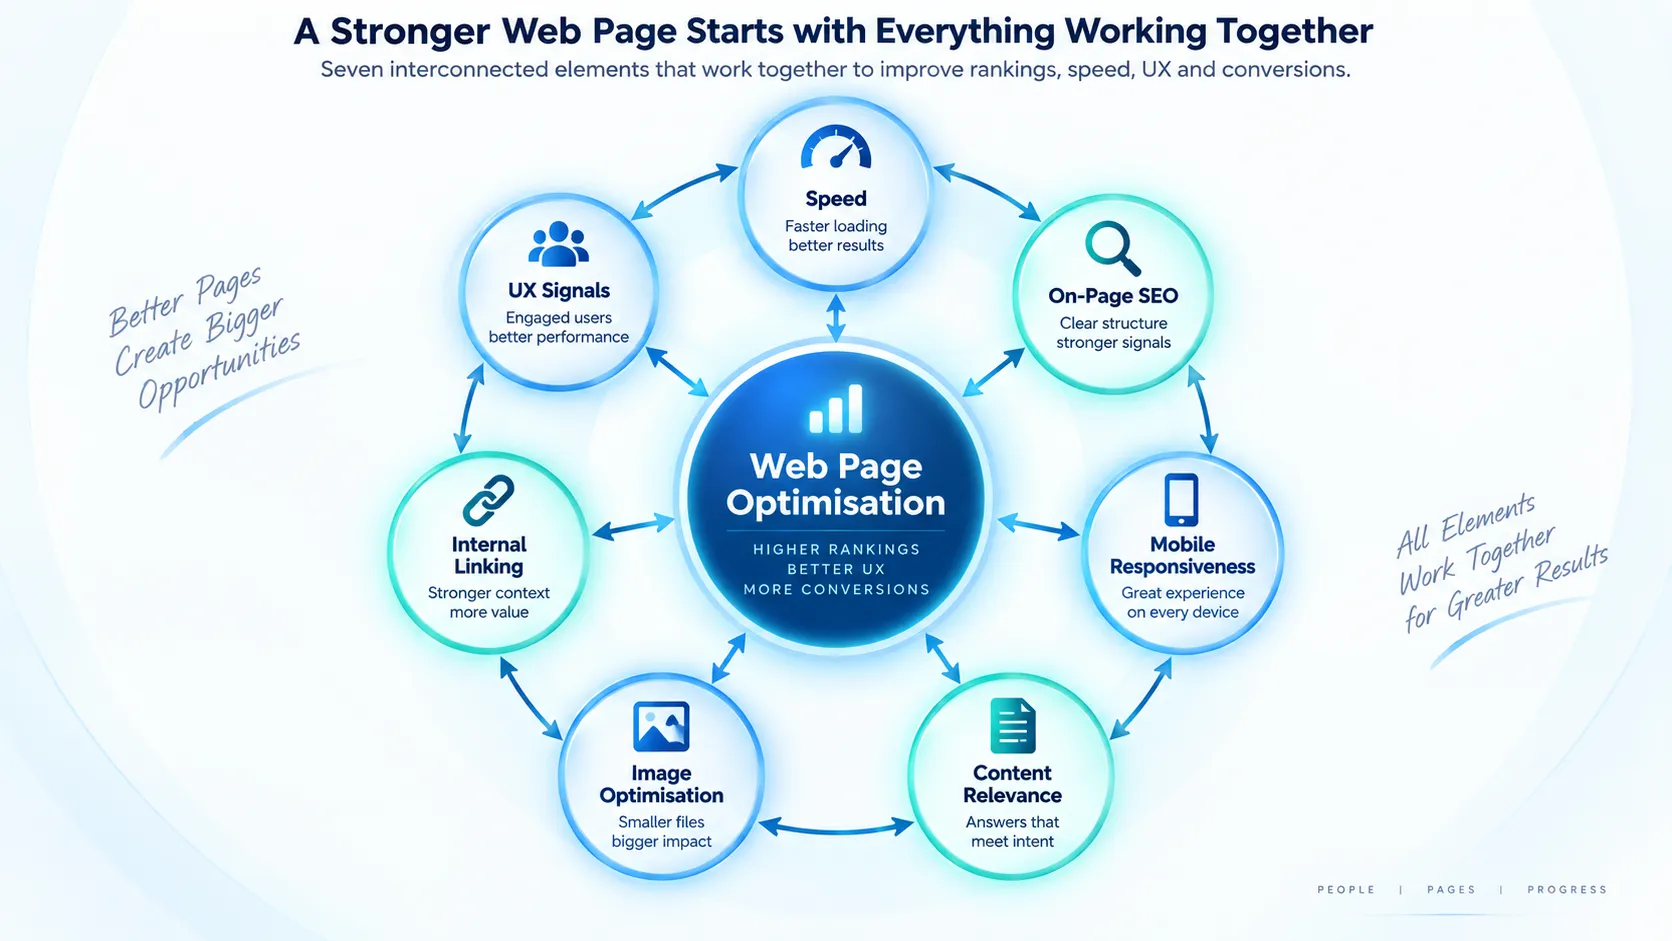
Understanding each element helps you avoid the trap of over-optimising one area while neglecting others. A fast page with poor on-page SEO will rank low. A keyword-rich page that loads slowly will frustrate users and lose conversions. The framework below treats all seven as equally important.
1. Page Speed and Core Web Vitals
Page speed is now a direct ranking factor. Google measures it through Core Web Vitals: three metrics that quantify how fast your page loads and how smoothly it responds to user interaction.
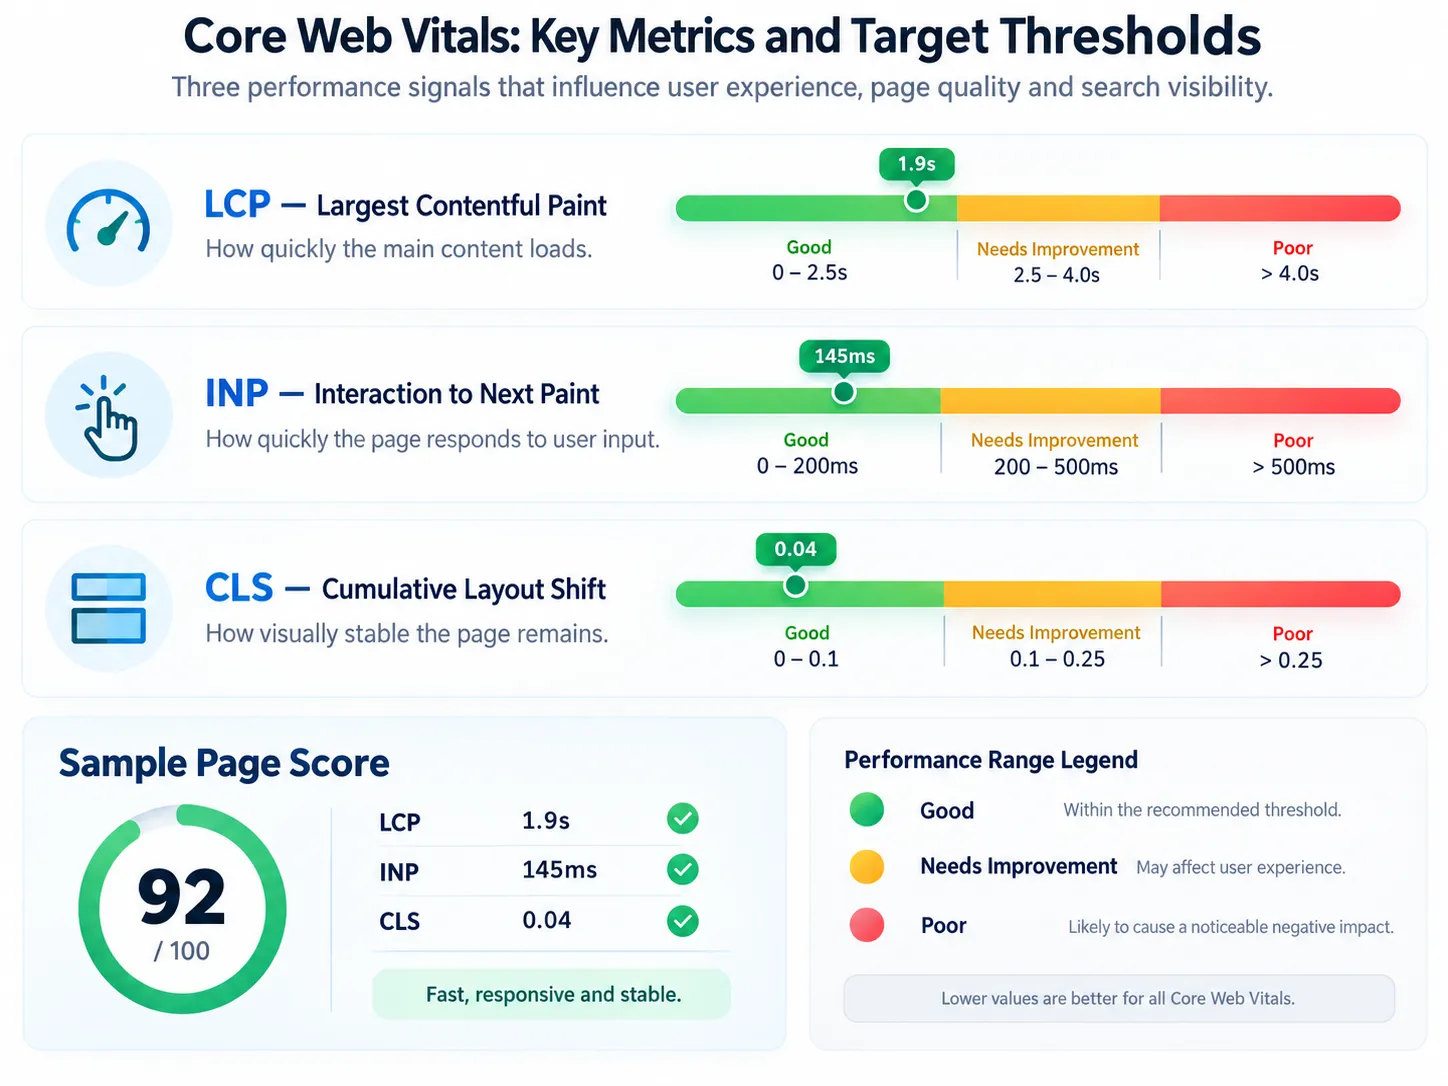
- Largest Contentful Paint (LCP) measures how long it takes for the largest visual element (usually an image or heading) to appear on screen. Google’s target is 2.5 seconds or faster. Pages that exceed this threshold rank lower in mobile search results.
- Interaction to Next Paint (INP), which replaced First Input Delay (FID), measures how quickly the page responds when a user clicks a button or taps a link. The target is 200 milliseconds or less. Slow responsiveness drives users away, even if the page loaded quickly.
- Cumulative Layout Shift (CLS) measures unexpected movement on the page. Ads, images or fonts loading late can push text downward mid-read, creating frustration. A CLS score below 0.1 is acceptable.
You can measure these metrics with Google PageSpeed Insights, which tests your page and assigns mobile and desktop scores. GTmetrix and WebPageTest provide deeper diagnostic data: which resources are slow, which block rendering, and where to focus effort first.
For pages in Southeast Asia (including Singapore), baseline speeds differ by network type. Mobile users on 4G connections load more slowly than desktop users on fibre do. Test on real devices and real networks, not just desktop simulation, to understand your actual audience experience.
Note: Core Web Vitals thresholds and ranking criteria are subject to change. Verify current criteria with Google Search Console.
2. On-Page SEO Signals (Title, Meta, Structure)
Search engines read your page title, meta description, heading hierarchy and keyword placement to determine what topic it covers.
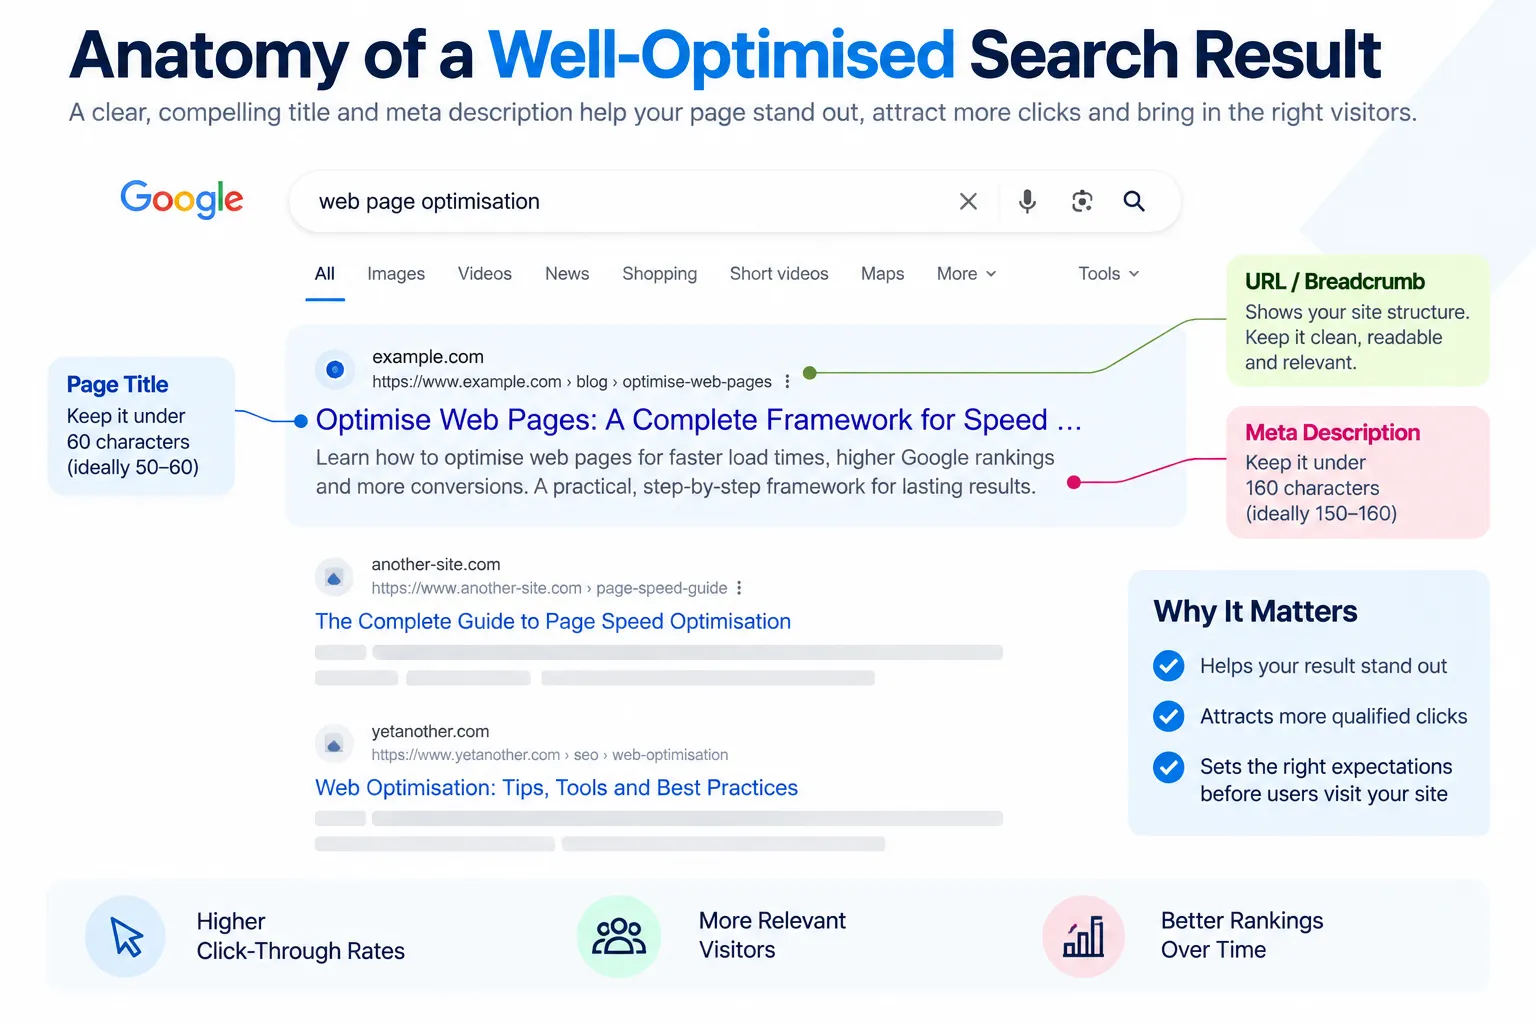
Page Title
Your page title (the text in the browser tab and search results) should be 50 to 60 characters long and contain your primary keyword near the front. Use a pipe or dash to separate the page topic from your brand name: for example, “Optimise Web Pages: A Complete Framework | Digital Agency” works better than “Welcome to Our Site”.
Meta Description
The meta description (the snippet shown below your title in search results) should be 150 to 160 characters long and answer the question, “What will I learn if I click this link?” While it does not directly affect rankings, a clear meta description increases click-through rate from search results, which improves traffic.
Heading Hierarchy
Heading hierarchy (H1, H2, H3) should follow a single H1 per page, followed by logical H2 and H3 sections. Search engines use this structure to understand what your page is about and which ideas are main topics versus supporting details. Skipping heading levels (for example, jumping from H1 to H3) creates confusion for screen readers and search engine crawlers.
Keyword alignment
Keyword alignment means using your target keyword naturally in the title, first 100 words of body text, and at least one H2 subheading. Overusing keywords (keyword stuffing) triggers a spam filter and damages readability. Aim for a keyword density of 0.5 to 2 per cent across the page.
3. Mobile Responsiveness and Viewport Configuration
Around 64% of search queries worldwide now happen on mobile devices. A page that isn’t responsive (doesn’t adapt to screen size) will rank lower in mobile search results and lose users immediately.

Responsive design means using CSS media queries to adjust layout, font size and spacing for screens smaller than 768 pixels wide. Every element should remain readable and clickable on a 375-pixel-wide phone screen.
The viewport meta tag tells mobile browsers how to scale and display your page. Include this in the head section of your HTML:
<meta name=”viewport” content=”width=device-width, initial-scale=1.0″>
Without this tag, mobile browsers assume your page is designed for desktop and zoom out, making text unreadable.
Test mobile responsiveness using Google Mobile-Friendly Test and by opening your page on real phones. Common failures include buttons that are too small to tap, text that requires pinch-zooming to read, and forms with fields that overflow the screen width.
4. Content Relevance and Keyword Alignment
A page should satisfy the search intent behind your target keyword. If users search “how to optimise web pages” expecting a step-by-step guide, and your page is a product sales pitch, no amount of SEO will keep users on your page.
Keyword alignment means matching your page content, headings and meta tags to what users are actually searching for. Use tools like Ahrefs, SEMrush or the free Google Search Console to identify which keywords send traffic to competing pages. Write to answer those questions, not to force a keyword into every sentence.
Content relevance also means depth. A page that covers a topic in 300 words ranks lower than a page that covers it in 2,000 words with examples, data and linked sources. However, unnecessary length damages ranking. Write until you have answered the question fully, then stop.
5. Image Optimisation and Asset Compression
Images typically account for 50 to 80 per cent of page weight on most websites. Unoptimised images slow down load time, harm Core Web Vitals, and increase hosting bandwidth costs.
Compress images before uploading using a tool like TinyPNG or ImageOptim. Most JPEG and PNG files can be compressed 30 to 50 per cent without a visible loss in quality.
Use modern image formats. WebP files are 25 to 35 per cent smaller than JPEG for the same quality and are supported in all modern browsers. AVIF is even smaller but has less browser support. Use the picture element with source tags to serve WebP to modern browsers and JPEG as a fallback:
<picture>

<source srcset=”image.webp” type=”image/webp”>
<img src=”image.jpg” alt=”descriptive text”>
</picture>
Lazy-load images below the fold (content not visible on first load) using the loading=”lazy” attribute:
<img src=”image.jpg” alt=”descriptive text” loading=”lazy”>
This defers loading until the user scrolls near the image, reducing initial page load time.
Add descriptive alt text to every image. Alt text helps search engines understand image content and improves accessibility for screen-reader users. For example, use “woman typing on laptop in office” instead of “image1”.
6. Internal Linking Strategy
Internal links (links from one page on your site to another page on your site) distribute authority across your site and help search engines discover pages. They also reduce bounce rate by giving users clear next steps.
Link to related pages using descriptive anchor text (the clickable link text). Avoid generic anchors like “click here” or “read more”. Instead, use “see our guide to optimising page speed” or “learn more about mobile responsiveness”. Descriptive anchors tell search engines what the linked page is about.
A page with more internal links pointing to it signals greater importance. Create internal links to high-priority pages (like your service pages or conversion-focused content) from multiple older articles.
Link contextually. If you mention Core Web Vitals in an article, link to another article that explains Core Web Vitals in detail. Do not add links that interrupt the reading flow or feel forced.
7. User Experience Signals (Click Path, Scroll Depth)
Search engines measure how users interact with your page after they land. These signals influence rankings.
- Scroll depth (how far down the page users scroll) indicates whether your content is engaging. If users land on your page and leave after 5 seconds without scrolling, search engines infer the page did not satisfy their need. If users scroll through 80 per cent of the page, the signal is positive.
- Click-through rate (what percentage of users who see your page in search results actually click on it) also affects rankings. A high CTR signals that your title and meta description accurately describe the content. A low CTR signals that users are finding better matches.
- Mean time on page (how long users spend on the page before leaving) is a positive signal, but only if paired with a low bounce rate. Users might spend 10 minutes on a page with a low bounce rate, but they may be confused, looking for a specific detail, and not satisfied.
Optimise for these signals indirectly by writing clear titles and meta descriptions that set accurate expectations, starting with the answer to the user’s question in the first paragraph (not after 500 words of introduction), breaking content into short sections with subheadings so users can scan to the information they need, and using images, tables and lists to break up text and reduce cognitive load.
A fast page also reduces bounce rate due to timeouts and frustration.

Tools for Measuring and Monitoring Page Optimisation
Several tools help you monitor Core Web Vitals, speed performance and overall optimisation health.
| Tool | Strengths | Best For |
|---|---|---|
| Google PageSpeed Insights | Free, official Google metrics, mobile and desktop scores | Initial assessment, quick audits |
| GTmetrix | Detailed waterfall charts, resource breakdown, video recordings | Diagnosing slow resources, understanding load sequence |
| WebPageTest | Advanced testing options, real-browser testing, comparative analysis | Complex optimisation problems, international testing |
| Lighthouse | Integrated with Chrome DevTools, SEO and accessibility checks, easy setup | Development-stage testing, local audits |
| Ahrefs Site Audit | Crawl-based analysis, internal link mapping, keyword alignment checks | Content and SEO optimisation, site-wide audits |
| SEMrush | Competitor benchmarking, rank tracking integrated with speed data | Strategy comparison, priority-setting |
How to Prioritise Your Optimisation Work
Use these questions to determine which of the seven elements to tackle first.
- What is your current Core Web Vitals score? If your LCP exceeds 4 seconds or your CLS exceeds 0.25, fix page speed before investing in content or link strategy. Speed improvements often yield the fastest return on effort.
- Where is your biggest traffic loss occurring? Use Google Analytics or similar to identify which pages have the highest bounce rate or lowest average session duration. Those pages are losing users and need content or UX improvements before they can rank higher.
- Are you losing clicks in search results? If your click-through rate from search results is below 2 per cent, your title and meta description may not match user intent. Rewrite them before investing in technical optimisation.
- Is your page mobile-responsive? If you are losing mobile traffic because your page isn’t responsive, fix it immediately. This is a hard ranking factor that affects half; please fix it as soon as possible
- Do you rank at all for your target keyword? If you don’t appear in search results for your primary keyword, make content relevance and keyword alignment your priority. If you rank but are on page two, focus on backlinks and content depth.
- Which optimisation issues are easiest to fix quickly? Image compression, alt text and internal linking take 1 to 2 hours per page. These are quick wins that build momentum.
Common Optimisation Problems and Solutions
| Problem | Why It Happens | What To Do |
|---|---|---|
| High LCP (slow largest element) | Hero images loading too late, or the server responding slowly | Serve images from a CDN, compress images, enable browser caching, minimise render-blocking resources |
| High INP (sluggish responsiveness) | Heavy JavaScript, main-thread blocking, slow database queries | Minify and defer JavaScript, break up long tasks into smaller chunks, optimise backend queries |
| High CLS (layout shift) | Images or ads without fixed dimensions, late-loading fonts | Add width and height attributes to images, preload critical fonts, reserve space for embeds |
| Low scroll depth, high bounce rate | Content does not match search intent, or the answer is buried below the fold | Move the answer to the first 100 words, add subheadings to break up the text, and use bullet points and tables |
| Low CTR from search results | The title and meta description do not match the content or user expectation | Rewrite the title to match the search query, clarify the meta description, and A/B test variations |
| Unresponsive on mobile | Viewport tag missing or CSS media queries not set | Add a viewport meta tag, test on real devices, increase button sizes, stack elements vertically |
Technical Optimisation: Speed, Code and Infrastructure
Technical optimisation makes page performance measurable and repeatable. While content and design matter for user engagement, the infrastructure underneath determines whether your pages load in one second or ten.
Measuring Speed: Metrics That Matter
Not all performance metrics are equal. Google uses three measurements called Core Web Vitals that most directly affect user experience and search rankings.
- Largest Contentful Paint (LCP) measures how long it takes for the largest visible element on the page (usually a heading, image or video) to render. Users perceive this as “the page has loaded”. The target is under 2.5 seconds. When LCP exceeds 4 seconds, pages struggle in search results and bounce rates increase significantly. Common culprits are unoptimised images, slow server responses, and render-blocking JavaScript.
- Interaction to Next Paint (INP) measures how long the browser takes to respond when a user clicks a button, taps a link, or types in a form field. Slow INP signals that your JavaScript is blocking the main thread. Target: under 200 milliseconds. If forms take half a second to respond to a click, users abandon them.
- Cumulative Layout Shift (CLS) tracks unexpected visual movement. This happens when ads load late, fonts swap from system to custom fonts, or images load without reserved space. A high CLS frustrates users and can lead to accidental clicks. Target: under 0.1. Even small shifts, like a newsletter signup button moving down when an image loads, add up and degrade the experience.
You will also encounter Time to First Byte (TTFB), the time before your server sends the first byte of the page. This sits earlier in the chain than LCP but affects it directly: if TTFB is slow, LCP will be too. A healthy TTFB is under 600 milliseconds.
Note: Core Web Vitals thresholds and ranking factors are subject to change. Verify current criteria with Google Search Console.
Where to measure: Google PageSpeed Insights is free and reflects Google’s own assessment. Lighthouse, built into Chrome DevTools, lets you audit pages locally. GTmetrix provides waterfall charts and identifies specific bottlenecks. For ongoing monitoring, set up Google Search Console, which reports real user data from Chrome browsers (Chrome User Experience Report, or CrUX) for your live pages.
Comparing Performance Measurement Tools
| Tool | Primary Use | Best For | Cost |
|---|---|---|---|
| Google PageSpeed Insights | Free SEO-aligned audits | Quick baseline checks | Free |
| Lighthouse (Chrome DevTools) | Local page audits | Development and testing | Free |
| GTmetrix | Waterfall analysis and bottleneck identification | Detailed performance diagnosis | Freemium |
| WebPageTest | Multi-step, multi-location testing | Quarterly deep dives and CDN validation | Freemium |
| Google Search Console | Real-user CrUX data and trends | Production monitoring and alerts | Free |
Server-Side Optimisations: Caching, CDN and Compression
The server’s job is to receive a request and respond as fast as possible. Three practices compound this speed: caching, content delivery networks, and compression.
Browser Caching
Browser caching tells the user’s device to remember static assets (CSS, JavaScript, images) for a set period, so it doesn’t re-download them on repeat visits. Set cache headers to keep images and stylesheets in cache for 30 days or more. HTML should cache for much shorter periods (or not at all) so content updates appear quickly. This is configured via HTTP headers (Cache-Control) and requires no code changes.
Server-side caching stores database queries, rendered pages, or API responses in memory using tools like Redis or Memcached. When a blog post is read by 1,000 visitors in an hour, you render it once and serve the cached copy 999 times. This can reduce response times significantly. Most modern hosting platforms and frameworks (Next.js, Laravel, Django) support this natively.
Content Delivery Networks (CDNs)
Content Delivery Networks (CDNs) distribute your content caching across geographically dispersed servers. When a user in Singapore requests your page, a CDN serves it from a server in Singapore or the nearest location rather than shipping it from your origin server elsewhere. This cuts latency substantially. Popular CDN providers include Cloudflare (with a free tier), Akamai, and AWS CloudFront. For Singapore-based businesses, local providers offer CDN nodes that comply with PDPA data residency expectations.
Compression
Gzip and Brotli compression shrink HTML, CSS and JavaScript files before sending them. Gzip compresses text significantly, reducing a 100 KB stylesheet to much smaller sizes. Brotli compresses further but is slower to generate. Enable both and let the browser choose: older browsers fall back to Gzip, newer ones use Brotli. This is standard on all modern hosting but needs to be enabled in your server config if you are self-hosting.
Implement all three practices: set cache headers on static assets, add server-side caching for dynamic content, and deploy a CDN. Together, they typically reduce Time to First Byte from over 1 second to under 200 milliseconds.
Front-End Optimisations: Minification, Lazy Loading and Code Splitting
The browser downloads and runs JavaScript and CSS. The smaller and smarter these files are, the faster pages render.
Minification
Minification removes unnecessary characters (whitespace, comments) from CSS and JavaScript without changing how they work. This typically shrinks a JavaScript file by 30 to 40%. Most build tools (Webpack, Parcel, and esbuild) handle minification automatically in production. Verify that your site serves minified files: in Chrome DevTools, check Network and look at JavaScript file sizes. If they display readable spacing, minification is not running.
Lazy Loading
Lazy loading defers the loading of images and components until the user scrolls near them. An article with 20 images loads instantly with text; images appear as the reader scrolls. This dramatically cuts initial page load time. Use the native loading=”lazy” attribute on images or JavaScript libraries like Intersection Observer for components. On pages with many images, such as galleries or product listings, lazy loading often reduces LCP by 50% or more.
Code Splitting
Code splitting divides JavaScript into smaller bundles. Instead of loading a 500 KB JavaScript file on every page, split it so each page loads only the code it needs. A product page loads product-specific code; the checkout page loads payment code. Frameworks like Next.js and React Router handle this automatically. The benefit is substantial: a homepage might reduce this process automatically to 80 KB of JavaScript.
Render-blocking resources are CSS and JavaScript that pause page rendering until they load. Critical CSS (styles for above-the-fold content) should be inlined in the HTML head so it renders instantly. Non-critical CSS can load asynchronously. JavaScript almost always blocks rendering; defer it using the defer or async attributes so the HTML parses first.
Audit your JavaScript: in Chrome DevTools, open Coverage (Cmd+Shift+P > Show Coverage) and see what code actually runs on each page. Unused code is deleted or split off. Here is an example viewport configuration to ensure responsive rendering:

<meta name=”viewport” content=”width=device-width, initial-scale=1.0″>
Database and Query Optimisation
Backend optimisation is often invisible to the user but compounds with front-end speed. Slow database queries block the user, preventing responses from being sent and increasing Time to First Byte.
N+1 queries are a classic problem: a page needs to show 10 blog posts and their authors. Inefficient code might query the database once for posts, then loop through and query once per post for the author (1 + 10 = 11 queries total). The fix is a single JOIN query that fetches posts and authors together. Most ORMs (Object-Relational Mappers) have “eager loading” options (such as Django’s select_related or Laravel’s with()) that prevent this automatically.
Query inefficiency is tackled through indexing. If you sort posts by author name on every page load, add a database index on the author column. The database can then fetch the rows in milliseconds instead of scanning every row. Check slow-query logs (queries taking over 100 milliseconds) and index the columns in those queries.
Pagination and limits matter for large datasets. Fetching 1 million rows crashes the server, whereas fetching 20 and offering “load more” does not. Always limit results and paginate.
Work with your developer to identify the slowest queries using database profilers such as MySQL Workbench or PostgreSQL EXPLAIN. Optimising the query that runs 1,000 times per day yields more benefit than optimising one that runs once.
Monitoring and Ongoing Performance
A page can be fast the day you optimise it and slow weeks later after you add new features. Set up continuous monitoring.
- Google Search Console provides real-world performance data aggregated from Chrome users. Reports show LCP, INP, and CLS distributions across your site, segmented by device type, geography, and connection speed. If you notice Core Web Vitals declining, this is your first alert.
- Lighthouse CI runs automated Lighthouse tests; this notification is sent on every code deployment. If a developer merges code that bloats JavaScript by 50 KB or introduces a layout shift, the build fails, and they know immediately. This prevents regression.
- Sentry and Datadog monitor real-user performance and errors in production. You get alerts if INP spikes or error rates climb. Datadog is strong for database and backend monitoring; Sentry focuses on frontend errors.
- WebPageTest runs detailed multi-step tests from real browsers and locations worldwide. You can test from Singapore using their Asia nodes to validate CDN performance. Use it for quarterly deep dives into page performance, not daily monitoring.
Custom dashboards should track your Core Web Vitals weekly. Plot LCP, INP, and CLS trends in a spreadsheet or tool such as Google Data Studio or Tableau. This shows whether optimisation efforts stick or regress.
Start with Google Search Console. Your optimisation efforts are sticking or regressing and cover 80 per cent of what you need. Add monitoring tools only when your site has enough traffic to benefit from real-user data, typically 10,000 or more monthly visitors.
Performance Optimisation Troubleshooting
| Symptom | Probable Cause | Recommended Action |
|---|---|---|
| High LCP (above 4 seconds) | Unoptimised images, slow server response, render-blocking JavaScript | Compress images, enable lazy loading, defer JavaScript, increase server cache |
| Slow INP (above 200ms) | JavaScript blocking the main thread, heavy form validation | Break JavaScript into chunks, use web workers, simplify form logic |
| High CLS (above 0.1) | Late-loading ads, font swaps, unsized images | Reserve space for ads and images, use the font-display property, and declare image dimensions |
| Slow TTFB (above 600ms) | Server overload, slow database, missing cache | Add server-side caching, optimise database queries, deploy CDN |
| Large JavaScript bundle | Code not split, unnecessary libraries included | Implement code splitting, audit dependencies, remove unused code |
| Images account for high page weight | Uncompressed or oversized formats | Use WebP format, compress with tools, implement responsive image sizes |
Content and SEO Optimisation: Structure, Semantics and Signals
The gap between a page that ranks and a page that converts often comes down to how deliberately you structure your content. Technical speed and mobile responsiveness move the needle, but search engines and users both respond to pages that matter: clean hierarchies, aligned keyword intent, and proof that you know your topic.
Keyword Research and Intent Mapping
Before you write or optimise a single word, you need to know what question you’re answering and who is asking it.
Keyword research today is intent research. A searcher typing “optimise web pages” is not asking for the same thing as someone typing “why is my website slow” or “how to improve Google rankings”. The first is broad and educational. The second is diagnostic. The third is competitive.
Map your target keyword to a single user intent. Then find five to eight secondary keywords that sit within that same intent cluster. Tools like Google Search Console (free, first-party data from your own traffic), Digimetrics.ai, Ahrefs and SEMrush show you real search volume, click-through rate and the intent of results already ranking.
Type your primary keyword into Google. Look at the first five results. If they’re all “how-to” guides, your page should be a how-to guide, not a product comparison. If they’re all definitions, start with a definition. Search engines have already solved for intent; your job is to recognise the pattern.
Then check the “People Also Ask” box and Google’s search suggestions. These are real follow-up questions. Answering them within your page signals depth and captures secondary search intent.
Store your keywords in a spreadsheet with three columns: keyword, monthly search volume and user intent (for example, “informational”, “commercial” or “transactional”). This becomes your map. Pick your primary keyword and five to seven supporting keywords for a typical page.
Heading Hierarchy and Semantic Markup
A well-structured page reads logically. It also tells search engines how your ideas connect.
Use only one H1 per page. That H1 should match or closely mirror your primary keyword and the main question you’re answering. It’s not a brand tagline or creative flourish. It’s the top-level answer.
Below that, H2 headings break your H1 into distinct topics. Each H2 should cover one major idea. If you want to write two paragraphs under a heading before moving on, that heading is probably too broad. Split it.
H3 headings sit under H2’s and dive deeper into one aspect. Do not skip levels. Going from H1 straight to H3 confuses both readers and search engines about what idea is subordinate to what.
When Google’s crawler reads H1 followed by H2 followed by H3 followed by paragraphs, it understands which keywords relate to which ideas. “Lazy loading strategies” is clearly a sub-topic of “image optimisation”, not a standalone concept.
Your table of contents, generated automatically from headings, should read like a logical outline. If it does not, your structure is wrong.
Use proper Markdown or HTML tags (h1, h2, h3) in your CMS or page builder. Do not style a paragraph to look like a heading. Search engines read the code, not the pixels.
Schema Markup and Rich Snippets
Schema is structured data. It tells Google exactly what type of content you have and what it means.
A sentence like “This guide was published on 15 January 2024 and updated on 10 March 2024” is readable. Schema markup for that same fact is machine-readable: “datePublished”: “2024-01-15” and “dateModified”: “2024-03-10”. Search engines can extract that date without parsing English.
For most pages, start with these four schema types.
- Article schema (JSON-LD format) is the foundation for blog posts, guides and news. It includes headline, publish date, author, image and body content. Google uses this data to show dates and images in search results.
- Breadcrumb schema helps users and search engines understand where a page sits in your site hierarchy. For example: Home > Guides > Web Performance > Core Web Vitals. Add this to every page except your homepage.
- The FAQPage schema marks up frequently asked questions with answers. Google sometimes displays FAQ rich snippets in search results, showing the question and answer directly, which may increase the click-through rate depending on your industry and content type.
- Organisation schema goes on your homepage and key landing pages. It tells Google your company name, logo, contact details and social media. It does not directly improve rankings, but it adds details and social media accounts to the panel on the right side of search results and feeds Google Maps and voice assistants.
To implement schema, use Google Structured Data Markup Helper or a schema plugin such as Yoast SEO or RankMath. Write your content first, then mark it up. Test your schema with Google Rich Results Test to confirm there are no errors.
Schema, when confirmed with the Google Rich Results Test, improves click-through rate by making your result more visually prominent in search results. That increased click-through rate can indirectly help rankings over time.
Meta Tags, Descriptions and Open Graph
Your meta title and meta description are the first impression in search results. They don’t appear on the page itself; they appear in the code.
The meta title (60 to 70 characters, including spaces) should include your primary keyword near the front and be a statement you’d want to see in search results. “Optimise Web Pages: Complete Framework for Speed, Rankings and Conversions” is better than “Optimisation Tips and Tricks for Better Performance”. The first tells you exactly what you’re getting. The second is vague.
Meta description (155 to 160 characters) is your pitch. It does not appear on the page, only in search results. Write it for a human, not a robot. Include one supporting keyword naturally. Google sometimes ignores your description and pulls text from the page itself if it thinks it’s more relevant to the search query. Write a description you’d be happy to see quoted.
Use a pipe (|) or colon to separate the topic from the site name. “Optimispipe (|) or a colon (:) Complete Framework | Your Site Name” is scannable. Avoid keyword stuffing. One use of your primary keyword is enough.
Start your meta description with an action or benefit. “Learn how to improve page speed, SEO and conversions with a proven seven-step framework” is stronger than “This page is about web page optimisation.”
Open Graph tags (og:title, og:description, og:image) control how your page looks when shared on social media such as LinkedIn, Facebook and Twitter. If you do not set these, platforms use your page title and the first image they find. That image is often a logo or irrelevant graphic. Instead, specify an og:image tag pointing to a relevant, high-contrast image (1,200 by 630 pixels, PNG or JPG). This increases shares.
Set og:title and og:description to be slightly different from your meta title and description. Social shares have more space and a different context. “Here’s how to boost your page speed in 2024” might be your og:title, while your meta title is more formal. This doesn’t hurt SEO and can improve social performance.
Building Topic Authority Within a Page
Topic authority means showing you know all angles of a subject, not just the one being searched.
A page about “optimise web pages” is stronger if it touches on speed, SEO, mobile, images, conversions and common mistakes. A reader who scans that page thinks, “This person knows the whole landscape.” Google’s algorithm recognises this pattern through topical relevance and E-E-A-T (Expertise, Experience, Authoritativeness, Trustworthiness).
- Cover related entities: nouns like Core Web Vitals, schema markup, CDN, Lighthouse and lazy loading. If you’re writing about page optimisation, these terms should appear naturally. Google’s knowledge graph connects related entities. Mentioning them shows you’re not writing from a template.
- Link to existing pages on related topics. If your site has a page on “core web vitals explained” and a page on “mobile optimisation”, link to both from your page about general optimisation. This reinforces that your site covers the topic comprehensively.
- Use supporting keywords throughout, not just in headings. Your headings should contain primary and secondary keywords. The body should too. If you have an H3 called “Lazy Loading Strategies”, the paragraph under it should use the phrase “lazy loading” once or twice more, naturally, as you’d explain it to a colleague.
- Cite or reference authoritative sources. If you mention “Core Web Vitals”, link to <a href=”https://web.dev/articles/vitals”>Google Web.dev</a>. If you mention schema markup, link to <a href=”https://schema.org”>schema.org</a>. If you’re giving a number, cite where that comes from: a published study or official report. This strengthens authority and gives readers a source to verify.
- Include a data point or case study. Pages that say “Here’s how one e-commerce site improved conversion rate by 15 per cent after optimising page speed” feel more credible than pages that speak only in claims of improvement; examples build authority. However, typical results vary by site and industry, so contextualise any improvement claims.
The difference between a page that ranks and a page that dominates is often this: the dominating page does not just answer the question. It proves the author knows the topic deeply by covering its edges, citing sources and connecting related ideas.