| AI Summary
Customer lifetime value (CLV) estimates the value a customer brings throughout their relationship with a business. A basic calculation measures revenue, while a margin-adjusted calculation accounts for direct costs. Businesses can compare CLV with customer acquisition cost to assess marketing spending, then track repeat purchases and retention to improve results. Reliable calculations need consistent time periods, accurate costs and realistic assumptions about future purchases. |
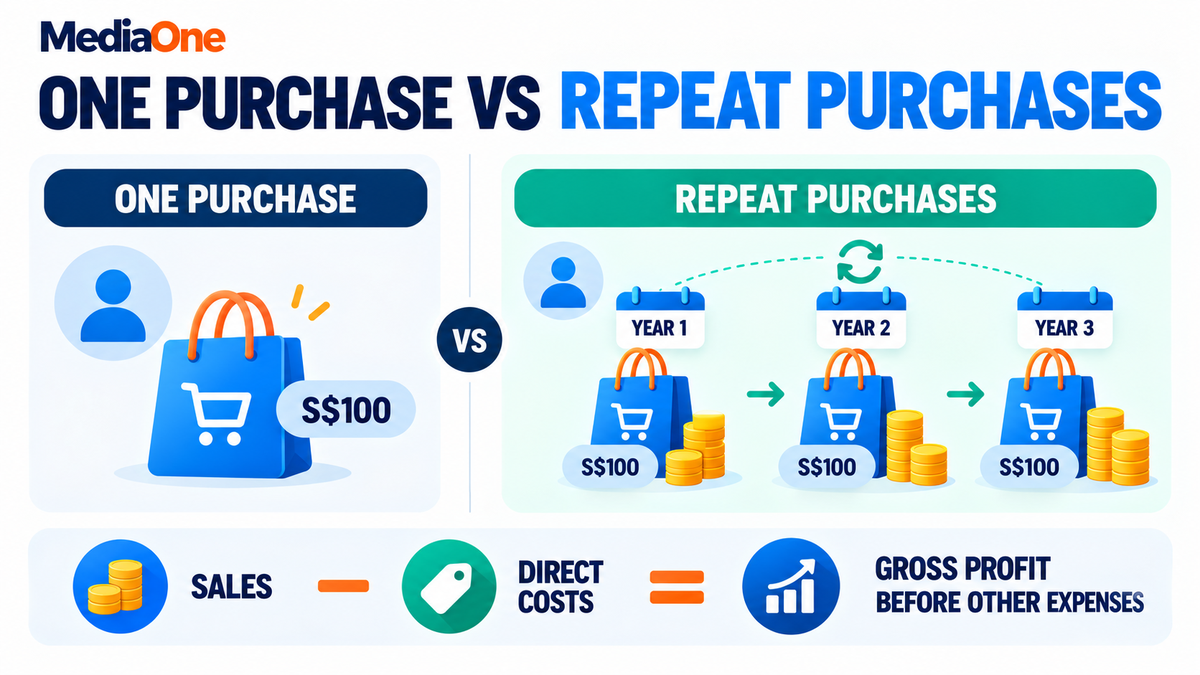
Customer lifetime value (CLV) estimates how much a customer contributes across their relationship with a business. The basic formula is average purchase value × purchase frequency × customer lifespan. Multiplying that result by the gross margin percentage estimates lifetime gross profit before acquisition costs and other operating expenses.
Key Takeaways
- Revenue-based CLV and profit-based CLV answer different questions. Every report should identify which version it shows.
- Annual purchase frequency belongs with lifespan measured in years. Monthly inputs need a monthly calculation.
- Customers acquired together should be compared after the same amount of time.
- A chosen CLV-to-acquisition-cost ratio is a planning target, not a guarantee of profit.
- Retention campaigns need to earn enough extra margin to cover their costs.
- Forecasts should be tested against later results before they support larger budgets.
A customer’s first purchase tells only part of the story. Someone who places a small order today may return regularly. Another customer may spend more once and never buy again.
Customer lifetime value helps businesses understand that difference. For a Singapore retailer, subscription company or service provider, it connects repeat business with decisions about advertising and customer care.
The challenge is keeping the calculation honest. Revenue, gross profit and net profit are different figures, and each leads to a different spending decision.
All amounts below are illustrative examples in Singapore dollars, shown as S$. They are not market benchmarks.
What Is Customer Lifetime Value?
Customer lifetime value measures a customer relationship across time. Some businesses calculate total expected sales. Others estimate the profit or cash contribution those sales will produce.
Both approaches have a purpose, provided the report names the measure.
Revenue CLV and profit-based CLV
Revenue CLV estimates the money customers spend. Margin-adjusted CLV accounts for specified costs before estimating their contribution.
The distinction affects how much money remains for marketing and running the business.
| Measure | What it includes | What it tells you |
| Revenue-based CLV | Expected customer sales | The size of the relationship |
| Gross-profit CLV | Sales minus cost of goods or direct delivery costs | The amount remaining before other expenses |
| Contribution-based CLV | Sales minus defined variable costs | The amount available towards acquisition, overheads and profit |
Gross profit is not net profit. Rent, administration and other expenses may still need to come out of it.
Why CLV changes marketing decisions
Two campaigns can bring in customers at the same acquisition cost but produce different long-term results.
One group might return every few months. Another might buy only during a sale. Their first orders can look similar while their later contribution differs.
CLV adds this longer view to e-commerce marketing. It helps businesses assess whether a channel brings customers who continue buying at a sustainable margin.
How to Calculate Customer Lifetime Value Step by Step
The basic customer lifetime value formula combines average purchase value, purchase frequency and customer lifespan. This revenue-based CLV calculation estimates sales across the relationship before costs.
A spreadsheet is enough for a first calculation. The important work happens before the multiplication: choosing a customer group and checking its records.
Step 1: Choose the customers and period
A cohort is a group of customers who share a starting point, such as their first purchase month.
For this example, a business follows 40 customers for one year. Their purchases produce:
- Net sales of S$20,000.
- A total of 200 orders.
- Direct product costs of S$8,000.
Net sales here means sales after discounts and refunds. Tax collected on behalf of the authorities should not inflate customer revenue.
The same 40 customers belong in each calculation. Combining all company sales with only one group’s customer count would distort the result.
Step 2: Calculate average purchase value
Average purchase value measures spending per order. Retailers often call it average order value.
Average purchase value = net sales ÷ number of orders
In this example:
$20,000 ÷ 200 = $100 per order
The figure describes an average. Some orders will be larger, while others will be smaller.
Step 3: Calculate purchase frequency
Purchase frequency measures how often customers buy during a stated period.
Annual purchase frequency = annual orders ÷ customers in the group
The example produces:
200 ÷ 40 = 5 orders per customer per year
Annual frequency belongs with lifespan measured in years. A monthly frequency figure belongs with lifespan measured in months.
Step 4: Estimate customer lifespan
Customer lifespan describes how long people continue buying.
A subscription company can examine how long contracts remain active. A retailer needs to study repeat purchases over time because customers rarely announce that they have left.
For the calculation below, assume a three-year lifespan. This is a modelling assumption, not something established by the one-year sales figures.
A business with limited history should show a range of possible lifespans and label each estimate.
Step 5: Calculate revenue CLV
Revenue CLV = average purchase value × annual purchase frequency × lifespan in years
The result is:
$100 × 5 × 3 = $1,500
This customer is expected to generate S$1,500 in sales over three years, assuming the spending pattern continues.
The figure is undiscounted: it treats future payments at their face value.
Step 6: Apply gross margin
Gross margin expresses gross profit as a percentage of sales. It shows how much remains after the costs included in cost of goods sold.
| Calculation | Working | Result |
| Annual gross profit | S20,000-S8,000 | S$12,000 |
| Gross margin | S12,000÷S20,000 | 60% |
| Revenue CLV | S$100 × 5 × 3 | S$1,500 |
| Gross-profit CLV | S$1,500 × 60% | S$900 |
The S$900 estimate is lifetime gross profit before acquisition costs and other expenses.
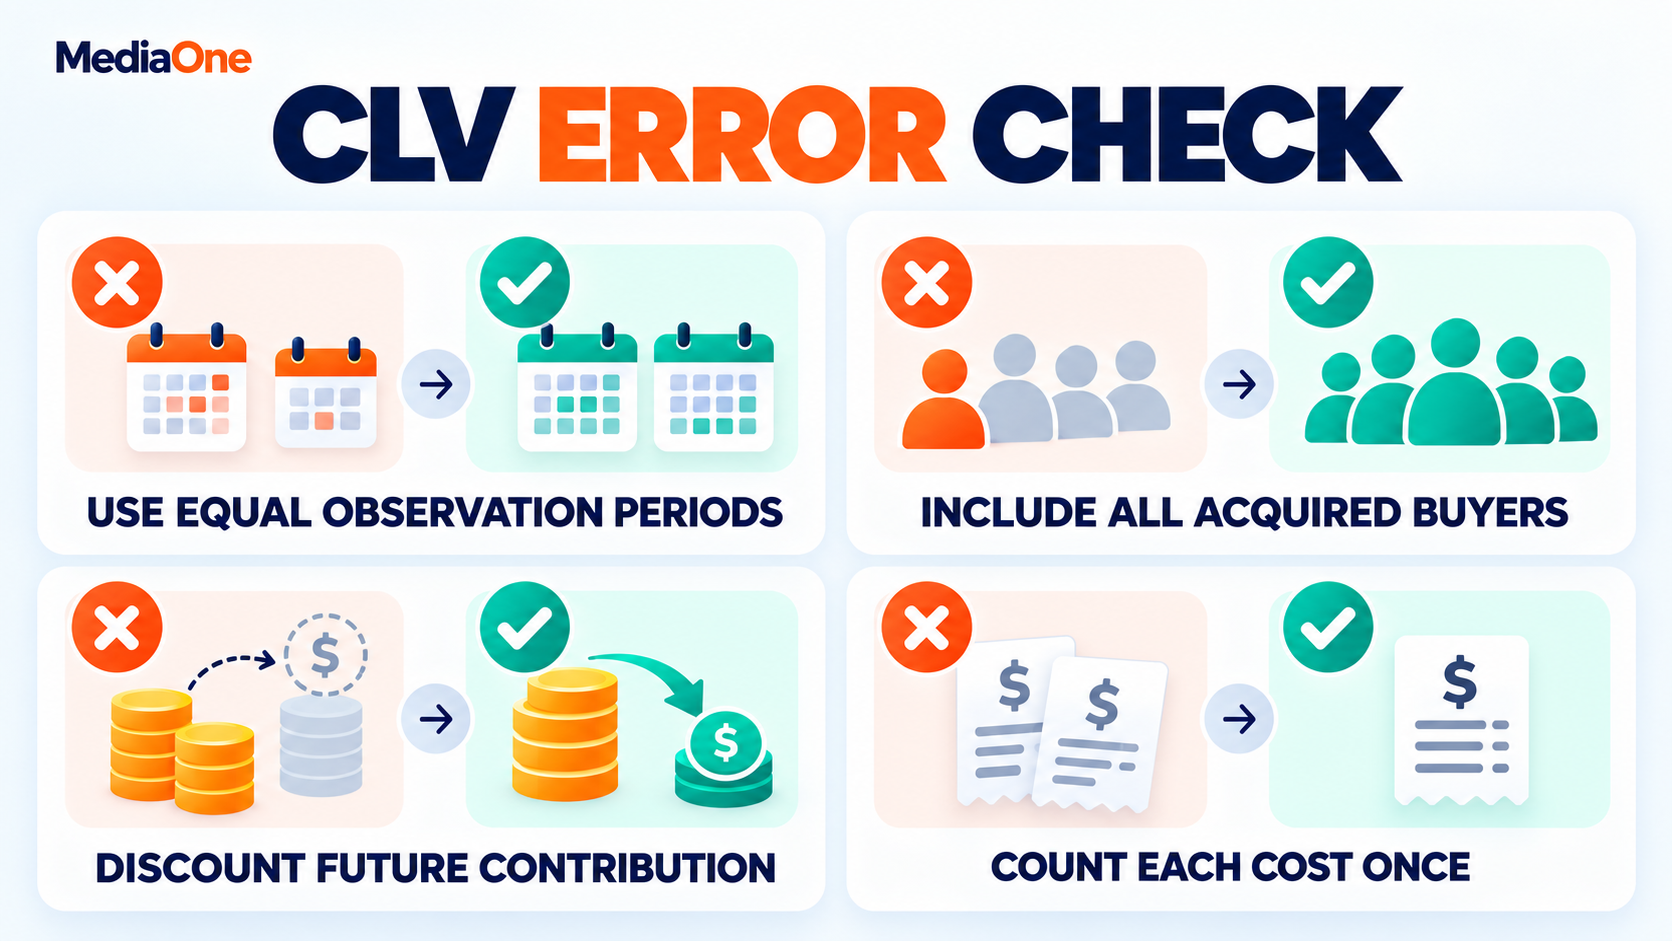
A further calculation can subtract variable fulfilment, payment or support costs where these have not already been included. Each cost should appear once.
How to Calculate CLV in Excel and Google Analytics
Spreadsheets and analytics tools serve different purposes. A spreadsheet can combine sales and cost data, while website analytics can help explain where customers came from and how they behaved.
Neither replaces accurate order and accounting records.
A spreadsheet calculation
The following layout works in Excel or Google Sheets.
| Cell | Input | Example or formula |
| B2 | Average purchase value | 100 |
| B3 | Annual purchase frequency | 5 |
| B4 | Lifespan in years | 3 |
| B5 | Gross margin | 60% |
| B6 | Revenue CLV | =B2*B3*B4 |
| B7 | Gross-profit CLV | =B6*B5 |
Currency formatting belongs on the monetary cells. The margin cell should contain 60% or 0.60, not the number 60.
A second worksheet can hold customer-level sales and costs. Microsoft’s SUMPRODUCT function multiplies corresponding values and adds the results, which can help combine different products’ quantities and margins.
What GA4 can show
Google Analytics 4’s User lifetime exploration can compare lifetime revenue and behaviour by acquisition source, medium or campaign. Google documents the template under Explore, then Template Gallery.
The report can help answer questions such as:
- Which sources brought users with higher recorded lifetime revenue?
- When did those users last purchase?
- How does recorded value differ between acquisition groups?
Website users and paying customers are not always the same unit. Missing transactions, tracking gaps and offline purchases can leave the picture incomplete.
Bringing sales and costs together
A practical reporting table connects a consistent customer identifier with purchase dates, net sales, relevant costs and acquisition information.
Accounting records establish the financial totals. Analytics adds information about measured website activity.
A monthly reconciliation can compare recorded purchases with the order system. Unexplained differences should be resolved before the report supports a major budget increase.
Historical and Predictive CLV: Which Method Should You Use?
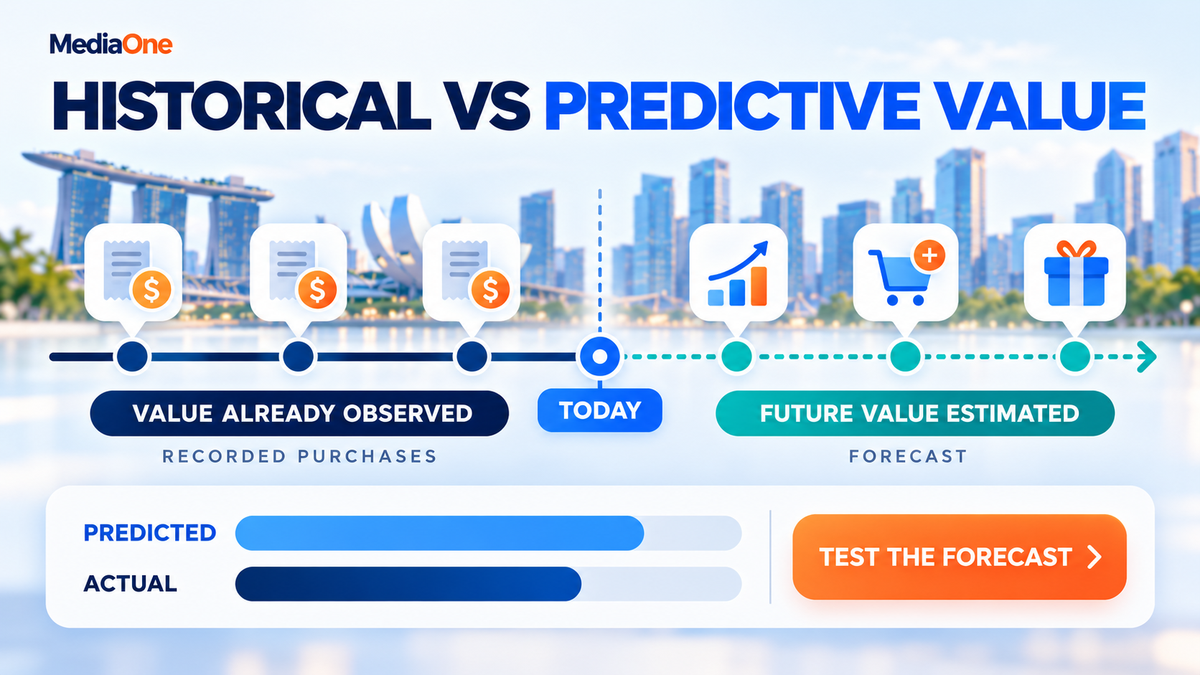
Historical CLV measures what customers have already contributed. Predictive CLV estimates what they may contribute in future.
The choice depends on the decision and the available evidence. A complex model cannot compensate for missing refunds or unreliable customer records.
Historical CLV measures contribution to date
The earlier cohort generated S$12,000 in gross profit across 40 customers during one year.
Observed gross profit per customer = S$12,000 ÷ 40 = S$300
The right label is “12-month gross profit per customer”. A full-lifetime label would imply that the relationships had ended or that future activity had been estimated.
Historical reporting is particularly helpful for comparing customers after a fixed period, such as six or twelve months.
Predictive CLV estimates future contribution
Predictive models consider expected purchases, spending, costs and continued customer activity.
Model choice depends on the business. A cancelled subscription provides a different signal from a retail customer who has not ordered recently.
Research by Fader, Hardie and Jerath on CLV in non-contractual businesses explains why standard retention calculations do not transfer directly to settings where customers can buy irregularly without cancelling.
A retailer therefore needs to distinguish a long gap between purchases from a relationship that has ended.
Testing a forecast before trusting it
A forecast needs a later reality check. One approach is to build the estimate using earlier records, then compare its predictions with purchases from a period the model has not seen.
The comparison should examine:
- Predicted and actual contribution.
- Results across customer groups.
- Errors caused by unusual promotions or product changes.
- Whether the model consistently overstates future purchases.
A small overall error can hide large errors within individual groups. Those differences become important when campaigns target those groups separately.
Why retention assumptions need care
Retention does not necessarily stay constant throughout a relationship. Fader and Hardie’s research on projecting customer retention examines how differences between customers affect retention patterns over time.
A young business can begin with observed results and several labelled scenarios. Its forecast can become more detailed as additional purchase history becomes available.
How to Use CLV to Set Acquisition Budgets
CLV becomes a budgeting tool when businesses compare customer contribution with customer acquisition cost, or CAC.
CAC measures the acquisition spending needed to win one new customer. It should include the sales and marketing costs assigned to that activity.
Calculate CAC using the full acquisition cost
CAC = acquisition-related sales and marketing spending ÷ new customers acquired
Suppose a campaign uses S$9,000 in advertising, creative work, acquisition tools and allocated sales effort. It brings in 60 new customers.
S$9,000 ÷ 60 = S$150 CAC
The customer count should include new paying customers, not every enquiry. That distinction connects online lead generation with the eventual cost of winning business.
Long sales cycles need extra care because this month’s spending may produce customers several months later.
Compare CLV and CAC on a stated basis
CLV-to-CAC ratio = CLV ÷ CAC
Using the earlier S$900 gross-profit CLV and S$150 CAC gives a ratio of 6:1.
That ratio leaves S$750 in expected gross profit after acquisition spending, before other expenses. It does not establish net profit or show when the money arrives.
No single ratio suits every business. A chosen target needs to account for overheads, uncertainty and available cash.
Set a planning ceiling
A business can translate its chosen ratio into a CAC ceiling.
CAC ceiling = margin-adjusted CLV ÷ chosen target ratio
For illustration, a team chooses a 3:1 target. With S$900 gross-profit CLV, its planning ceiling is S$300.
A campaign above S$300 would miss that target. It would not automatically lose money, because the ratio target and the break-even point are different.
Check how quickly spending is recovered
Payback measures how long customer contribution takes to cover acquisition spending.
A subscription customer producing S$30 in monthly contribution would take six months to repay S$180 CAC, assuming that contribution continues.
A business should assess:
- How much cash acquisition uses upfront.
- When customers make payments.
- How much contribution arrives each period.
- Whether customers remain active long enough to repay CAC.
A favourable lifetime estimate cannot pay today’s bills before those future payments arrive.
Interpret advertising platform values carefully
Google Ads’ new customer lifetime value reporting includes a conversion value adjustment associated with a new customer’s first purchase. Google states that this column does not include repeat purchases.
That platform figure should not be treated as a completed accounting record of lifetime profit.
How to Increase Customer Lifetime Value
Higher CLV comes from changes in spending, buying frequency, relationship length or delivery costs.
The best starting point is a specific problem customers already experience. A campaign built around that problem has something measurable to improve.
Help customers succeed after their first purchase
Customers need to receive what they expected and understand how to use it.
A furniture seller might send care instructions. A software business might help new users complete their first task. A maintenance company might explain what happens after the initial visit.
An email marketing lifecycle can organise these messages around purchase and service events.
Each message should have a purpose beyond asking for another sale. The relevant measure might be product activation, fewer avoidable returns or a second purchase within the normal buying cycle.
Increase order value without erasing margin
Bundles and related products can increase spending when they solve a real customer need.
A printer retailer could offer compatible paper alongside a printer. The extra sale helps only if the business retains enough contribution after the bundle discount and delivery costs.
A simple test compares:
| Measure | Original offer | New offer |
| Average order value | Sales per order | Sales per order |
| Contribution per order | Amount after defined variable costs | Amount after the same costs |
| Repeat-purchase behaviour | Baseline result | Result after the change |
Higher sales with lower contribution may leave less money available for the business.
Group customers by their buying behaviour
An overall average can conceal differences between frequent buyers, occasional buyers and customers who buy only during promotions.
Audience segmentation helps businesses organise these patterns and choose relevant follow-up activity.
A replenishment reminder may suit someone who regularly buys the same product. A customer who buys gifts once a year needs a different schedule.
The group’s expected contribution should also cover the cost of the offer. An expensive reward can consume the value it was meant to protect.
Test whether loyalty rewards create extra purchases
Loyalty programmes need to generate enough additional contribution to cover rewards, software and administration.
Members may already have been frequent buyers before joining. Comparing their spending with non-members does not, by itself, prove that the programme caused an increase.
A pilot can compare similar eligible groups over the same period. Where practical, random assignment helps reduce differences between the groups.
The financial calculation should include extra contribution and programme costs, with results assessed across the full test period.
Remove service problems that discourage repeat business
Support records can reveal recurring delivery delays, billing errors or product confusion.
A business can group these issues, address the most common causes and track whether repeat purchasing improves.
Consistent marketing communications also help set expectations before and after the sale. A delivery promise should match what operations can provide.
Customer feedback explains the problem; purchase and cost records show the financial result.
Measure paid and owned channels together
A returning customer might receive an email, search for the brand and then click an advertisement.
Comparing paid and owned media requires a consistent rule for assigning credit. Otherwise, several channels may each claim the same purchase.
The total customer value should appear once in the company’s financial view, even when several marketing activities helped produce it.
Common CLV Mistakes That Distort Decisions
Most misleading CLV figures begin with an input or definition problem. A short review before each update can prevent an inaccurate number from becoming an accepted target.
Comparing customers with different amounts of history
Customers acquired two years ago have had longer to purchase than customers acquired last month.
A fair comparison measures each group after the same elapsed period. A six-month contribution report should give every group six months of purchase history.
Removing customers who lower the average
One-time buyers and promotional customers belong in the overall acquisition result if the business paid to acquire them.
A separate segment can explain their behaviour. Deleting them makes the campaign’s average look stronger than its actual outcome.
Refunded orders, cancelled sales and relevant losses also need consistent treatment.
Treating future money as money available now
Discounting reduces future amounts to a present-value estimate. It reflects the timing of the expected contribution.
For illustration, assume a customer produces S$100 at the end of each of the next two years and the business selects a 10% annual discount rate.
| Expected payment | Present-value calculation | Present value |
| Year 1: S$100 | S$100 ÷ 1.10 | S$90.91 |
| Year 2: S$100 | S$100 ÷ 1.10² | S$82.64 |
| Total | Sum of both amounts | S$173.55 |
The 10% rate is an example, not a universal recommendation. Expected customer activity must also be reflected in the forecast.
Reporting a number without its assumptions
A CLV report should state:
- The customer group and observation period.
- Whether it measures revenue, gross profit or contribution.
- The costs included.
- The forecast horizon and retention assumptions.
- Any discounting applied.
These details let another person reproduce the calculation and explain why the result changed.
Conclusion: Put Customer Lifetime Value Into Your Marketing Decisions
Customer lifetime value gives marketing teams a longer view of the business they bring in. Its value comes from connecting customer purchases with costs, acquisition spending and the time needed to recover that spending.
A first review can focus on one customer group and one decision, such as whether a campaign deserves more budget. The calculation should show what happened, what remains a forecast and which assumption could change the decision.
MediaOne’s digital marketing consultation gives businesses a place to discuss acquisition and retention priorities alongside their wider marketing activity. Sales history, campaign spending and repeat-purchase records provide a practical starting point for that conversation.
FAQs about Customer Lifetime Value (CLV)
What is the difference between CLV and LTV?
CLV and LTV often describe the same metric. CLV spells out “customer lifetime value”, while LTV shortens “lifetime value”. Company definitions can differ, so the label alone is insufficient. A report should explain the value measured, the customer unit and the costs deducted.
Can customer lifetime value be negative?
Customer lifetime value can be negative when the costs included in the calculation exceed the value generated. A customer who makes frequent returns or requires costly service may produce this result. The business should check the records and cost allocation before deciding how to respond.
How should referrals be included in CLV?
Referral value is best recorded separately from the customer’s own purchases. A referred customer has their own spending, costs and acquisition history. Adding the same referred purchases to several customers’ CLV would count the value repeatedly. A separate referral measure can show this additional contribution.
What does CLV mean for a business with mostly one-time purchases?
CLV can still measure the expected contribution from a single transaction, including later costs such as returns or warranty service. A business should not invent repeat purchases to create a larger lifetime figure. Its acquisition budget may depend mainly on the contribution from that first sale.
How should businesses calculate CLV across currencies?
A shared reporting currency makes customer groups comparable. The business should apply a consistent exchange-rate method and document it. Exchange-rate changes can alter reported CLV even when customers buy the same amounts, so international reports should distinguish purchasing changes from currency effects.