
Audience segmentation is the practice of dividing your customers or prospects into distinct groups based on shared characteristics, behaviours or needs. Rather than treating everyone the same, segmentation lets you speak to each group in their language, at the right time, with offers that matter.

Segmented email campaigns show higher engagement than broadcast sends. When you stop broadcasting to everyone and instead tailor frequency, channel, message and offer to segment behaviour, three measurable outcomes follow: conversion rates climb, unsubscribe and complaint rates fall, and customer lifetime value grows. In budget terms, these gains compound into substantial ROI improvements.
In 2026, segmentation has evolved beyond static demographic buckets. Privacy regulations have tightened. Third-party data is unreliable. Customer behaviour shifts faster than quarterly reviews. This guide walks you through segmentation as a practical, measurable discipline: how to build segments that actually predict profit, implement them across channels, and sustain them as your business scales.
Key Takeaways
- Segmentation divides customers into actionable groups based on shared characteristics, enabling higher ROI and retention than broadcast messaging.
- Six core segmentation models exist; the right choice depends on your business type, available data, and whether you are optimising for acquisition, retention or lifetime value.
- A five-step framework (gather data, define objectives, cluster through analysis, validate profitability, and document personas) reduces the risk of over-segmentation and failed campaigns.
- Measurable success requires segment-level conversion rates, cost per acquisition by segment, and churn analysis; without these, segmentation becomes guesswork.
What Audience Segmentation Is and Why It Matters
Segmentation answers one question: which customers or prospects behave similarly enough to deserve the same marketing treatment?
Two customers might both be 35-year-old women in Singapore, but one researches for three months before buying and spends heavily on support. The other is an impulse buyer who rarely opens an email. Lumping them together wastes money on both. One gets pushed too hard; the other never gets reached.
Segmentation recognises that your audience is not a monolith. Multiple distinct customer groups may share demographic traits but behave differently. Real segments are built on variables that predict behaviour or value: past purchases, engagement patterns, stated preferences, problem severity, and buying-stage signals.
At its core, segmentation answers a single business question: which distinct groups exist within my audience, and what do they need? The answer is typically between three and eight core segments, each large enough to justify marketing investment but small enough that one message can resonate genuinely.
The Core Principle: Dividing Audiences Into Distinct Groups
A 45-year-old enterprise software buyer behaves differently from a 22-year-old social media user. A price-sensitive bargain hunter differs from a premium, convenience-focused buyer. A churned customer needs different messaging than a loyal advocate.
Segmentation identifies these differences and groups customers by the dimensions that matter most to your business. Those dimensions might be age, purchase history, company size, technology stack, geography, or engagement level. The goal is to create groups small enough to feel distinct but large enough to act on with a real budget and resources.
How Segmentation Improves Marketing ROI and Customer Satisfaction
When you tailor frequency, channel, message and offer to segment behaviour, three measurable outcomes occur simultaneously.
First, conversion rates climb. Customers who are ready to renew see a renewal offer, not a new-customer discount. Prospects in early research read a comparison guide, not a demo request. Relevance increases purchase intent directly.
Second, unsubscribe and complaint rates fall. A segment that receives communications at their preferred frequency using their preferred channel reports lower churn. Relevance breeds permission.
Third, lifetime value grows. Retention improves when you catch at-risk customers before they leave. Cross-sell success rates increase when you offer products related to what a customer has already bought. Upsell conversion multiplies when you time the offer to their natural cycle.
Segmentation also improves customer experience. A prospect who receives content that matches their actual knowledge level, industry, role, or buying stage feels understood rather than targeted. Satisfaction metrics reflect this alignment. Companies that segment their audiences report higher engagement and lower unsubscribe rates than those that use a single, generic message.
The Link Between Segmentation and Customer Lifetime Value
Customer lifetime value (CLV) is the total profit a customer will generate over the entire relationship. Segmentation is a CLV lever because it lets you invest proportionally in each segment.
A high-value segment that generates 10 times the revenue of a low-value segment deserves 10 times the acquisition and retention spend. A segment with a 60% retention rate deserves different interventions than a 20% segment. A segment trending toward churn deserves a save campaign; a segment trending toward expansion deserves a cross-sell series.
Without segmentation, you treat everyone the same. You lose high-value customers to attrition while pouring money into low-intent prospects. With segmentation, CLV becomes a decision framework. A customer acquired for $200 who stays two months has a CLV of $0. A customer acquired for $500 who stays three years has a CLV of $5,000. Same acquisition cost, opposite business outcome.
Segmentation influences CLV in three further ways. It identifies which segments are worth acquiring in the first place. It enables retention strategies tailored to why each segment churns, since price-sensitive customers respond to discounts or loyalty rewards, while feature-limited users respond to product education or premium-tier offers. And it uncovers upsell and cross-sell opportunities that generic campaigns miss.
Six Core Segmentation Models and When to Use Each
Demographic Segmentation: Age, Gender, Income, Location
Demographic segmentation divides audiences by population characteristics: age, gender, income, marital status, education level, and location. These variables are easy to collect and understand, making demographic segmentation the entry point for most new practitioners.
Demographic data is useful when product or service utility varies genuinely by age group or income bracket. A luxury financial product targets high-income earners differently from a budget bank account. A parenting product targets parents aged 25-45 differently from grandparents. Geographic data (postcode, region, country) matters when shipping costs, regulatory requirements, or local competitors vary.

The limitation: demographics alone rarely predict behaviour. Two 35-year-old women with the same income can have opposite purchase preferences. Demographics are a start, not a finish.
Behavioural Segmentation: Purchase History, Engagement Patterns, Product Usage
Behavioural segmentation groups customers by what they do: purchase frequency, order size, product category preference, email engagement, website browsing patterns, or support ticket volume. This is the most predictive segmentation type, as behaviour directly signals intent and satisfaction.
A customer who has bought from you five times behaves differently from a one-time purchaser. Repeat buyers have higher lifetime value, lower acquisition cost (because they are already acquired), and greater cross-sell and upsell potential. Segmenting repeat buyers separately justifies a different investment strategy than first-time buyers.
Usage patterns reveal both opportunity and risk. Heavy users are unlikely to churn and are prime candidates for premium upsells. Light users or declining users signal churn risk and warrant retention campaigns. Email engagement data (opens, clicks, unsubscribes) shows who is paying attention and who is not.
Psychographic Segmentation: Values, Interests, Lifestyle and Pain Points
Psychographic segmentation divides audiences by psychological attributes: values, beliefs, interests, lifestyle aspirations, and stated pain points. Unlike demographics, psychographics capture why people buy, not just who they are.
A customer might value sustainability, prefer indie brands, and aspire to minimalism. Another might prioritise convenience, trust large established names, and optimise for time-saving. Same age and income; opposite messaging approach. Psychographic data comes from surveys, social media analysis, customer interviews, and purchase pattern inference.
Psychographic segmentation works well in competitive markets where product features are similar, but brand positioning differs. It is essential for premium or lifestyle brands where emotional connection drives loyalty. It is also valuable in B2B, where a company’s size and industry matter less than the individual buyer’s role, priorities, and pain points.
Firmographic Segmentation: Company Size, Industry, Revenue (B2B Focus)
Firmographic segmentation applies demographic logic to businesses. It divides B2B prospects and customers by company size (employee count or revenue), industry, years in business, growth stage, technology stack, and operational structure.
A 50-person fintech startup needs different solutions from a 5,000-person bank. An early-stage SaaS company has different budget authority and buying cycles than a mature enterprise. Firmographic segmentation aligns marketing and sales messaging to the buying reality of each company type.
Firmographics are straightforward to collect via CRM data, company databases (LinkedIn, Crunchbase, ZoomInfo), and public filings. They are essential for B2B account-based marketing, where strategy is built around specific target accounts grouped by firmographic profile.
Geographic Segmentation: Region, Climate, Urban vs. Rural, Cultural Context
Geographic segmentation divides audiences by physical location: country, region, postcode, urban vs. rural, and climate zone. Location affects product demand, shipping cost, regulatory environment, local competition, and cultural messaging preferences.
A product that sells well in Singapore might have zero demand in rural Scotland. A weather-dependent product (winter coats, sunscreen) needs seasonal messaging by climate. A service with physical locations (retail, healthcare) must segment by geography to route customers to the nearest branch and manage local stock.
Geographic segmentation is foundational in retail, hospitality, and location-dependent services. It is also essential for global brands that operate across multiple markets with different regulations, languages, and consumer preferences.
Technographic Segmentation: Software Adoption, Platform Preference, Digital Maturity
Technographic segmentation groups customers by their technology infrastructure and digital behaviour. Variables include software tools used, operating system or device preference, cloud vs on-premises stack, mobile vs desktop usage, and overall digital maturity.
A customer using Salesforce, HubSpot, and Slack is a different buyer from one using legacy on-premise systems. An analytics-forward customer who tracks everything in Google Analytics behaves differently from one who ignores data. A mobile-first user needs different web experiences than a desktop-focused user.
Technographic data comes from website analytics, CRM integration data, cookies, purchase history, and third-party integrations. Technographics are especially valuable in B2B SaaS, where product fit depends on the existing tech stack and willingness to adopt new tools.
Choosing Your Segmentation Model: A Decision Framework
No single segmentation model is correct. The right choice depends on three factors.
Business Type: B2C and B2B differ sharply. B2C typically combines demographic, behavioural, psychographic, and geographic segmentation. B2B relies more heavily on firmographics and technographics, with behaviour as a secondary layer. Account-based marketing in B2B often starts with firmographic targeting, then layers in buyer persona and buying-stage segmentation.
Data Availability: You can only segment on data you have or can access. If you have rich transactional history, behavioural segmentation is immediate. If you have survey data or social media listening, psychographic segmentation is feasible. If you operate globally with physical locations, geographic segmentation is essential. If you are starting from scratch with only email addresses, demographic inference or simple behavioural clustering is the entry point.
Business Objective: Are you optimising for new customer acquisition, retention of existing customers, or expansion of customer lifetime value? Acquisition often starts with demographic and geographic targeting to reach new markets. Retention relies on behavioural and psychographic segmentation to identify at-risk customers and develop save campaigns. To identify cross-sell and upsell opportunities, behavioural and firmographic segmentation is essential for driving lifetime value growth.
Building a Segmentation Strategy: A Five-Step Framework
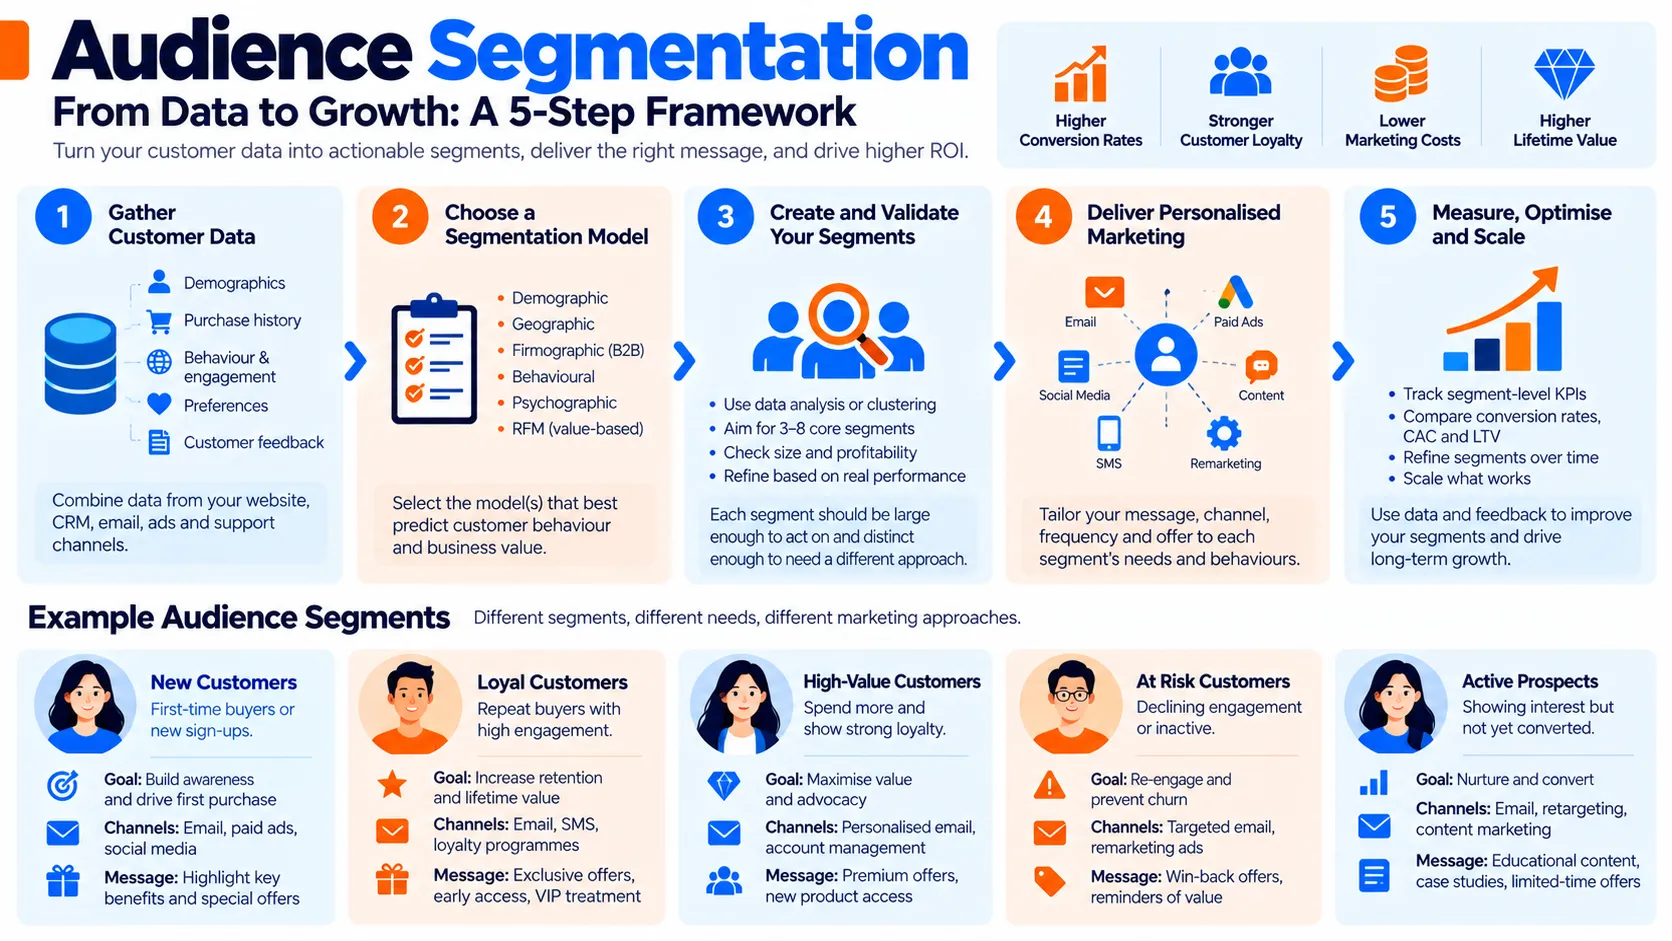
Step 1: Gather Zero-Party, First-Party and Transactional Data
Zero-party data is information customers actively share: survey responses, preference centres, stated interests. First-party data is information you collect: website behaviour, email engagement, purchase history, customer service interactions. Transactional data is structured information: order value, product category, purchase frequency, and customer tenure.
Do not rely on third-party cookies or purchased lists. Collect data directly through surveys, preference centres, transactional records, and customer interviews. Document what you have and what you are missing.
Step 2: Define Your Business Outcomes and Segment Objectives
Segmentation works backwards from business outcomes. What are you optimising for? Acquisition cost per segment? Retention rate by segment? Revenue expansion per customer? Churn reduction?
Write one clear objective: “Reduce churn by 15% in our high-value segment by identifying at-risk customers and delivering targeted save campaigns.” Then identify which variables (behaviour, history, engagement, firmographics) will predict churn within that segment.
Step 3: Run Exploratory Analysis to Identify Natural Clusters
Using your available data, run exploratory analysis to find natural clusters. This might be simple (divide by purchase frequency: repeat buyers vs. one-time) or complex (run clustering algorithms on demographic, behavioural, and psychographic data combined).
The goal is not to create micro-segments for vanity. Create three to eight core segments, each large enough to justify dedicated marketing spend. Validate that each segment is internally coherent and externally distinct.
Step 4: Validate Segments Against Acquisition Cost and Lifetime Value
Not all segments are profitable to pursue. Calculate the acquisition cost and lifetime value for each segment. A segment with low lifetime value may not justify high acquisition spend.
Rank segments by CLV and acquisition costs. Prioritise segments with the highest CLV and lowest acquisition cost. The segments with lowest CLV are either candidates for low-touch, high-volume outreach (if acquisition cost is near zero) or candidates to abandon entirely.
Step 5: Document Segment Personas with Decision-Level Detail
Create a persona for each core segment. Include: demographic summary, behavioural traits, key pain points, stated preferences, buying cycle, decision makers (in B2B), and recommended messaging.
Do not create personas based on guesswork. Ground each persona in actual customer data. If you do not have survey data on a particular question, do not invent the answer. Note where data is assumed or missing.
Common Segmentation Mistakes and How to Avoid Them
| Problem | Why It Happens | How To Fix |
|---|---|---|
| Over-segmentation (too many micro-segments) | Desire to personalise everything; lack of discipline on minimum segment size | Enforce a rule: each segment must contain at least 5% of your customer base or 100 customers, whichever is larger |
| Static segments that ignore behaviour change | Segments are built once and never updated | Refresh segment membership quarterly; flag customers moving between segments |
| Unequal profit allocation across segments | Treating all segments the same despite vastly different CLV | Rank segments by CLV; invest proportionally in acquisition and retention spend |
| Segments based on convenient data, not predictive data | Using only what is easy to measure (age, location) rather than what predicts behaviour (purchase frequency, engagement) | Audit your segmentation variables; replace convenience variables with behaviour or outcome predictors |
| No test of segment-level ROI | Running segmented campaigns without measuring lift or conversion by segment | Add segment ID to all campaigns; measure conversion, cost per acquisition, and ROI by segment |
| Ignoring low-value segments entirely | Abandoning unprofitable segments without testing lower-cost outreach | Test low-touch, high-volume approaches (automation, self-service) for low-value segments |
Implementing Segmentation Across Marketing Channels
Email Marketing
Tag contacts with segment ID in your email platform. Create segment-specific send times, frequencies, and content tracks. A high-engagement segment might receive three emails per week; a low-engagement segment might receive one.
Build separate flows for each segment. Repeat buyers see a loyalty programme email series. First-time buyers see onboarding and education content. At-risk customers (declining engagement or support tickets) see win-back campaigns.
Website and Landing Pages
Use segment data to personalise website experiences. Show different messaging, offers, and next steps based on segment. A returning customer sees a loyalty offer; a new visitor sees an educational guide.
Build segment-specific landing pages for paid campaigns. A firmographic segment (enterprise) lands on an enterprise-focused page. A price-sensitive segment lands on a value-focused page.
Paid Advertising
Layer segment data into your audience targeting. Create lookalike audiences based on your highest-CLV segment. Build exclusion lists: exclude customers already in your highest-value segment from acquisition campaigns; focus spend on lower-penetration segments with similar profiles.
Bid higher for high-CLV segments; bid lower for breakeven or low-CLV segments. This forces spend allocation toward profit.
Customer Relationship Management
Record segment membership in your CRM, along with firmographic, demographic, and behavioural data. Use segment membership to route leads to the right salesperson (account-based marketing in B2B). Trigger segment-based workflows when customers move between segments.
Technology Tools and Platforms for Segmentation at Scale
| Platform | Best For | Key Features | Integration Depth |
|---|---|---|---|
| HubSpot | Mid-market B2B and B2C | Built-in segmentation, email, CRM, landing pages | Native, all-in-one |
| Klaviyo | E-commerce | Email segmentation, predictive analytics, SMS | Deep e-commerce integration |
| Amplitude | Product-led growth and mobile | Behavioural analytics, cohorts, experimentation | Event-based, product analytics |
| Segment (Twilio) | Multi-channel data integration | Data collection, unification, destination routing | 500+ integrations |
| Salesforce | Enterprise B2B | Marketing Cloud, account-based marketing, firmographics | Extensive CRM integration |
| mParticle | Customer data management | Cross-device tracking, segmentation, real-time activation | Omnichannel |
Measuring Segmentation Success: Key Performance Indicators
Track these metrics by segment to validate that segmentation is working.
Acquisition Metrics: Cost per acquisition by segment. Segments with lower acquisition cost are more scalable. Segments with higher acquisition cost may justify lower volume or different channels.
Engagement Metrics: Email open rate, click rate, and reply rate by segment. Conversion rate by segment on landing pages and product adoption. A segment with high engagement should see higher conversion.
Retention Metrics: Churn rate by segment. Renewal rate by segment (for subscription products). Net retention by segment (how much existing revenue is retained and expanded). High-value segments should have lower churn.
Profitability Metrics: Customer lifetime value by segment. Gross margin by segment (some segments may have higher service costs). Return on marketing investment by segment. A segment with rising CLV and stable acquisition cost shows positive ROI.
Operational Metrics: Segment size (percentage of total customer base). Segment migration (what percentage of customers move between segments each quarter). This reveals whether segments are stable or shifting rapidly.
Segmentation in Regulated and Privacy-First Environments
Singapore Regulatory Framework
Segmentation in Singapore is governed by the Personal Data Protection Act (PDPA), administered by the Personal Data Protection Commission (PDPC). The PDPA requires that you collect customer data lawfully, handle it transparently, and use it only for purposes the customer has consented to.
For segmentation, this means:
Consent: You must have explicit opt-in consent before adding a customer to an email segment or using their data for marketing purposes. Consent must be specific and not bundled with other terms.
Transparency: If you segment based on customer behaviour, you must be transparent about how you use that data. If a customer asks why they are receiving certain messages, you must be able to explain the segmentation criteria.
Access and Correction: Customers have the right to request what personal data you hold and how it is used. Your segmentation logic should be documentable and explainable.
First-Party Data Only: Build segments exclusively on data customers have directly provided (zero-party), data you have collected through their interactions (first-party), or data inferred from their behaviour. Do not rely on third-party data brokers or purchased lists, which expose you to consent and accuracy risks.
Data Minimisation: Collect only the data you need to segment effectively. Do not build a comprehensive psychographic profile from social media if email engagement and purchase history are sufficient.
Audit and Compliance
Please document your segmentation logic. Maintain records of customer consent. Ensure your CRM and email platform are configured to promptly honour opt-out requests. Run annual audits to confirm segment membership rules are current and customer data is accurate.
Six Core Segmentation Models and When to Use Each
The foundation of any segmentation strategy is choosing the right model for your data and business outcome. A single audience rarely fits into one model alone. Most mature segmentation programmes layer multiple models: you might use demographic and behavioural data to identify core segments, then apply psychographic insights to refine messaging, and firmographic criteria if you also serve enterprise accounts.

Knowing when each model delivers value prevents wasted effort on segmentation that doesn’t move the needle.
Demographic Segmentation: Age, Gender, Income, Location
Demographic segmentation divides audiences by measurable personal characteristics: age brackets, gender identity, household income, marital status, education level and home address.
This model is fastest to implement because demographic data is widely available and easy to collect at signup. It is particularly useful in B2C marketing, where product preferences and messaging often correlate with life stage.
When to use demographic segmentation:
- Your product has genuinely different appeal across age groups (children’s products, age-gated services, retirement planning).
- Price point varies significantly by income, and your acquisition channels differ by economic segment
- Regulatory requirements mandate demographic tracking (compliance, financial services, healthcare).
- Your conversion or retention rates show clear demographic skew.
When it falls short: Demographics alone rarely predict purchase intent or engagement. Multiple distinct customer groups may share demographic traits but behave differently. A household earning $75,000 in Jurong has different buying power than one earning the same in central Singapore. Demographic segmentation works best as a starting filter, not a standalone strategy.
Behavioural Segmentation: Purchase History, Engagement Patterns, Product Usage
Behavioural segmentation groups customers by what they actually do: purchase frequency and value, pages visited, email opens and clicks, feature adoption, time since last transaction, and cart abandonment patterns.
This model delivers the highest ROI because it is based on observed customer actions rather than assumptions. Repeat buyers behave differently from first-time buyers. Age and income do not explain the difference. Someone who clicks every email but never converts signals a different opportunity than someone who opens nothing.
When to use behavioural segmentation:
- You have six or more months of transaction or engagement history for most customers
- You want to identify high-value repeat buyers or at-risk churners quickly
- Your product has multiple features and usage levels (SaaS, app-based services)
- You need to personalise email send times or content based on proven patterns
How to build it: Start with recency, frequency and monetary value (RFM). Segment customers by when they last purchased, how often they buy, and their total spend. Layer in engagement: email click-through rate, website session count, feature adoption velocity. This combination predicts future behaviour.
A practical example: An e-learning platform might segment learners as (1) course completers, (2) course starters who did not finish, (3) one-time browsers, and (4) returning browsers who have not enrolled. Each group receives different messaging: completers receive upsells to advanced courses; non-finishers receive encouragement and deadline reminders; and browsers receive social proof and course reviews.
Psychographic Segmentation: Values, Interests, Lifestyle and Pain Points
Psychographic segmentation looks past demographics and behaviour to understand why customers buy: their values, beliefs, aspirations, fears and lifestyle choices.
This model answers the “why” behind purchase decisions. Two people of the same age and income may have completely different buying motivations. One prioritises sustainability, another prioritises luxury, and a third prioritises convenience. A customer segment defined purely by age or income masks these differences.
When to use psychographic segmentation:
- Your brand positioning relies on emotional or value-based appeal (sustainability, luxury, community, ethics)
- You are competing in a crowded market where messaging differentiation drives conversion
- Your product solves multiple problems, and you need to match messages to which pain point each segment feels most acutely
- You have survey data, customer interviews or social listening insights about motivations
How to build it: Psychographic data requires active collection. Use post-purchase surveys asking “What was most important to you in this purchase?”, preference centres at signup offering topic selection, or engagement patterns as proxies. Customers who visit sustainability pages or follow environmental content are signalling values-driven interests.
Data sources for psychographic segmentation: Customer interviews, post-purchase surveys, website behaviour tracking (which content sections each segment visits), social media listening, and preference centre choices. You can infer psychographic traits from behavioural signals without direct surveys.
A practical example: A financial services company might discover three segments with identical demographics but different motivations: (1) security-focused savers, (2) growth-focused investors, (3) impact-focused ESG investors. Each needs different product recommendations, risk messaging and educational content, even though traditional segmentation would lump them together.
When it falls short: Psychographic segmentation requires investment in research. It does not work well for commodity products where price and availability matter far more than values alignment. It also relies on your ability to collect or infer motivation data accurately, which can be costly for small teams.
Firmographic Segmentation: Company Size, Industry, Revenue (B2B Focus)
Firmographic segmentation applies demographic logic to businesses themselves. It divides accounts by company size (employee count, annual revenue), industry vertical, years in business, growth stage and organisational structure.
This model is essential in B2B marketing because purchasing power, buying committees, compliance requirements and product-market fit vary radically by firm profile. A ten-person startup and a 10,000-person enterprise have different budgets, sales cycles and decision processes, even in the same industry.
When to use firmographic segmentation:
- You sell to businesses (SaaS, enterprise software, B2B services)
- Price point or contract terms scale with company revenue or size
- Your product roadmap serves different industries or roles
- Sales cycles and buyer personas differ by account profile
Key firmographic dimensions:
- Employee headcount (startup, mid-market, enterprise)
- Annual revenue or funding stage
- Industry or vertical (healthcare, finance, retail, manufacturing)
- Geographic market (single country versus multinational)
- Decision-making structure (flat, hierarchical, decentralised)
Data sources: Company firmographic databases (ZoomInfo, Apollo, Hunter), public financial records, LinkedIn company profiles, CRM records, and industry directories. Most B2B platforms provide firmographic data at signup or through integrations.
A practical example: HR software vendors often segment as (1) small business (under 50 employees), (2) mid-market (50–500 employees), and (3) enterprise (500+ employees). Each segment receives different feature priorities, pricing, and sales complexity. A small business needs simple setup and affordability; an enterprise needs integrations, compliance and dedicated support.
Geographic Segmentation: Region, Climate, Urban vs. Rural, Cultural Context
Geographic segmentation divides audiences by physical location or location-influenced characteristics: country, state, city, urban density, time zone, climate zone, language and local cultural norms.
This model drives actionable strategy when location predicts genuine product demand differences, not just because location data is available. A winter clothing retailer in Canada cares about geographic segmentation. A digital SaaS vendor serving the same country benefits far less unless it optimises for regional pricing or language.
When to use geographic segmentation:
- Your product has seasonal demand that varies by climate
- Legal, regulatory or compliance requirements differ by region (tax, data residency, industry rules)
- You ship physical products and want to segment by logistics cost or delivery time
- Your pricing strategy adjusts for local purchasing power or market maturity
- Language or cultural messaging differs meaningfully by region
How geographic factors influence strategy: A food delivery app cares deeply about urban density: adoption rates, order frequency and customer density differ between dense cities and suburbs. A B2B software company serving global enterprises might segment by geographic region primarily for localisation and support time zones, not product differentiation.
A practical example: An e-commerce fashion retailer might segment as (1) Singapore, (2) Malaysia, (3) Thailand, (4) Philippines, (5) Vietnam and (6) Hong Kong. Each region receives region-specific inventory focus (heavier winter coats in the North, lighter fabrics in the South), messaging that reflects local climate and culture, and logistics management. A SaaS company with the same geographic footprint might use geography only for billing currency and support language, not for product segmentation.
Technographic Segmentation: Software Adoption, Platform Preference, Digital Maturity
Technographic segmentation groups customers by the technology they use, their digital adoption level, platform preference and technical sophistication. In simple terms, it means understanding which software platforms they already use, whether they prefer cloud or on-premises systems, and how comfortable they are with automation and integrations.
This model is increasingly important because it predicts onboarding ease, feature adoption, support burden, and willingness to integrate with other tools. A customer running legacy on-premises systems requires a different implementation than a customer native to cloud and API integrations.
When to use technographic segmentation:
- You sell to technical and non-technical users (SaaS, software, developer tools)
- Your product integrates with other platforms, and not all segments will use those integrations
- You are rolling out new technical features, and adoption varies by user tech stack
- Your target market ranges from digital natives to digital late-adopters
Key technographic dimensions:

- Operating system and device preference (iOS, Android, Windows, Mac, Linux)
- Cloud adoption level (on-premises, hybrid, fully cloud)
- Use of automation and API integration
- Prior experience with similar software categories
- Technical role or function (developer, marketer, operations, C-suite)
Data sources: Customer CRM records, product usage logs, support request analysis, integration audit trails, and onboarding assessment questionnaires. Technical traits also emerge naturally from product behaviour (which API features are enabled, which integrations are active).
A practical example: A marketing automation platform might segment by technographic profile: (1) agency partners with full tech stacks and API needs, (2) mid-market marketers using three to five integrations, (3) small business owners using just email and landing pages. The agency segment needs advanced workflows and API documentation. The small business segment needs templates and pre-built workflows that require zero coding.
Choosing Your Segmentation Model: A Decision Framework
| Situation | Best Primary Model | Secondary Models |
|---|---|---|
| You are B2C with clear demographic differences in product appeal | Demographic | Behavioural, psychographic |
| You are B2C with loyal repeat customers and usage data | Behavioural | Demographic, psychographic |
| You are B2B selling to mid-market and enterprise | Firmographic | Behavioural, geographic |
| You are selling in a premium or values-driven category | Psychographic | Demographic, behavioural |
| You have seasonal or climate-driven demand | Geographic | Demographic, behavioural |
| You are a SaaS platform serving mixed technical users | Technographic | Behavioural, firmographic |
Most effective segmentation strategies combine two or three models. A SaaS company might use firmographic segmentation as the base (different segments for startup versus enterprise), layered with technographic insight (startup segment includes developers; enterprise segment includes both developers and non-technical operations staff), then refined with behavioural data (which enterprises adopt heavy automation versus light configuration).
The key is starting with the model that predicts your highest-leverage outcome: revenue, retention, or conversion. Add secondary models only if they refine your understanding enough to change messaging, product focus or resource allocation.
Building a Segmentation Strategy: A Five-Step Framework
A sound segmentation strategy rests on five concrete steps, each building on the last. This framework scales from a startup with a few thousand customers to an enterprise managing millions of data points. Skip or rush any step and your segments will collapse under campaign pressure.
[IMAGE: A visual flowchart showing the five sequential steps of the segmentation framework: data-gathering inputs (CRM, analytics, surveys), objectives definition (acquisition, retention, upsell), exploratory clustering analysis with sample groupings, profitability validation with cost-benefit comparison, and persona documentation outputs.]
Step 1: Gather Zero-Party, First-Party and Transactional Data
Start by cataloguing what you actually know about each customer.
Zero-party data is what customers tell you directly: preference centre selections, survey responses, declared interests on signup forms. First-party data is what you observe: site behaviour, email opens, click patterns, login frequency. Transactional data records what they bought, when, and for how much.
Most teams have transactional data locked in CRM systems. Many have first-party data scattered across analytics platforms, email service providers and ad networks. Zero-party data often lives nowhere until you build a collection mechanism.
Begin by listing every source that holds customer information: your CRM, website analytics platform, email platform, customer service system, payment processor, loyalty programme and any point-of-sale system. For each source, document what fields exist and how fresh the data is. A customer record updated only at purchase is stale within weeks.
Then design a minimal zero-party collection. Add a preference centre to your email footer or customer account page. Ask two or three high-value questions at signup: “What is your biggest business challenge?” or “Which product categories interest you?” Avoid surveys longer than five questions, or completion rates will suffer.
Finally, audit data quality. Flag duplicate records, null fields, formatting inconsistencies and invalid values. Segmentation built on poor data produces poor segments.
Step 2: Define Your Business Outcomes and Segment Objectives
Before you divide audiences, be clear about why. Segmentation without a business outcome is an intellectual exercise that consumes engineering time and rarely launches.
Ask yourself: what customer behaviours or business results do I want to change? Common answers include increasing average order value in a growth segment, reducing churn in high-lifetime-value customers, accelerating onboarding for enterprise accounts, or clearing stalled opportunities in a sales pipeline.
Write down two or three outcomes in plain language. Not “improve engagement” but “increase email open rate for inactive segments from 12% to 18% in six months” or “reduce customer acquisition cost for SMB accounts from $180 to $140 per signup.”
Now reverse-engineer the segments you need to hit those outcomes. If your outcome is to reduce churn among high-value customers, your primary segment is “customers with a lifetime value above $5,000 who have logged in zero times in the last 30 days.” If your outcome is to accelerate onboarding, you need a segment for “users who completed signup but have not completed their first task within 48 hours.”
Document the business owner for each outcome. Accountability prevents segments from becoming orphaned and ignored once they ship.
Step 3: Run Exploratory Analysis to Identify Natural Clusters
With data in hand and outcomes defined, search for natural groupings. Your goal is to find where customers actually cluster, not to force artificial boundaries.
If your data lives in a CRM or analytics platform, use built-in clustering tools. HubSpot and Salesforce both include unsupervised segmentation features that group customers by similarity. Google Analytics 4 offers predictive audiences and behaviour-based clustering. If your data is in a spreadsheet or data warehouse, use k-means clustering in Python (scikit-learn) or R to identify natural cut points.
Run analysis on the dimensions that matter to your outcomes. If you are chasing higher average order value, cluster on purchase frequency, order size and product category. If you are reducing churn, cluster on engagement signals: login frequency, feature adoption and support ticket volume.
The output of this step is not final segments. It is a map of where your customers naturally fall. You might discover that your “power users” cluster into two distinct groups: those who use your product daily for one specific workflow and those who use it several times a week across multiple features. That distinction shapes your messaging and product roadmap.
Document the variables that drove each cluster. If income and age separate customers clearly, demographic segmentation is high-signal. If behaviour (purchase frequency, time since last purchase) separates them, behavioural segmentation dominates.
Step 4: Validate Segments Against Acquisition Cost and Lifetime Value
Not all segments are worth pursuing. A segment that costs $300 to acquire but generates $200 in lifetime value destroys margin. A segment that is profitable but represents 0.3% of your customer base may not justify dedicated campaign spend.
For each cluster you identified, calculate two metrics:
Customer Acquisition Cost (CAC): Total marketing spend divided by new customers acquired in that segment, over a fixed period (usually 12 months).
Customer Lifetime Value (CLV): Predicted revenue from that customer over their entire relationship with you. A simple model: (average annual revenue per customer) × (average customer lifespan in years) × (profit margin).
Plot each segment on a two-by-two matrix.
| Segment Type | CLV Status | CAC Status | Action |
|---|---|---|---|
| Defend and grow. | High | Low | Invest in retention and expansion |
| Investigate | High | High | Test lower-cost acquisition tactics |
| Test candidates | Low | Low | Trial retention or upsell campaigns |
| Deprioritise | Low | High | Wind down or restructure targeting |
Segments where CLV is less than three times CAC are rarely defensible long-term. If a segment costs $50 to acquire and generates $100 lifetime value, that segment breaks even after two years with zero profit.
This step often surprises teams. A segment that feels important (large, vocal, prestigious) may be unprofitable. A segment that feels small may have exceptional margins. Let the mathematics, not intuition, guide prioritisation.
Step 5: Document Segment Personas with Decision-Level Detail
With segments validated, write them down. Not as abstract definitions, but as personas a marketer or salesperson could act on.

Weak persona: “Price-sensitive SMBs”
Strong persona: Mid-market SaaS founders, aged 28-42, bootstrapped or post-Series A, with revenue of $2m-$10m annually, deploying tools across sales and support. Have evaluated three competing products in the last six months. Prefer product-led growth onboarding. Willing to pay $200-$500 per month for a platform that consolidates two or more tools they currently use separately. Likely to trial for 14 days before committing. Most active on Product Hunt and Slack communities. Churn risk rises after month three if usage falls below five users. High likelihood to upgrade if onboarded to their second use case within 60 days of signup.
The second persona is actionable. A marketer can write campaigns knowing exactly what message resonates. A salesperson knows which discovery questions to ask. A product manager knows which features to highlight in onboarding.
For each segment, document:
- Who they are: Demographics, firmographics (company size, industry, and revenue for B2B segments), geography, and role
- What drives them: Primary pain points, success metrics, decision-making criteria
- How to reach them: Preferred channels, content types, and time of day most responsive
- How to convert them: Messaging angle, offer structure, proof points that matter
- How to retain them: Early warning signals of churn, expansion opportunities, loyalty levers
- Economics: CAC, CLV, average deal size or order value, payback period
This documentation becomes your segmentation playbook. Update it quarterly as customer behaviour and market conditions shift.
Frequently Asked Questions
What is the difference between segmentation and personalisation?
Segmentation divides your audience into groups. Personalisation tailors content or experiences to individuals or groups. Segmentation is the foundation; personalisation is the execution. You segment first (group similar customers), then personalise (craft messages for each group).
How many segments should we create?
Start with three to five core segments. Each segment should represent at least 5% of your customer base (or 100 customers, whichever is larger) and should justify dedicated marketing spend. Micro-segmentation (20+ segments) often fails because segments become too small to analyse meaningfully, and the overhead of managing many separate campaigns outweighs the revenue gain.
Can we change our segmentation model midway through a campaign?
You can, but you should not do so frequently. Segment membership often changes quarterly. However, segment definitions and criteria should be stable for at least one quarter (ideally two to three) so you can measure impact. If you change your segmentation model every month, you will never know what drove results.
What if we do not have much data on our customers?
Start with behavioural data. Even a single variable (purchase frequency, email engagement, or product category) is more predictive than demographics alone. Add demographic and firmographic data over time as you collect more information.
How do we avoid over-segmentation?
Enforce a minimum segment size rule and measure segment-level ROI. A segment is justified only if the cost of managing it separately is less than the revenue benefit. If a micro-segment has a lower CLV than the effort to reach it, consolidate it into a larger segment.
Is segmentation only for large enterprises?
No. Segmentation works at any scale. A small business with 500 customers can segment into repeat buyers and first-time buyers and see immediate ROI. Medium businesses can layer in geography or product category. Enterprise businesses can build complex multi-variable segments. The framework scales.
How often should we re-evaluate our segments?
Reassess segment membership quarterly. Annual strategy reviews should examine whether your segment definitions still predict behaviour and profitability. If not, rebuild it based on exploratory analysis.
What is the most common segmentation mistake?
Creating too many micro-segments based on convenience data (age, location) rather than behaviour or profit. This leads to low ROI, high operational complexity, and inability to measure results accurately.
How does PDPA affect our segmentation strategy in Singapore?
You must have explicit consent to use customer data for segmentation and marketing. Be transparent about how you use data, and give customers the right to see and correct it. Build segments on first-party data only. Please document your segmentation logic and maintain audit records.
Can we segment based on inferred data or assumptions about customer behaviour?
Be cautious. You can infer some behaviours from transaction history or engagement patterns. But do not assume psychographic traits (values, interests) without asking customers directly via a survey or preference centre. Assumptions lead to poor targeting and complaints.
What is zero-party data, and why is it important?
Zero-party data is information customers actively share: survey responses, preference centre selections, stated interests. It is high-confidence data because customers have volunteered it. It is also PDPA-compliant by design because consent is explicit. Prioritise zero-party data in your segmentation strategy.
How do we measure whether a segment is profitable?
Calculate customer lifetime value (total revenue minus service costs) and acquisition cost for each segment. Compare the two. If CLV is more than three times acquisition cost, the segment is generally profitable at scale. If CLV is equal to or less than acquisition cost, the segment is marginal and requires rethinking.