
Digital marketing KPIs should be few, and each should drive a budget, creative or channel decision. This guide applies the Decision-Link Test to every candidate metric: what goal it serves, what decision it triggers, and at what threshold.
Most digital marketing teams do not lack data. They lack a method for choosing which numbers matter. Dashboards show impressions, sessions and likes, yet budget decisions still lack a clear basis. This guide argues for fewer, better KPIs, each chosen because it changes what you do.
For every candidate metric, apply the Decision-Link Test: what goal does it serve, what decision would it trigger, and at what threshold? If it cannot answer all three, please move it to a secondary report. Start with the goals, then choose the metrics that show whether those goals are being met. This is also where a sound digital marketing plan begins.
Key Takeaways
- Track fewer KPIs, and make sure each one earns its place. A KPI that cannot change a budget, creative choice or channel mix is reporting, not management.
- Use the Decision-Link Test. For each KPI, record the goal, the decision it triggers and the threshold that prompts it.
- Match KPIs to the channel. Email campaign KPIs differ from social media KPIs.
- Read the click-through rate carefully. A higher CTR signals a stronger ad but does not prove conversions.
- Set targets based on your own data. Benchmarks vary by industry, so compare against your history first.
- Reconcile data first. Website, social and budget data rarely agree on attribution, so agree on one method.
Core Digital Marketing KPIs by Channel
- Website traffic: Sessions and traffic source, showing where visitors arrive.
- Engagement: Time on page and bounce rate, showing how visitors respond.
- SEO: Organic clicks and rankings, showing search visibility.
- Social media: Engagement rate and reach, showing how the audience responds.
- Paid advertising: Click-through rate and cost per click, showing ad efficiency.
- Lead generation: Leads and conversion rate, showing how many visits become enquiries.
- Overall marketing: Customer acquisition cost and customer lifetime value, showing whether growth is profitable.
Introduction to Digital Marketing KPIs
What a KPI Is and How It Differs From a Metric
A digital marketing KPI, or key performance indicator, is a small subset of the metrics you can measure, chosen because it shows progress against a goal that matters to the business. A metric is any number you can measure, such as website sessions, email opens or ad impressions.
The difference is intent. A metric describes activity; a KPI judges progress. Sessions from people who request a quote, measured against a target, become a KPI. A useful KPI has a goal attached and a threshold that shows whether you are on track, and it helps you decide whether a course of action is working. Important decisions about marketing campaigns depend on KPIs that reflect real outcomes rather than raw activity.
According to Teamwork’s guide to KPIs for digital marketing, a KPI pulls data from several sources at once and connects them to an outcome, rather than reporting one channel in isolation.
Why Most Teams Track Too Many Numbers
Analytics tools expose hundreds of figures by default, and most go unused. Keep the set small. An email campaign and a social media campaign play different roles in the funnel, so their KPIs differ. Testbook’s explainer on what a KPI is makes this point directly. Copying one team’s list into another’s dashboard usually produces the wrong numbers, so you need to optimize the set for your own goals.
Who This Guide Is For
This guide is for marketing managers, business owners and analysts who report on digital performance and need to decide what to track. It assumes you already run digital marketing campaigns and have access to at least one analytics platform such as Google Analytics, Google Ads, Meta or LinkedIn.
It is less useful if you are still setting up basic tracking. If conversions are not recorded yet, start there before choosing digital marketing KPIs, since a clean record of leads and conversion rates will help every later decision and make your reporting better.
Choosing KPIs That Actually Drive Decisions
Most digital marketing teams do not have a measurement problem. They have a selection problem: dashboards hold dozens of numbers, and few change what anyone does on Monday morning. The fix is a smaller set of digital marketing KPIs, each matched to a channel goal and tied to a decision the team will make. A number that cannot move a budget, a creative choice or a channel mix is reporting, not management. Better KPI selection helps teams improve their marketing strategy and focus their marketing efforts where the data can actually change the outcome.
The Characteristics of a Good KPI
Testbook’s guide to KPIs describes a good KPI as aligned with organizational goals, measurable, relevant to the thing being tracked, and able to provide actionable insights. A figure that fails any of these tests belongs in a supporting report.
“Actionable” does most of the work. It means the number has a direction you would act on. If traffic rises, do you spend more? If it falls, do you change the page? When the honest answer is “nothing,” the metric is informational at best.
Aligning KPIs With Business Goals
Start from the goal, then the channel, then the metric. A brand awareness campaign and a lead generation campaign need different measures, even on the same platform. Testbook notes that email and social media campaigns use different KPIs because each channel does a different job.
Each candidate KPI needs three answers, which we call the Decision-Link Test:
- Goal served: the business outcome, such as paying customers or repeat purchases.
- Decision triggered: what the team would change if the number moved.
- Threshold: the value that prompts that decision.
Any KPI with no decision attached moves to a secondary report. This is what separates a useful KPI from a busy number.
Setting Targets and Benchmarks
A KPI without a threshold is a number without a verdict. Set thresholds before the campaign runs:
- Pull at least three months of your own data for the KPI.
- Note the typical range, and the value you need to reach your goal.
- Set the threshold at the level that would change your decision.
- Label the figure’s basis, such as “our 90-day average” or “illustrative, not measured”.
- Review the threshold after each full review cycle.
These illustrative targets are examples only, not market averages or sourced benchmarks:
| KPI | Illustrative target | Decision if missed |
|---|---|---|
| Conversion rate | 5% | Review landing page and offer |
| Click-through rate | 2% | Rewrite ad copy or test new creative |
| Customer lifetime value | US$500 | Revisit retention spend and pricing |
A benchmark borrowed from another company shows what is normal there, not whether your campaign is working. Build the baseline from your own data first.
Leading Versus Lagging Indicators
Lagging indicators, such as revenue or customer lifetime value, confirm what already happened. Leading indicators, such as click-through rate or lead-form starts, move sooner and leave time to act.
Check leading indicators weekly to adjust creative and bids, and review lagging indicators monthly or quarterly to decide where the budget goes. Do not judge a campaign on a leading indicator alone. Media marketing and paid search campaigns, for example, can be optimized weekly on leading signals, while domain authority and other slower measures should inform quarterly planning.
Website Traffic KPIs
Traffic Source Metrics
Traffic source metrics show where visitors come from: organic search, paid ads, social media, email, referrals or direct visits. As the data-source point made in the introduction shows, tracking means pulling data from several places at once, including your website, social media profiles and budget records. Digital marketing teams use these figures to judge which channels deserve investment.
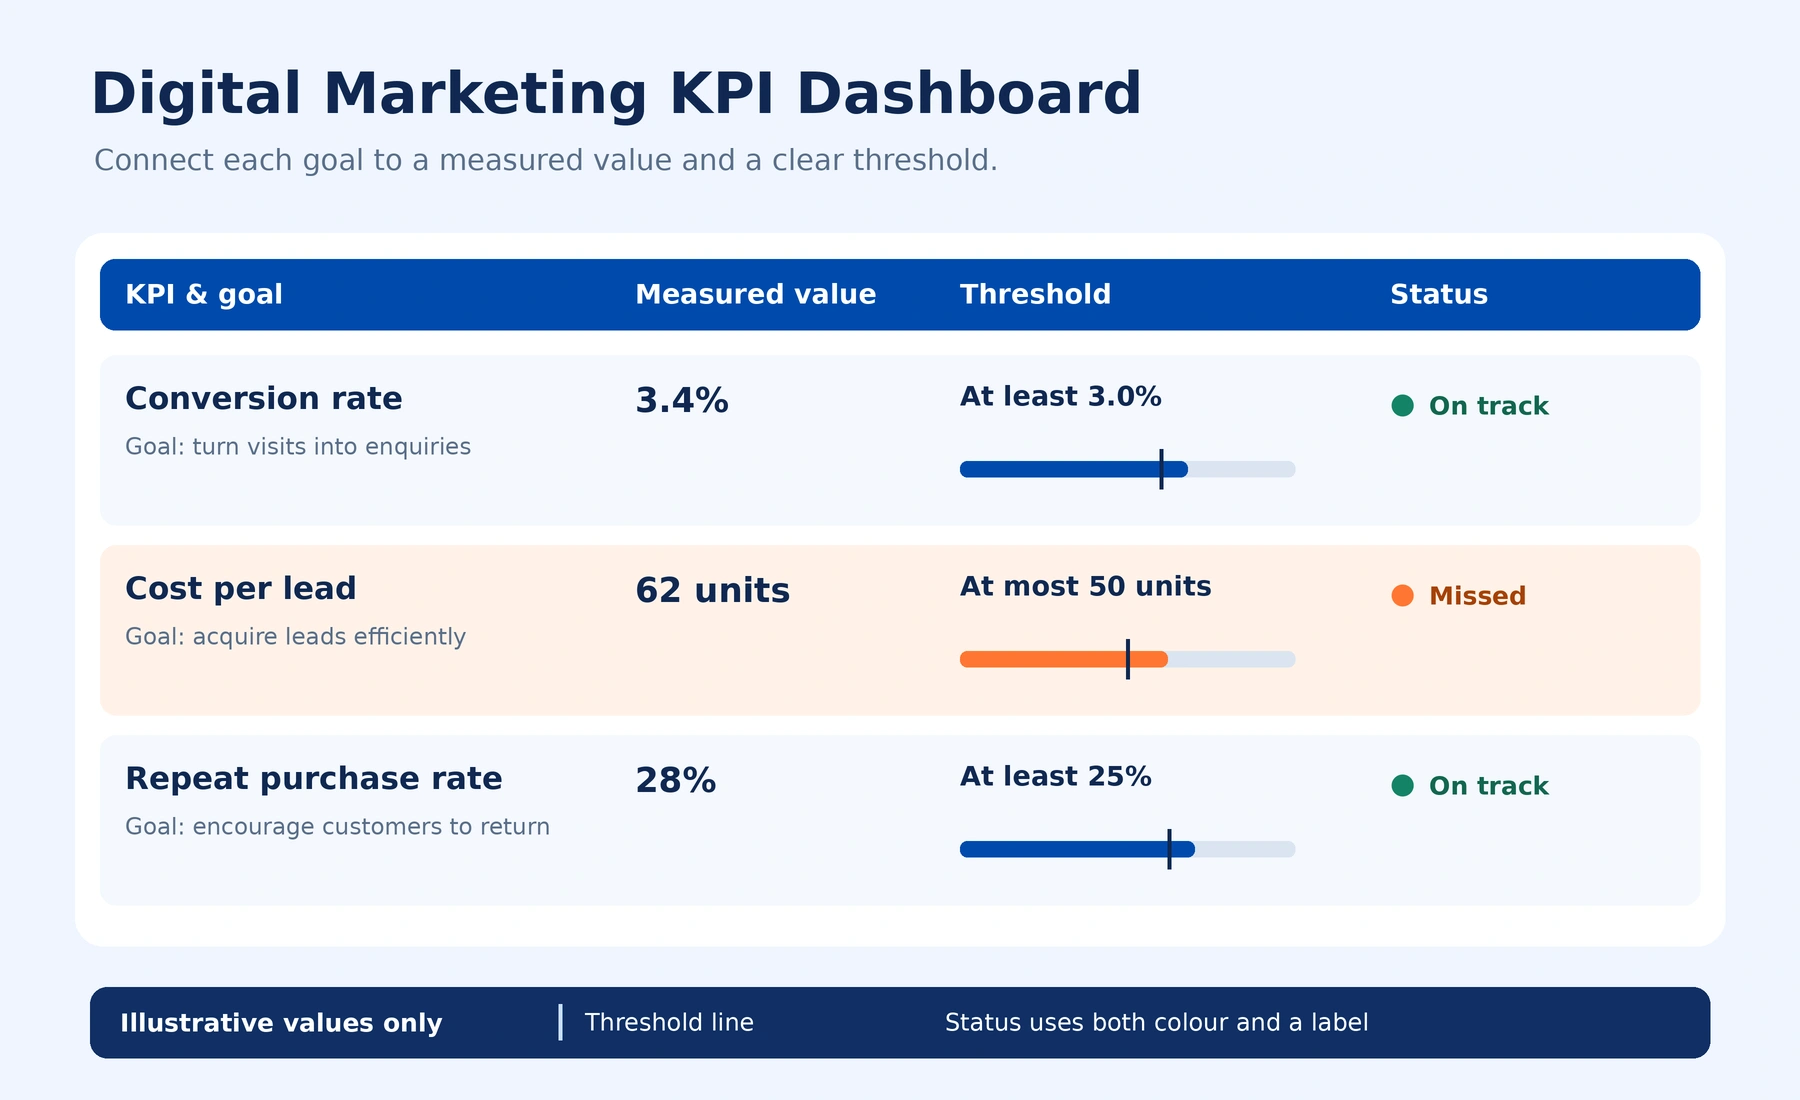
The useful question is not “How much traffic did we receive” but “Which source is worth more budget?” One source may send 40% of visits but no enquiries, while another sends 5% of visits and most of the revenue. Only the second deserves more budget. Read the source breakdown alongside conversion rates to optimize spend, and check whether a search engine referral converts better than paid traffic before shifting budget.
Watch these three figures for each source:
- Share of sessions: the percentage of total visits each source contributes.
- Conversions per source, the enquiries, sign-ups or sales each produces.
- Trend over 90 days: is the source growing, flat or falling?
If a source’s share rises but its conversions do not, the traffic is not the win it appears to be.
Engagement Signals That Matter
Engagement metrics show whether visitors found what they came for. Google Analytics 4 now uses engagement rate as the default instead of bounce rate, counting a session as engaged when it lasts 10 seconds or more, includes a conversion, or includes two or more page views. Google’s GA4 documentation defines the metric.
A low engagement rate on a blog post that answers a quick question may be a good result. The same rate on a service landing page usually signals a mismatch between the ad or search result and the page. Only track an engagement metric if you can name the change you would make when it moves. A short digital marketing course can help teams learn to read these signals, and a better grasp of engagement data often improves campaign decisions.
Setting Traffic Targets
A traffic target only means something when tied to a business outcome. Start from the number of customers you need, work back through your conversion rate to the visitors required, then set source-level targets against your key performance goals.
For example, if you need 50 enquiries a month and your landing page converts at an illustrative 5%, you need about 1,000 qualified visits. Replace the 5% with the page’s measured conversion rate before using the result.
Set targets as ranges with a review trigger, such as “organic sessions to the pricing page between 800 and 1,000 per month; review if below 800 for two consecutive months.”
Paid Advertising, Acquisition and Retention KPIs
Return on Investment, Acquisition Cost and Retention
- Return on investment (ROI): (revenue from a campaign minus its cost) divided by its cost, shown as a percentage. Teams track this number per campaign to see which spend delivers measurable results.
- Customer acquisition cost (CAC): total acquisition spend divided by new customers won in the same period.
- Retention and churn: the share of customers still buying after a set period, with churn as its opposite (customers lost divided by customers at the start of the period). Teamwork’s KPI guide notes churn is also called “customer attrition.”
Customer Lifetime Value and CAC Versus CLV
Compare CAC with customer lifetime value (CLV). Formulas vary, and a simple version ignores margin unless you adjust for it. Using an illustrative US$500 CLV and a CAC of US$180 gives a 2.8x ratio, but with a 40% gross margin, the margin-adjusted value is US$200, which leaves only a small return on each customer.
A CAC close to CLV leaves little margin, so a campaign can look busy and still lose money. Our digital marketing services team can help set up this comparison for your own campaigns so you can measure and optimize better and reach your goals.
Remaining ROI and conversion attribution models, such as first click or last click, also shape which channel looks effective, so state which model your reporting uses.
SEO and Social Media KPIs
Search and social are the two channels where teams most often drown in numbers. Rankings, impressions, and follower counts may seem like progress, but they rarely influence what a team does in the following week. Pick the handful of KPIs that map to a decision in your digital marketing efforts, and drop the rest. Choose KPIs that link directly to your marketing strategy and the conversion rates they influence.
Organic Search Performance Indicators
Organic search KPIs should answer three questions: are people finding the site, are they reaching the pages that earn money, and is that traffic doing its job? Track organic sessions, the pages receiving them, and the conversions organic visitors complete. Keyword rankings are only a leading signal for the first two, and they help you prioritize content for each search engine’s results.
Run each candidate through the Decision-Link Test. If organic sessions to a commercial page fall for two consecutive months, trigger a content or internal-linking review. If impressions rise while the click-through rate stays flat, adjust titles and meta descriptions first. If rankings move but sessions do not, demand is probably low, so drop the keyword.
Keep one organic conversion KPI per business goal. Rising sessions that fail to lift enquiries are a traffic result, not a revenue result. Track how domain authority shifts alongside website traffic to judge whether gains are lasting.
Social Media Engagement and Reach
Reach and impressions show how far content travels. Engagement rate (interactions divided by reach or follower count) shows whether people care. Social media KPIs earn their place when they link to a destination, such as link clicks to a landing page or referral sessions that convert.
Engagement rate needs context. A 2% rate can be strong for an awareness post and weak for a product post aimed at buyers. Compare each post type against its history. Review follower growth quarterly, since a giveaway spike tends to fade without commercial gain. Compare organic reach with paid reach before blaming the creative when reach drops.
Paid Advertising KPIs: CPC, CTR and Quality Score
Paid search and paid social spend are easy to measure and easy to waste. Three metrics explain most outcomes, and each one is relevant for every marketing campaign you run.
Click-through rate (CTR) is clicks divided by impressions. A higher CTR signals that the ad matches what the searcher wanted. Google Ads documentation defines CTR and its role in ad performance.
Cost per click (CPC) is ad spend divided by clicks. CPC rises when competition for a keyword is high and when ads perform poorly.
Quality Score is the platform’s estimate of ad and landing page relevance, on a 1 to 10 scale. Google Ads Help describes its three components: expected CTR, ad relevance and landing page experience. A low Quality Score raises CPC and lowers ad position, so landing page relevance is a cost issue, not only a design issue.
Worked example: an ad spends US$300 and earns 1,500 impressions and 30 clicks. CTR is 2% and CPC is US$10. If the landing page does not match the ad’s promise, Quality Score falls, CPC rises and conversions stay low. Rewrite the landing page to match the query, then assess whether CPC falls.
Diagnosing an Underperforming Campaign
Review the metrics in order. Low impressions point to budget or bid issues. Low CTR points to ad copy or targeting. Normal CTR with high CPC points to Quality Score or competition. Normal clicks with few conversions point to the landing page or offer. Fix one step at a time, and wait for enough data before concluding a change worked. Watch the bounce rate on the landing page as well, since a high figure with normal clicks usually means the page is not delivering what the ad promised.
Channel-Specific KPI Plans
A single KPI list for all channels is the main cause of over-reporting. The table below shows a starting set for each channel and the decision that each KPI should trigger.
| Channel | Primary KPI | Decision it triggers |
|---|---|---|
| Organic search | Organic conversions from non-brand pages | Reallocate effort between content and technical SEO |
| Organic social | Link clicks to a conversion page | Change post format or call to action |
| Paid social | Cost per qualified lead | Scale, pause or retarget the ad set |
| Paid search | CTR and Quality Score on core keywords | Rewrite ads, adjust bids or improve the landing page |
| Click-to-open rate and revenue per send | Revise segments or send frequency |
Lead Generation and Overall Marketing KPIs
Lead generation campaigns need two measures beyond traffic. Cost per lead is total campaign spend divided by leads generated. Lead-to-customer rate is the number of customers won divided by the number of leads received. A low cost per lead can hide a poor lead-to-customer rate, so read them together.
Limit each channel to three to five primary KPIs, and keep secondary metrics off the headline dashboard. Before adding any KPI, consider which budget or creative decision it might influence. If the answer is none, please consider moving it to a supporting report or removing it. Keep tracking focused on the goals that matter most to the business.
Paid Advertising KPIs: CPC, CTR and Quality Score
Paid advertising produces more numbers per day than most channels, which makes it easy to over-report. Three metrics do most of the diagnostic work: click-through rate (CTR), cost per click (CPC) and Quality Score. None of these metrics answers the most important question on their own: are these clicks turning into customers? Tie each figure to a business goal, or it will not help your digital marketing decisions.
Click-Through Rate as an Ad Effectiveness Signal
Click-through rate is the share of people who saw an ad and clicked it. According to Teamwork, a higher click-through rate means the ad is more effective, and higher click-throughs can also lower CPC.
A strong CTR shows people are interested enough to click, not that they are ready to buy. An ad offering a free guide can beat a precise offer on CTR while sending clicks that never convert. Judge campaigns on conversion rates too, since a click only matters if it improves your marketing campaigns’ results within your overall marketing strategy.
Use CTR as a first filter. Set a 2% starting point, as in the worked example above, and investigate campaigns that fall well below it. Label that figure as your starting point, not an industry standard, and adjust it using your own history to measure real progress.
Cost Per Click and How Efficiency Affects It
Cost per click is what you pay each time someone clicks. Competition, your bid, and the quality of your ads and pages all shape it. CTR and CPC are linked but not fixed to each other: higher click-throughs can lower CPC on some platforms, while a competitive auction can push CPC up even when CTR is healthy.
A falling CPC looks like efficiency, but a cheap click is only valuable if it leads somewhere. Track CPC alongside cost per lead or cost per acquisition. If CPC drops while cost per customer rises, you have bought cheaper, less qualified traffic, so optimize for customers rather than clicks.
Quality Score and Landing Page Relevance
Quality Score is Google Ads’ diagnostic rating of how relevant your keywords, ads and landing page are to a search engine query. Use it as a symptom check rather than a number to chase. A low score usually points to a mismatch between the keyword and ad copy, the ad and query, or the ad and landing page.
The landing page is the most common culprit and the easiest to fix. Matching the headline, offer and language between ad and page tends to improve relevance and conversion together, and it supports your marketing efforts across every digital channel.
Diagnosing an Underperforming Campaign
When a paid campaign disappoints, work through the metrics in order rather than changing everything at once. Tracking each step in sequence shows which lever to adjust, and a better campaign strategy starts with that discipline:
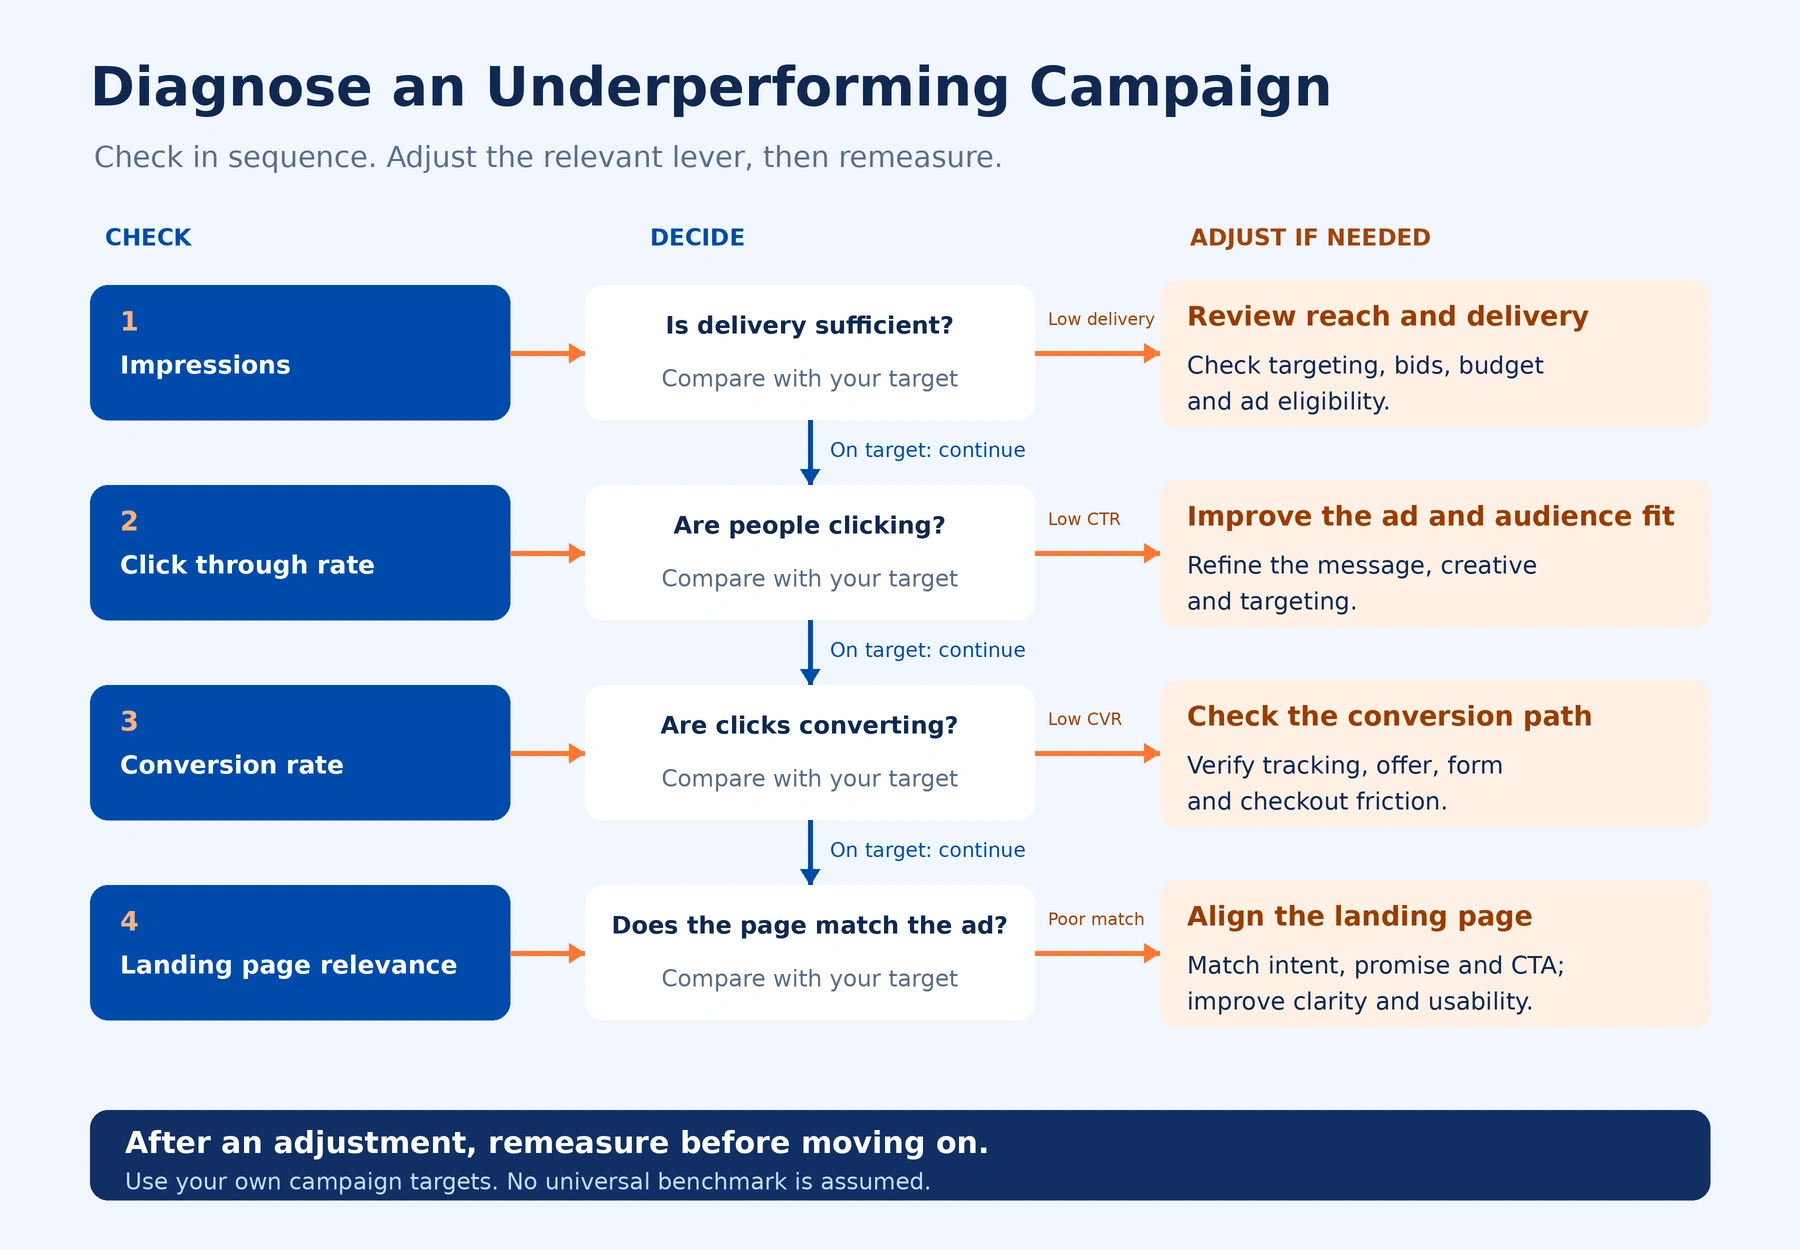
- Check impressions and CTR. Low impressions may indicate reach or bidding issues. Low CTR points to the ad message.
- Check CPC against your target. If CPC is high, review competition, bids and Quality Score.
- Check Quality Score components. Look at keyword match, ad relevance and landing page experience.
- Check landing page conversion rate. A strong CTR with a weak conversion rate is a page problem, not an ad problem.
- Check cost per customer. This number shows whether the campaign pays, and it is one of the most important KPIs for judging results against your goals.
Working the chain this way stops you from blaming the ad for a page problem or the page for a targeting problem, and it shows where you’re actually losing return on investment.
Conclusion and Next Steps
Most teams have a selection problem, not a measurement problem. Keep a smaller set of digital marketing KPIs, each tied to a goal and a decision, and move the rest to a secondary report. Tracking fewer, better-chosen metrics is important because it helps you optimize your marketing course and the results your social media efforts produce.
Start this week:
- List every metric in your current dashboard.
- Record the goal, decision and threshold for each.
- Cut anything with no decision attached.
- Set one review date per channel and a named owner for each of your important KPIs.
Expect the first pass to remove a large number of metrics, more than half the dashboard in many cases. That is the point.
Frequently Asked Questions
What is the difference between a KPI and a metric?
A metric is any number you can measure, such as sessions, impressions or email opens. A KPI is a metric tied to a specific business goal, one whose movement would change what you do. Every KPI is a metric, but most metrics are not KPIs.
How many digital marketing KPIs should a team track?
Most teams track far fewer KPIs than they measure. A practical starting point is three to six KPIs per channel, with one or two marked as primary. Any KPI with no decision attached moves to a secondary report.
Which KPI matters most for paid advertising?
No single figure settles it, but a useful starting point is the link from clicks to paying customers. Track the leads generated from paid clicks and how many become customers, then compare cost per acquisition against the value each customer brings in.
How is customer lifetime value calculated?
One common formula is CLV = (average basket) x (purchase frequency in months) x (customer lifetime). Formulas vary between businesses, and this one ignores margin unless you adjust for it. Match the timeframe to the decision: a 90-day value suits a short-term budget call, while a multi-year value suits long-term acquisition spending. A target customer lifetime value of $500, for example, sets a ceiling on what you can afford to pay for each new customer.
How often should digital marketing KPIs be reviewed?
Review frequency should follow how quickly a decision can be made and acted on. Paid search and paid social budgets often warrant weekly checks, while conversion rate, retention and customer lifetime value usually need monthly or quarterly reviews. Avoid reacting to daily fluctuations in small campaigns, since normal variation can look like a trend.