
Digital marketing budgeting is the process of planning, allocating and controlling financial resources across channels and activities to achieve measurable business outcomes within a defined period. It connects business ambition to monthly spend and requires ongoing optimisation to remain effective.

Most guidance stops at “spending 5-10% of revenue” without explaining the mechanics that follow. This framework addresses what that advice omits: how to calculate a total that matches your capacity, how to split it across channels without guessing, the infrastructure costs that typically add to media spend, and how to reallocate when performance shifts mid-quarter. Whether you are allocating your first $500 per month or restructuring a $500,000 annual budget, the same principles apply.
A poorly built budget wastes capital and hides it in channels that look optimised in reports. A well-built one concentrates spending on revenue-driving activity and preserves margin to test emerging opportunities.
Key Takeaways
- Digital marketing budgets originate from three methods: percentage-of-revenue (typical ranges reported include 6-12%), competitive benchmarking, or objective-and-task allocation tied directly to business goals. Mature teams use all three as cross-checks.
- Most organisations underfund tools, personnel and testing. Channel spend that appears optimised in reports often faces constraints in execution. Research suggests infrastructure costs can represent a meaningful portion of the stated media budget.
- Allocation varies sharply by channel maturity, industry and geography. Search advertising typically accounts for a significant share of digital budgets in established markets; earlier-stage brands should reserve capacity for experimentation.
- The ROI threshold that matters is cost-per-acquisition relative to customer lifetime value and your cash-conversion cycle, not ROAS alone.
- Monthly reviews and pre-agreed reallocation rules prevent performance decline. A channel that performs well one quarter often requires adjustment when competitor behaviour or platform algorithms shift.
What Digital Marketing Budgeting Actually Is
Digital marketing budgeting is not simply deciding how much to spend on advertising. It answers three connected questions: How much total investment can the business afford? Where should that money go? Which metrics prove the allocation worked?
Most companies treat budgeting and spending as one decision. They select a figure based on intuition or competitor behaviour, then divide it evenly across channels. This approach rarely delivers results. Real budgeting works backwards from business goals, channel performance and competitive efficiency, not forwards from an arbitrary number.
The distinction matters because a structured budget becomes a control mechanism. It forces trade-off decisions upfront rather than during crises, and it creates accountability. If email generates a 5:1 return but receives 8% of spend, the budget exposes the gap between where money flows and where it should.
Budget Allocation Is Not the Same as Total Spend
Conflating these two creates planning chaos because they operate on different cycles.
Total marketing spend is the combined investment across all digital activity: paid search, social advertising, content creation, email platforms, analytics tools, team salaries and agency fees. A company might spend $100,000 a year.
Budget allocation is how the $100,000 is split across the various activities. The same figure might flow as $40,000 to search engine marketing (SEM), $25,000 to social advertising, $15,000 to content and email, and $20,000 to tools and team.
Two competitors with identical totals can achieve radically different outcomes purely from the split. One directs funds to paid performance and limits organic investment. The other invests heavily in content to build long-term search engine optimisation (SEO) equity. The total budget is usually set annually and rarely moves. Allocation should shift monthly, or weekly, as performance data arrives. You might start a quarter with 30% in paid search, then move part of that to social media marketing in month two when search conversion rates decline.
Separating the two concepts prevents you from becoming locked into a broken allocation because “that is what we budgeted.” You can change channel weights while holding total spend flat.
The Three Budget-Setting Approaches
Every budget starts from one of three frameworks. Mature teams combine them as sanity checks.
Top-down budgeting starts with a fixed total, often set by finance or leadership, and distributes it downward. Leadership decides on 5% of revenue; if revenue is $2 million, the digital budget is $100,000, allocated across channels based on historical patterns. It is fast, simple, and ties investment to revenue capacity, which suits stable companies with predictable margins. Its weakness is that it ignores channel efficiency. A dollar spent on search might return $6, while a pound spent on display returns only $1.50; yet equal distribution funds both channels the same way.
Bottom-up budgeting reverses the logic. Each team or channel submits what it needs to execute its plan and requests aggregate upward. SEM requests $40,000 to hold bid levels and grow volume by 20%. Social media marketing requests $25,000 for platform tests. Content requests $18,000 for weekly assets. The total is $83,000, approved against a $100,000 ceiling with headroom for testing. This approach grounds budgets in real work and surfaces constraints early. Its drawback is that it is slow and reinforces historical dominance. If paid search has dominated for years, the SEM team requests the most funding, while smaller high-potential channels like email receive less attention because no single team owns them.
Objective-and-task budgeting is the most strategically sound and most demanding. Define the goal, identify required activities, cost each one, and sum the total. To generate 500 qualified leads monthly with a 3% conversion rate for search engine marketing, you need 16,667 clicks. At an average cost per click of $1.50, that is $25,000 monthly. Social media marketing at a 1.5% conversion rate needs 33,333 clicks at $2, totalling $66,600. Email nurture to existing subscribers costs $500. Total: $92,100 monthly. Investment scales directly with ambition, and unnecessary spending disappears. It depends on reliable historical data for conversion rates and costs per action. Brand-building goals are harder to express this way.
How to combine them: Start with objective-and-task to build the budget that hits your goals. Check it against top-down constraints, such as a 10% revenue ceiling or finance’s available capacity. If it exceeds limits, either shrink the goals or improve efficiency. Then validate against bottom-up reality: can your teams execute at those spend levels, or do you need to hire, outsource or scale back? Together, the three frameworks catch blind spots that any one alone would miss.
Calculating Your Total Digital Marketing Budget
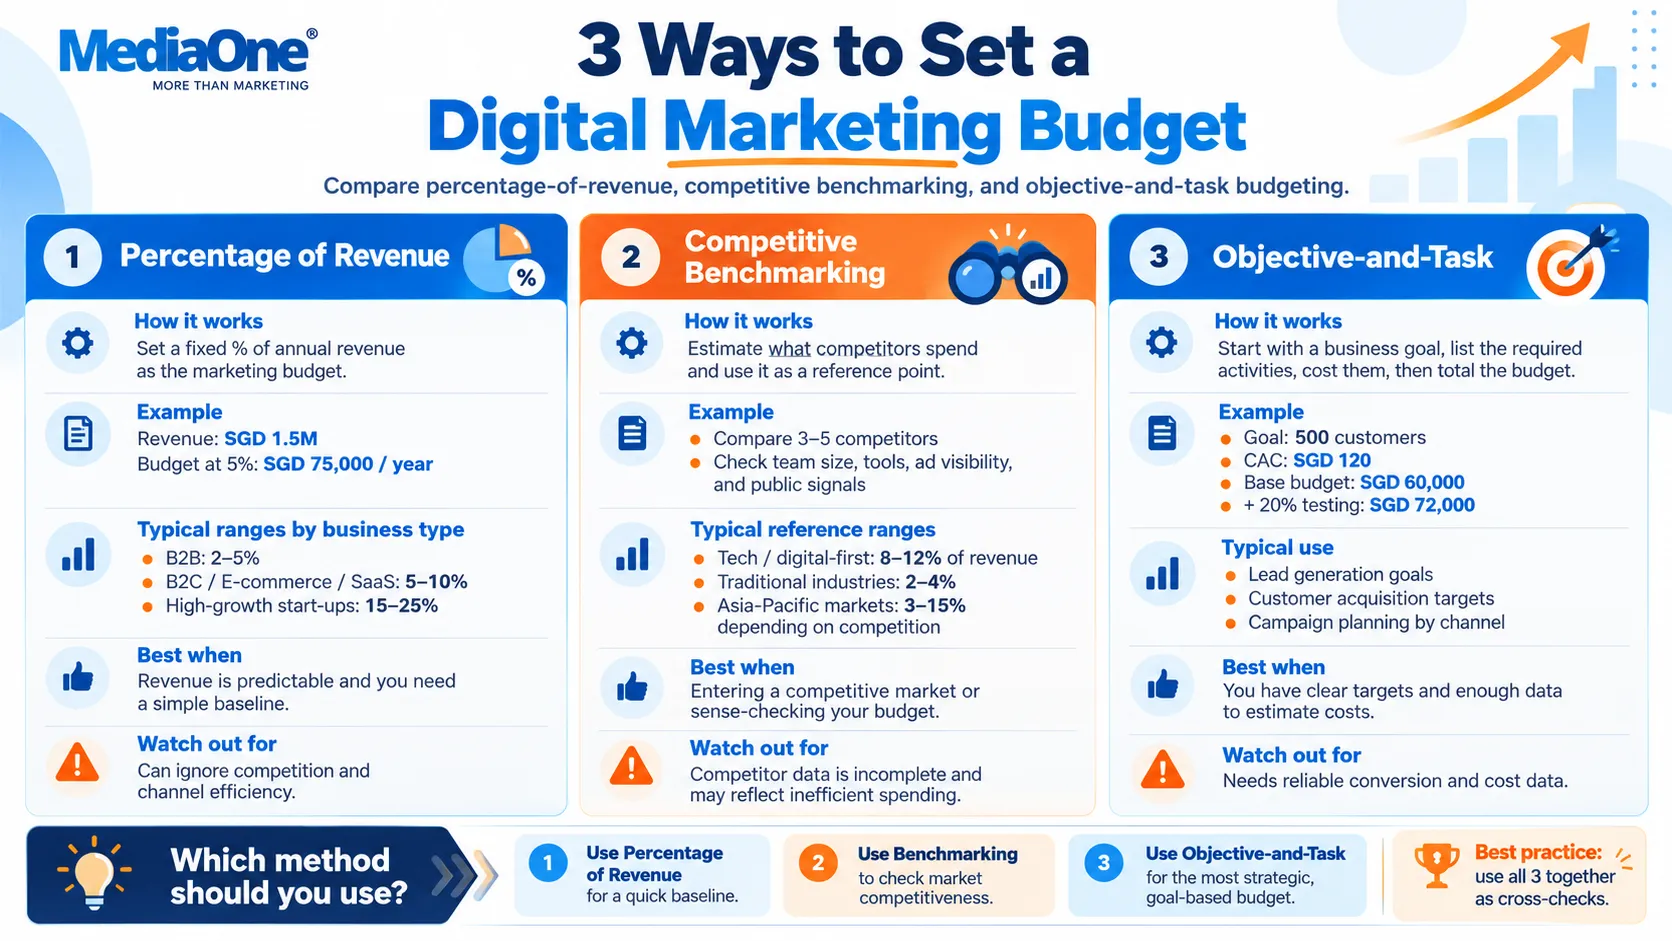
Before you allocate across channels, you need a total budget envelope. Three methods produce that number, each valid at a different stage of business.
The Percentage-of-Revenue Method
Divide annual revenue by a fixed percentage. Most B2B companies allocate 2-5% of their revenue to marketing. B2C e-commerce and SaaS businesses often spend 5-10%, while high-growth startups may run 15-25% to capture market share quickly. A company with $1.5 million in revenue at 5% allocates $75,000 annually.
The advantage is simplicity and automatic scaling as revenue grows. The weakness is that it ignores market competition, growth goals and channel profitability. A company in a crowded market may need to spend a higher percentage than average to compete. A business with a strong niche position can achieve results below the average.
Use this method when you are established, have predictable revenue, and want a baseline. To apply it, take annual revenue, multiply by your target percentage (5% is a reasonable midpoint), and divide by 12 for a monthly figure. Document the percentage you chose and review it quarterly against actual performance.
Competitive Benchmarking
Benchmarking means researching what direct competitors spend and using that as a reference point. Typical ranges reported across markets show UK technology firms spending roughly 8-12% of revenue on digital marketing, while traditional manufacturing spends 2-4%. European patterns vary; Northern European markets show higher adoption of digital channels. Asia-Pacific budgets range from 3% to 15% depending on market saturation and competitive intensity.
To benchmark accurately, identify three to five public competitors and look for signals of their marketing team size in their careers pages, investor reports, and case studies. Larger teams correlate with larger budgets. Tools like SimilarWeb and analyst reports from Forrester or Gartner can help estimate paid search and social spend.
Use this method when you operate in a transparent, competitive market and need to check that you are not dramatically outspent, especially when entering a new market or launching a competing product. The limitation is that public information is incomplete: competitors hide true spend, and a large budget may reflect inefficient allocation rather than effectiveness.
The Objective-and-Task Method
Define the objective first, then calculate what it costs to achieve it. If you need 500 new customers at an average acquisition cost of $120, your floor is $60,000. Add overhead for testing, tools and team to reach a realistic total. For 2,000 qualified leads at $22 each, the budget is $44,000 for paid acquisition, $7,500 for content and organic development, plus 20% contingency for underperformance.
This method forces precision: you are buying results rather than matching industry norms. The constraint is that cost-per-acquisition and cost-per-lead estimates must rest on real data. If a channel is new to you, research published benchmarks or run a small pilot before committing the full amount.
Use this method when you have clear, measurable targets such as revenue, customers, leads or subscriptions. It is the most common method for growth-stage companies and enterprises. To apply this method, list your top three objectives, estimate the volume needed for each, research or pilot the cost per unit, multiply the volume by the cost, add 15-20% for testing and optimisation, and sum the results. That total is your minimum budget.
Regional Spending Norms: Singapore, UK, EU and Asia-Pacific
Budgets vary by region because of market maturity, competition, platform costs and labour rates. The figures below represent indicative 2026 ranges based on typical patterns observed across markets; actual costs vary significantly by industry, account maturity and competitive dynamics.
| Region | Typical spend (% revenue) | Indicative platform CPC | Notes |
|---|---|---|---|
| United Kingdom | 5-8% | $1.50-3.50 | London and technology firms tend toward higher spending; paid social typically costs $0.80-2.00 per click |
| Northern Europe | 6-10% | $1.20-2.80 | High digital maturity and competitive intensity |
| Southern Europe | 3-5% | $1.20-2.80 | Lower immediate competition in some verticals |
| Singapore and Australia | 7-12% | Up to $2.50 | High competitive intensity; elevated platform costs |
| India and Southeast Asia | 3-6% | From $0.40 | Rapidly rising platform costs as markets mature |
For multi-region campaigns, anchor on your home market first. If you are Singapore-based, a 5-8% range is a safe starting point. When you expand, weight the budget toward high-cost markets and test lean in lower-cost markets before scaling. Digital agency rates in the Singapore market typically range from $50-150 per hour for strategy and execution; rates vary significantly by location, agency size and specialisation.

Allocating Budget Across Digital Channels
Where you invest matters more than how much you spend. Two companies with identical $15,000 monthly budgets can see wildly different returns based purely on how they allocate. Most businesses allocate inefficiently because they fund channels out of habit, not evidence.
Search Advertising (SEM)
Search advertising typically accounts for 20-40% of digital budgets for e-commerce and services, depending on the industry and customer intent. It works when you capture high-intent customers already searching for a solution. A plumber bidding on “emergency plumber near me” can achieve a conversion rate of 5-15%, while a B2B software company bidding on pricing keywords reaches buyers actively in the decision stage.

E-commerce businesses allocate 25-35% of their budget here. B2B services allocate 30-45%. Startups with unproven products allocate 10-15% initially, then scale if their acquisition cost remains profitable.
| Metric | Minimum Acceptable | Strong Performance |
|---|---|---|
| Return on Ad Spend (ROAS) | 2:1 | 4:1 or higher |
| Cost Per Acquisition | Industry benchmark | Below 20% of customer lifetime value |
| Click-Through Rate (CTR) | 2% | 4%+ |
| Quality Score | 7/10 | 9-10/10 |
Stop scaling a campaign when ROAS falls below 2:1. Scale aggressively when you consistently hit 4:1 or better. One often-missed cost is bid management: leaving Google Ads on full automation without refining conversion tracking can waste 10-20% of your spend. Budget two to four hours weekly for account reviews, or $600-1,200 monthly for a specialist if your spend exceeds $4,500.
Social Media Marketing
Social budgets should be split between organic content (labour and tools) and paid promotion. Most businesses under-invest in organic content and overpay for reach, then wonder why their campaigns feel so costly. Allocate 15-25% of total digital budget here, splitting roughly 40% organic and tools and 60% paid.
| Platform | Cost per click | Share of social spend | Best for |
|---|---|---|---|
| Facebook and Instagram | $1.20-4.50 | 30-50% | Broad reach, visual products, warming cold audiences |
| $3-9 | 20-40% B2B, under 10% B2C | Recruiting, thought leadership, high-value services | |
| TikTok and YouTube Shorts | Lower, weaker conversion | 5-15% | Awareness and viral reach, audiences under 35 |
| YouTube (long-form) | Varies | 10-20% | Compounding ROI from consistent video |
Note: Indicative ranges based on published market reports; actual costs vary by industry and account maturity.
Organic content carries a real cost that is often overlooked. Someone must create posts, manage community engagement and respond to messages. Budget $1,200-3,000 monthly for a dedicated social media manager, or $20-35 per hour for a freelancer working 10-15 hours a week. A $3,000 monthly investment in two to three long-form videos can generate hundreds of qualified views and subscribers within six months.
Email and Content Marketing

Email and content generate revenue at the lowest cost per customer acquired, yet they receive only 5-12% of budgets industry-wide. The reason is timing: results compound over 6-12 weeks. A new blog post ranks slowly. An email nurture sequence typically requires 5-8 touchpoints before conversion. Leadership sees no immediate return and cuts funding.
The math that changes minds is straightforward. An email subscriber costs $0.75-3.00 to acquire. Sending two emails monthly to a 10,000-person list costs roughly $75 in platform fees using services like Mailchimp, ConvertKit or HubSpot, while driving 5-12 sales for high-value products. Cost per sale lands under $15, which paid ads rarely match.
Aim for 10-15% of the budget here, split 50-60% between content creation and 40-50% between the email platform and list growth.
| Monthly content budget of $3,000 | Monthly email budget of $1,500 |
|---|---|
| $1,200-1,500 freelance writer (4-8 posts at $225-375) | $150-300 platform subscription (Klaviyo, ActiveCampaign) |
| $600-750 design and multimedia | $450-600 list building (lead magnets, signup ads) |
| $300-450 platform tools | $300-450 copywriting and template design |
| $450-600 paid promotion of posts | $300-450 segmentation testing |
Write internally if you have domain expertise and four to six hours weekly. Hire if your time is worth more than $75 per hour. A freelance writer at $225-375 per post producing two to four posts monthly justifies the spend if even one post drives a $750 sale within six months, which is conservative for search engine optimised content.
Affiliate and Influencer Marketing
These channels work alongside owned channels rather than replacing them. They are cheaper than paid ads but less predictable.
Affiliate marketing pays commission only on sales, typically 5-20% of the sale value. Allocate 3-8% of the budget if you sell physical products with at least a 10-15% margin, have 50+ potential affiliates in your niche, and can automate tracking and payouts. Start with 5-10 partners, not 100. A partner driving 10 sales weekly at 15% commission on $2,250 revenue costs you $338, whereas the paid-ad equivalent would run $600-900.
Influencer marketing pays a flat fee or commission:
| Tier | Followers | Cost per post | Typical engagement |
|---|---|---|---|
| Micro | 10,000-100,000 | $750-3,000 | 1-3% |
| Mid-tier | 100,000-1M | $3,000-15,000 | 0.5-2% |
| Macro | 1M+ | $15,000-75,000+ | 0.1-1% |
Allocate 2-5% only if your product is visually shareable, you can track unique codes or links per influencer, and you expect 2-5% of engaged viewers to convert. Pay for conversions or trackable engagement, never for “reach”, and negotiate outcome-based fees where possible.
Paid Display and Retargeting
Retargeting and brand awareness display serve different purposes and should be evaluated separately.
Retargeting shows ads to past site visitors across the web at $0.45-2.25 per click, with conversion rates of 2-5%, which are far above those for cold audiences. Allocate 8-15% of the budget here, and $750-1,500 monthly if your average customer value exceeds $750. It is essential when the sales cycle spans more than one visit, as in SaaS, insurance and education.
Brand awareness display reaches cold audiences at $0.75-7.50 per thousand impressions, converting at 0.1-0.5%. Allocate 5-10% to build awareness, launch a product, or enter a new market segment.
| Reduce display spend when | Increase display spend when |
|---|---|
| Retargeting ROAS falls below 2:1 | Retargeting hits 4:1 ROAS |
| Cold audience CTR is under 0.5% | The budget remains after maxing search and email |
| No clear brand message or differentiator | Launching into a new market or demographic |
Display works best as a supporting channel, reinforcing messaging after high-intent channels have completed their work. A visitor who sees your search ad, clicks through, then sees a display ad three days later remembers you. That reinforcement is worth 5-10% of the budget, not your primary investment.
The Hidden Costs Nobody Budgets For
Most teams underestimate digital marketing costs because they count only media spend. Research suggests typical ranges of 30-40% additional costs are overlooked. Allocate $15,000 to search ads while ignoring subscriptions, analytics setup and the person-hours to run them, and you are spending less than $15,000. You are spending closer to $21,000 or $24,000.
Tools, Software and Platform Subscriptions
The SaaS stack compounds rapidly. A typical mid-market team runs 8-15 subscriptions: email marketing ($150-750 monthly), social scheduling ($75-450), analytics ($300-1,500), SEO tools ($150-600), CRM ($75-750), webinar or video hosting ($75-300) and testing tools ($150-750). That is $1,500-5,250 monthly before a single campaign runs.
The cost spreads across invoices arriving throughout the month. Budget for SaaS separately, review it annually, and ask every tool owner to justify their subscription. Consolidation tools like Zapier or Make can reduce the number of active subscriptions. Running ads on Meta, Google, or LinkedIn may also require account managers, creative reviewers or compliance checks that the platform never bills you for directly.
Personnel and Agency Fees
A salaried digital marketer costs $45,000-90,000 annually in base pay, plus roughly 30% more in benefits, taxes and overhead. A freelance specialist costs $60-225 per hour. An agency costs 15-50% of annual ad spend, or a retainer of $3,000-15,000 per month.

| Model | Cost | Best fit |
|---|---|---|
| In-house team | $45,000-90,000 salary plus approximately 30% on costs | Five or more campaigns running at once |
| Freelancer | $60-225 per hour | One or two channels |
| Agency | 15-50% of ad spend, or $3,000-15,000 monthly retainer | Scale execution alongside in-house strategy |
Factor in salaries and on-costs (employer contributions, pension, equipment, training, workspace), agency fees, and the hidden freelancer multiplier. A $120 hourly rate for 20 hours a month is $2,400, plus your time recruiting, onboarding and managing them. A common mistake is hiring a junior in-house marketer to save money, then hiring a senior to teach them or outsourcing the complex work anyway. Budget for the skill level you need, not the salary level you can afford.
Reporting, Analytics and Attribution Infrastructure
Proper tracking is essential for meaningful budget decisions. A robust setup includes Google Analytics 4, conversion tagging across channels, UTM discipline, CRM integration and ideally multi-touch attribution. Infrastructure costs $750-3,000 monthly depending on data volume, plus a specialist to maintain it.
Without it, you run campaigns for months without knowing true ROI. A lead clicks a Google ad, abandons the form, returns via email and converts three weeks later. Which channel gets credit? Platforms like Mixpanel ($3,000+ monthly for mid-market), Segment ($750-2,250 monthly), or a custom data warehouse ($1,500-7,500+ monthly) solve this, but teams often treat them as optional. Budget them as essential. If an agency manages your paid ads, expect an additional $750-3,000 monthly to build and maintain data pipelines into your analytics tool.
Testing and Learning Overhead
Continuous testing consumes both media spend and analyst time. A/B tests on ads, landing page variants, send-time experiments and audience trials all require the variant to run and someone to interpret the result.
At scale, testing consumes 10-20% of the media budget. A $75,000 monthly paid ads budget should ring-fence $7,500-15,000 for experiments that may not convert. Some tests fail, and that is the cost of learning what works. Testing platforms like Optimizely, VWO or Unbounce charge by traffic or variant, so budget $300-1,500 monthly for tooling. Analyst time is easy to miss: 20 hours a month at a $60 fully loaded hourly cost is $1,200.
Ring-fence experimentation. Do not treat it as what you spend when a budget is left over.
Budget Planning by Business Size and Stage
Budget structure changes as a business matures. The percentages below are starting points, not targets.
| Stage | Total budget basis | Priority allocation | Watch out for |
|---|---|---|---|
| Pre-revenue startup | 15-25% of revenue when funded; minimal otherwise | Low-cost organic and email discipline | Spreading thin across every channel |
| Early growth (under $1.5M revenue) | 10-15% of revenue | 10-15% reserved for experimentation | Underfunding email and content |
| Scaling ($1.5M-15M revenue) | 8-12% of revenue | Search and social performance, plus content equity | Concentrating budget in a single channel past the point of efficiency |
| Enterprise ($15M+ revenue) | 5-10% of revenue, or 40-50% to search in mature markets | Hybrid in-house and agency execution | Hidden SaaS and attribution costs |
| Bootstrapped SMB | Percentage-of-revenue, anchor at 5% | One proven channel, plus email | Hiring junior in-house staff to reduce costs |
The consistent pattern across stages is that the testing reserve shrinks when budgets tighten, yet this is precisely when experimentation becomes most valuable. Reserve 10-15% for testing at each stage. This mechanism shows where next quarter’s budget should go based on performance data.
How to Build a Digital Marketing Budget: Step-by-Step Framework

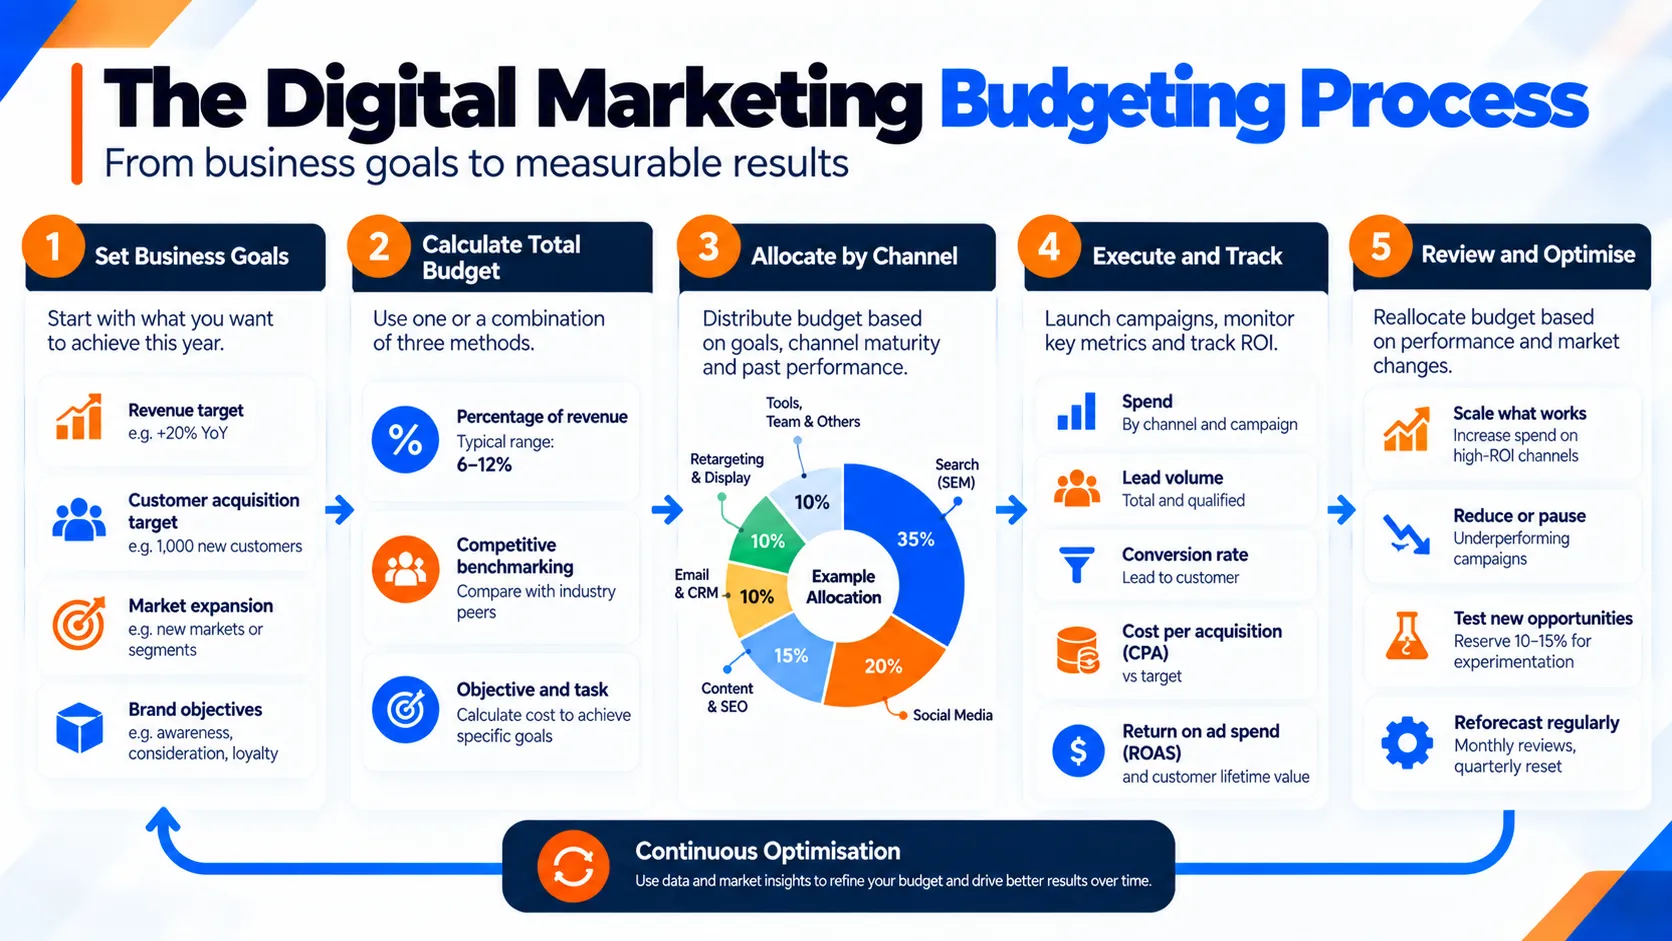
- Set the objective. Write down your revenue, customer, or lead target for the year. If you can’t measure it, you can’t budget it.
- Estimate unit costs. Use historical data, published benchmarks or a small pilot to establish cost per acquisition, cost per lead and conversion rates per channel.
- Build the objective-and-task total. Multiply volume by unit cost for each objective. Add 15-20% for testing and optimisation. This is your minimum viable budget.
- Cross-check against revenue. Compare the total to your percentage-of-revenue range for your sector and stage. If it exceeds 10-12% of revenue, either reduce the goal or improve efficiency.
- Validate operational capacity. Confirm your team, freelancers, or agency can execute at those spend levels. If not, budget for hiring or adjust the plan accordingly.
- Add the hidden-cost layer. Sum software subscriptions, personnel and on-costs, analytics and attribution infrastructure, and the testing reserve. Research suggests these costs typically add 20-40% to direct media spend, though this varies by business maturity and tooling complexity.
- Finalise the total and the allocation. Set the annual budget envelope. Divide it across channels using the ranges in this guide as a starting point.
- Set reallocation rules before you spend. Decide in advance what performance triggers a shift between channels, such as a return on ad spend below 2:1 or a click-through rate under 0.5%. This approach ensures decisions are based on data rather than reactive crisis management.
- Review monthly, reforecast quarterly. Monthly reviews identify underperforming channels early. Quarterly reforecasts let you adjust annual totals based on market conditions, seasonal demand, or internal capacity changes.
FAQs
How much should a business spend on digital marketing in 2026?
There is no single correct percentage. Many businesses use a percentage of revenue as a starting point, then adjust based on growth targets, margins, competition and customer acquisition costs. The budget should ultimately support measurable business objectives rather than follow an industry average blindly.
What is the best way to set a digital marketing budget?
Use three methods together: percentage of revenue, competitive benchmarking and objective-and-task budgeting. Start with the amount required to achieve your targets, then check whether it is affordable and realistic for your team to execute.
How should I divide my digital marketing budget across channels?
Allocate more to channels that already generate profitable customers, while keeping part of the budget for testing. Search, social media, content, email, and retargeting should not automatically receive equal funding. Their share should reflect customer intent, channel maturity and measured returns.
How often should a digital marketing budget be reviewed?
Review channel performance monthly and reforecast the overall budget quarterly. High-spend paid campaigns may require weekly monitoring. Pre-agreed reallocation rules help teams move money quickly when performance changes.
What costs should be included beyond advertising spend?
Include software subscriptions, agency fees, salaries, freelancers, content production, analytics infrastructure, tracking, creative development and testing. Ignoring these costs can significantly understate the true cost of your marketing programme.
How much budget should be reserved for testing?
A practical starting point is around 10–15% of the marketing budget. Use this allocation for new audiences, channels, creative concepts, landing pages and campaign experiments without disrupting proven campaigns.
Which metrics should determine whether marketing spend is working?
Focus on commercial metrics such as customer acquisition cost, customer lifetime value, cost per qualified lead, conversion rate, payback period and return on ad spend. Avoid making budget decisions based primarily on impressions, clicks or follower growth.
When should you move budget away from an underperforming channel?
Reallocate when performance remains below your agreed profitability threshold after sufficient testing and optimisation. Do not react to a few poor days. Look for sustained deterioration in acquisition cost, conversion rate or return on investment before shifting budget.