
For a Singapore advertiser, Facebook advertising typically costs around 87 cents per click, $16.06 per thousand impressions and $18.75 per lead, according to Shopify’s November 2025 figures. These are US-dollar averages across a broad market, not Singapore price lists, and no published S$ range for Singapore exists. Your real social media ads cost depends on what a customer is worth to your business and how well your Facebook ads reach people likely to buy.


This guide answers the question in three steps: start from what a customer is worth, work out the most you can pay per lead, then cut the spend that fails to convert. The Cost-to-Outcome Ladder sets out that sequence and is the strategy used throughout. Each step relies on a simple campaign objective: the result you want the spend to produce. Well-run campaigns tie each objective to a measurable outcome before any budget is committed.
Key Takeaways
- Published averages mislead. Shopify’s November 2025 figures describe a market, not your account.
- Budget for leads, not clicks. A customer worth $150, with a target of one-fifth of that value, gives a ceiling of about $30 per lead.
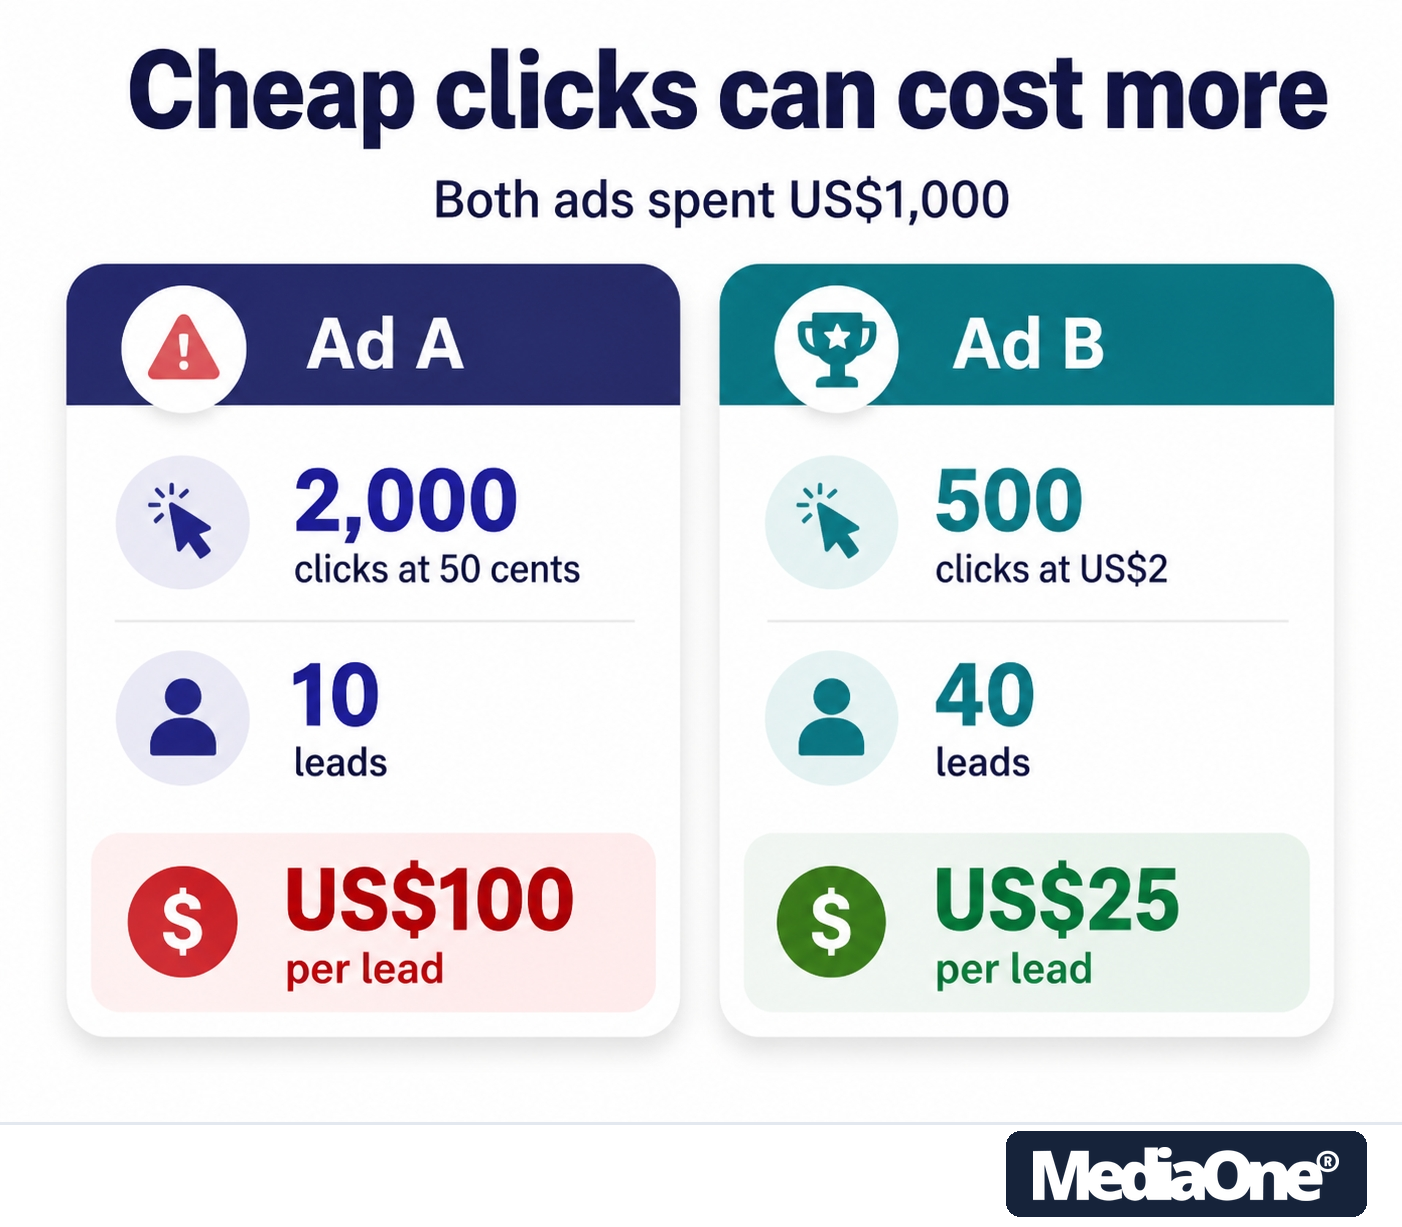
- Cheap clicks can cost more. Low CPC with weak conversion can outspend higher CPM with strong conversion.
- Measure your own baseline. No S$ benchmarks exist, so test in Meta Ads Manager first.
- Budget for testing. A $1,000 to $5,000 monthly budget funds roughly 2 to 3 ad sets, according to Ninja Promo’s 2026 guide.
How Facebook Ad Pricing Works
Facebook ad pricing is set by auction, and each dashboard number measures something different. Every Facebook ads strategy depends on understanding these costs, so the metric you track should guide your decisions, and the advertising costs you pay should be judged against the experience and content your audience actually sees.
The three numbers that define your spend: CPC, CPM and CPL
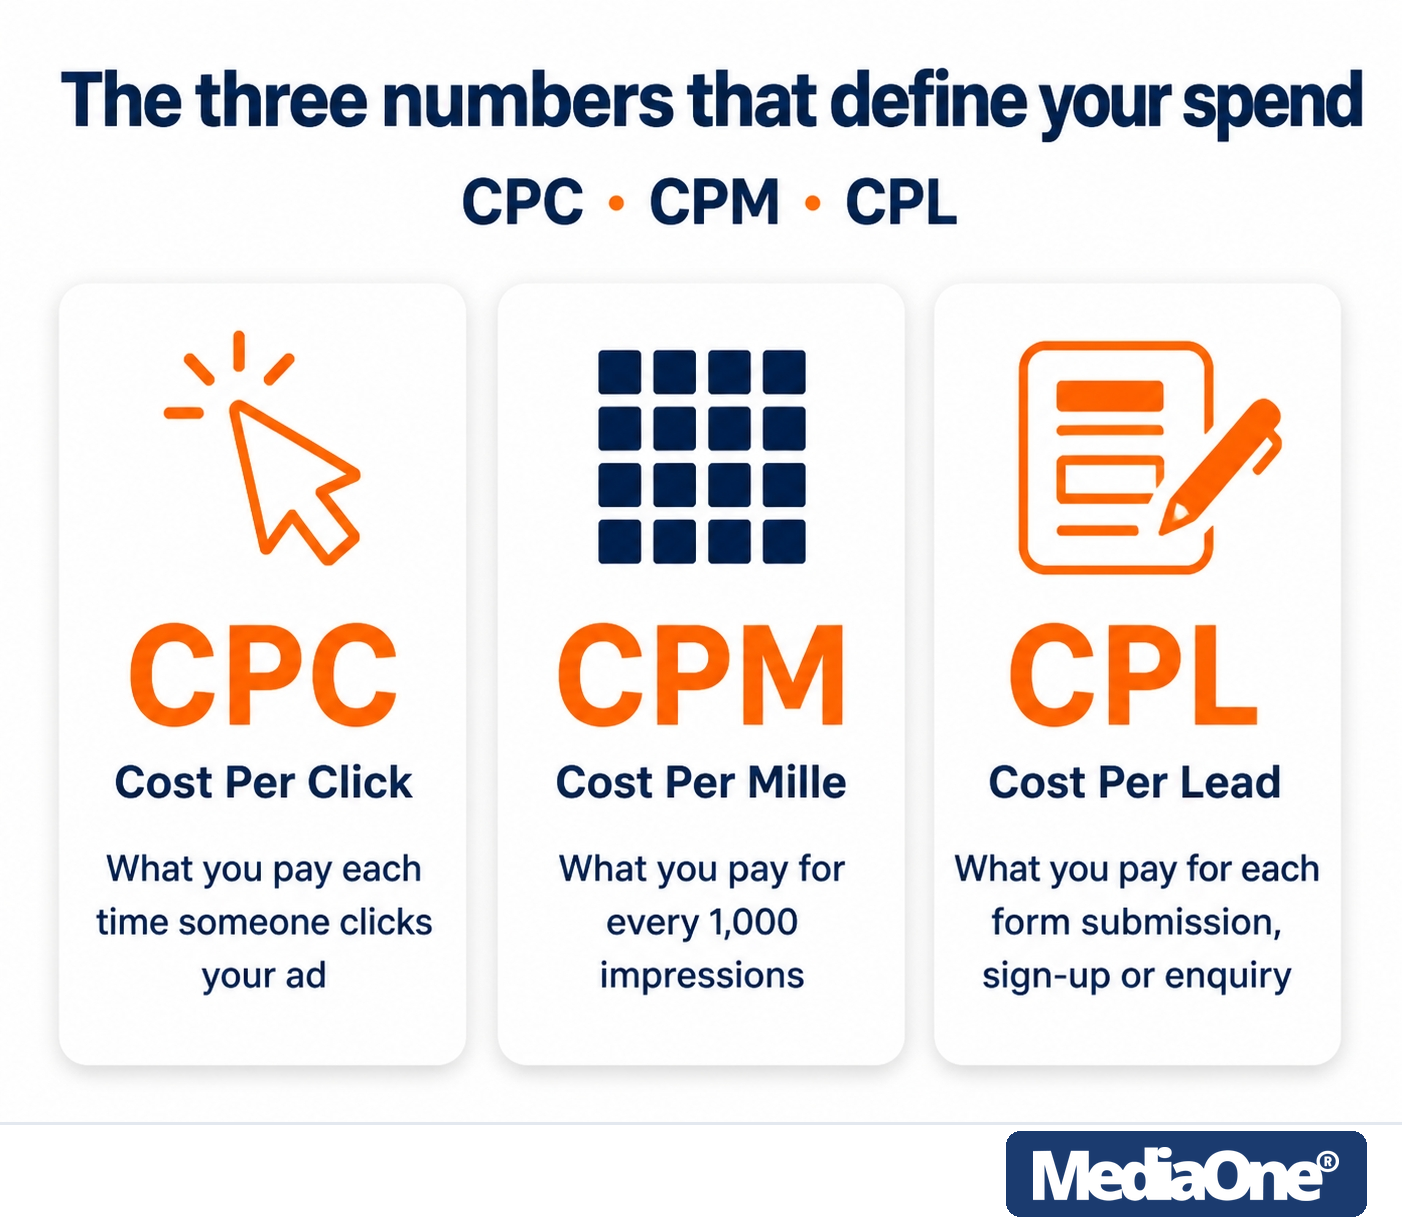
Cost per click (CPC) is what you pay each time someone clicks your ad. Cost per mille (CPM) is what you pay for every 1,000 impressions. Cost per lead (CPL) is what you pay for each form submission, sign-up or enquiry, such as a lead captured by a Facebook ad that sends visitors to your website.
Shopify’s November 2025 averages were 87¢ CPC, $16.06 CPM and $18.75 CPL. These are US-dollar figures across a broad market, not a Singapore price list.

A low CPC can still mean an expensive campaign. Divide spend by the outcome you want, not by the click count, so your digital marketing costs reflect the goals you set for each campaign. The cheapest click rarely produces the cheapest lead, which is why cost per lead is the figure to manage.
A formula linking CPM, CTR and CPC to cost per lead
The three metrics are linked. CTR, or click-through rate, is the share of impressions that produce a click. CPC equals CPM divided by (CTR × 1,000). Cost per lead equals CPC divided by conversion rate. Combined, cost per lead equals CPM ÷ (1,000 × CTR × conversion rate).
Using Shopify’s averages as an illustration: a $16.06 CPM with a 0.90% CTR gives a CPC of about $1.78. That does not match the 87¢ average, which shows how much the figures vary between accounts. Test with your own numbers, and do not expect the averages to line up neatly.
Pricing models and how Meta charges you
Meta does not sell fixed placements. Each ad slot is auctioned among advertisers competing for that user. You are charged by impressions (CPM), clicks (CPC) or conversions, depending on your objective and bidding.
Meta Ads Manager offers six objectives: Awareness, Traffic, Engagement, Leads, App promotion and Sales. Meta’s own Ads Manager documentation confirms this list and maps each objective to the business goals it serves, so check it before you build a campaign and make sure your goals match the right objective. Audience targeting also shapes which objective fits your budget.

A daily budget caps spend per day, and a lifetime budget caps total spend over a fixed run. For most small advertisers, a daily budget gives more control. Shopify’s guide also notes the platform minimums: $1 per day for campaigns billed by impressions, and a recommended $5 per day for traffic or sales campaigns.
How the Facebook ad auction decides what you pay
The auction ranks ads on total value, not price alone. Meta’s documentation on how its machine learning delivers ads describes three inputs: your bid, the estimated action rate (Meta’s prediction of how likely a user is to act on your ad), and ad quality, which reflects user feedback such as hides and reports. The three are combined to calculate each ad’s total value score. Meta does not publish its exact ranking formula.
Typically, a cheaper ad that users respond to can outrank a higher bidder with weak engagement. If costs climb, check your estimated action rate and ad quality before raising your bid. Often, a higher CPM with a better conversion rate is the cheaper option overall.
Benchmark Costs: What Singapore Advertisers Should Expect
Published averages are a useful sanity check, but a weak budgeting tool. Your actual cost depends on your own cost per lead or cost per sale, and on who your target audience is. Start from your own experience of what converts, not from someone else’s averages, then measure results across each campaign you run.
Shopify’s guide to Facebook ad costs reported an average CPC of 87¢, an average CPM of $16.06 and an average CPL of $18.75 for November 2025. As a comparison point, AdRoll’s April 2026 roundup of aggregated industry research put Facebook at about $0.44 per click, $14.40 CPM and $5.83 per lead. Definitions, sample sizes and dates differ between sources — treat every published figure as a range, not a rate card.
|
Metric |
Global average (Shopify, Nov 2025, US$) |
Industry aggregate (AdRoll, Apr 2026, US$) |
Philippines (TrueLogic, Sep 2025) |
What it measures |
|
CPC |
$0.87 |
~$0.44 |
₱10–₱105 |
Cost per click |
|
CPM |
$16.06 |
~$14.40 |
₱57–₱498 |
Cost per 1,000 impressions |
|
CPL |
$18.75 |
~$5.83 |
₱250–₱350+ |
Cost per lead |
|
CTR |
Not stated |
Not stated |
Not stated |
Click-through rate |
Currencies, dates and definitions differ, so do not read these as one market. Measure your own CTR baseline in Meta Ads Manager.
Singapore lead-cost benchmarks by industry
No Singapore-sourced cost-per-lead figures by industry were found in the sources available for this article. Ask a local agency or pull your own account history, segmented by industry, before setting a target.
Budgeting by Singapore business size
The planning ranges below convert Ninja Promo’s 2026 budget guidance into S$ at an assumed rate of US$1 ≈ S$1.28 (the mid-market rate in mid-October 2026, per Bloomberg — check the current rate before you budget). They are planning guides, not benchmarks.
- Small business (about S$1,280 to S$6,400 a month): enough for 2 to 3 ad sets to test audiences and creatives, per Ninja Promo.
- Mid-sized business: set spend as a share of marketing budget — commonly cited planning guidance puts local businesses’ digital marketing at 5 to 10 percent of revenue, but your margins should drive the number.
- Larger business: plan budgets against your own cost per lead, since competition for the best placements rises with spend.
Benchmarks move with industry, audience (narrow audiences bid against more rivals) and season (costs rise around peak shopping periods). Narrow targeting usually raises the cost of each click, so weigh it against the quality of the audience you gain. These Facebook targeting techniques show how to narrow without overpaying.
How much to budget for different business sizes
The useful question is what a test budget buys. At an average CPC of 87¢, US$1,000 a month would theoretically produce around 1,100 clicks, though the figure is in US dollars, so convert before relying on it. A minimum budget is one that funds enough conversions to judge a campaign, and the right size depends on your campaign objective.

Scaling is more than raising the daily budget, because larger spend opens access to more competitive placements. TrueLogic’s guide suggests scaling up to ₱25,000 to ₱50,000 a month to compete for the best placements. These are Philippine peso figures, not Singapore dollars.
TrueLogic’s guide puts graphic design for Facebook ads at ₱262 to ₱524 per visual for standard graphics, and ₱2,000 to ₱3,400 for more complex designs. These are Philippine peso rates, so expect Singapore pricing to differ. Strong content often costs real time and money to produce, so count it as part of your campaign budget.
Agencies usually charge a monthly retainer, a percentage of spend or a per-project fee. Add it to the media budget before judging returns.
Total cost of ownership is media spend, plus production, plus management, plus review time. Divide that total by the leads or sales produced. That figure, not the CPC on your dashboard, is what you should compare against the value of a customer.
Factors That Drive Your Facebook Advertising Cost
Your cost is shaped by who you target, how strong your ads are, when you run them and what you ask the campaigns to do. Competition within your category also affects what you pay for each result, and a business in a crowded market will usually pay more per result than one with less rivalry.
Audience targeting and its effect on price
Broad audiences are cheaper per impression. Narrow audiences cost more because you compete for a smaller group. Start broad, then narrow only where data shows results justify it.
Ad quality, relevance and format
Ads users engage with, and do not hide or report, tend to win placements more cheaply. Meta’s relevance diagnostics assess three categories — quality, engagement rate and conversion rate — so test formats and messages before scaling a single winner. One study, cited by AdRoll’s platform cost breakdown, estimated that images on Instagram see 23% more engagement than when shared on Facebook, so test placements separately. Strong content helps your Facebook ads reach the right people at a lower price, and it is a core discipline of any effective social media advertising programme.
Seasonality, ad frequency and campaign duration
Costs rise in peak shopping periods, when more advertisers bid for the same users. Shopify notes CPCs can double or even triple around extra-competitive windows such as Black Friday:
- Major shopping events (such as year-end sales): expect higher competition, so set a higher budget or narrow your audience.
- Quiet months: competition may be lower, making tests cheaper.
When the same person sees an ad many times, performance usually falls. Shopify advises refreshing creatives once frequency climbs beyond about two to three, and checking frequency weekly in Ads Manager.
Campaign objectives and performance goals
Your objective sets what Meta optimises for, and so what you pay. A Leads objective may or may not be cheaper per customer than a Sales objective, depending on your offer. Test both against your own cost per acquisition, and check whether a brand awareness goal fits your stage before committing budget. Base each decision on your own website conversion data rather than on assumptions.
Practical Strategies to Reduce Your Facebook Ad Costs
Lower Facebook advertising costs come from better targeting, stronger creatives and tighter measurement, not a single setting. Most social campaigns run alongside other channels, so measure each one against the same goal. Strong digital marketing performance depends on this shared measurement, and on comparing reach, cost and results in the same way across every platform. A well-run Facebook ads campaign rewards this discipline, since you’ll see clearer costs when every channel is judged the same way.
Choosing the right bidding strategy
Pick the bidding approach that matches your goal. Meta’s Ads Manager offers a default option called Highest Volume, previously called Lowest Cost, which carries no cost controls: Meta spends your budget to get as many results as possible, bidding freely in auctions. Cost caps and bid caps limit what you pay per result, but set too low they can cut delivery. A cost cap is the ceiling you set on the average amount you pay per result, and a bid cap is the highest amount Meta may bid in any single auction. Let the campaign exit its learning phase, the period in which Meta gathers data to optimise delivery, before judging performance.
Shopify’s guide to Facebook ad costs — which follows Meta’s own documentation — suggests an ad set needs around 50 optimisation events in the week after its last significant edit to exit the learning phase. Treat this as a rule of thumb, not a guarantee, and check the current wording in Meta’s Ads Manager help centre.
Testing creatives and landing pages to lower CPA
Run A/B tests changing one variable at a time (image, headline or call to action), keeping audience and budget constant. Compare cost per lead, the amount you pay for each enquiry or sign-up, once enough conversions have accrued, so the data is clean enough to show which version performs best. Judge landing page performance on conversion rate, the share of visitors who complete the form, and on how quickly the page loads on mobile.
A slow or confusing landing page wastes paid clicks. Check that your page loads in under three seconds on a mobile connection and asks for one clear action. Strong creative and a clear page together raise the experience a visitor has, which lifts results without adding spend.
Retargeting and frequency management
Retargeting reaches people who already visited your site or engaged with your content. These warmer audiences can lower the cost of each result. Watch ad frequency, the average number of times each person sees your ad, and refresh creative once it climbs above about two to three views per person in a week while click-through rate falls. Watch reach and brand awareness so repeat exposure does not turn people away.
A checklist for cutting waste
- Pause ad sets with no conversions after a set test budget.
- Remove placements that deliver clicks but no leads.
- Check the conversion pixel fires on the thank-you page.
- Review cost per lead weekly, not only cost per click.
- Refresh creatives when frequency rises and performance falls.
Forecasting and Budgeting Your Next Campaign
A forecast turns known numbers into an expected budget, so you can check whether the plan is realistic before you spend. It also helps you judge whether a digital marketing channel such as social media, including Facebook ads, is worth funding. Tracking your cost per lead against your ceiling tells you whether your spend is working, and a clear view of your target audience helps you forecast which numbers to trust. Good forecasts rest on reliable data, so use the same measurement method each month.
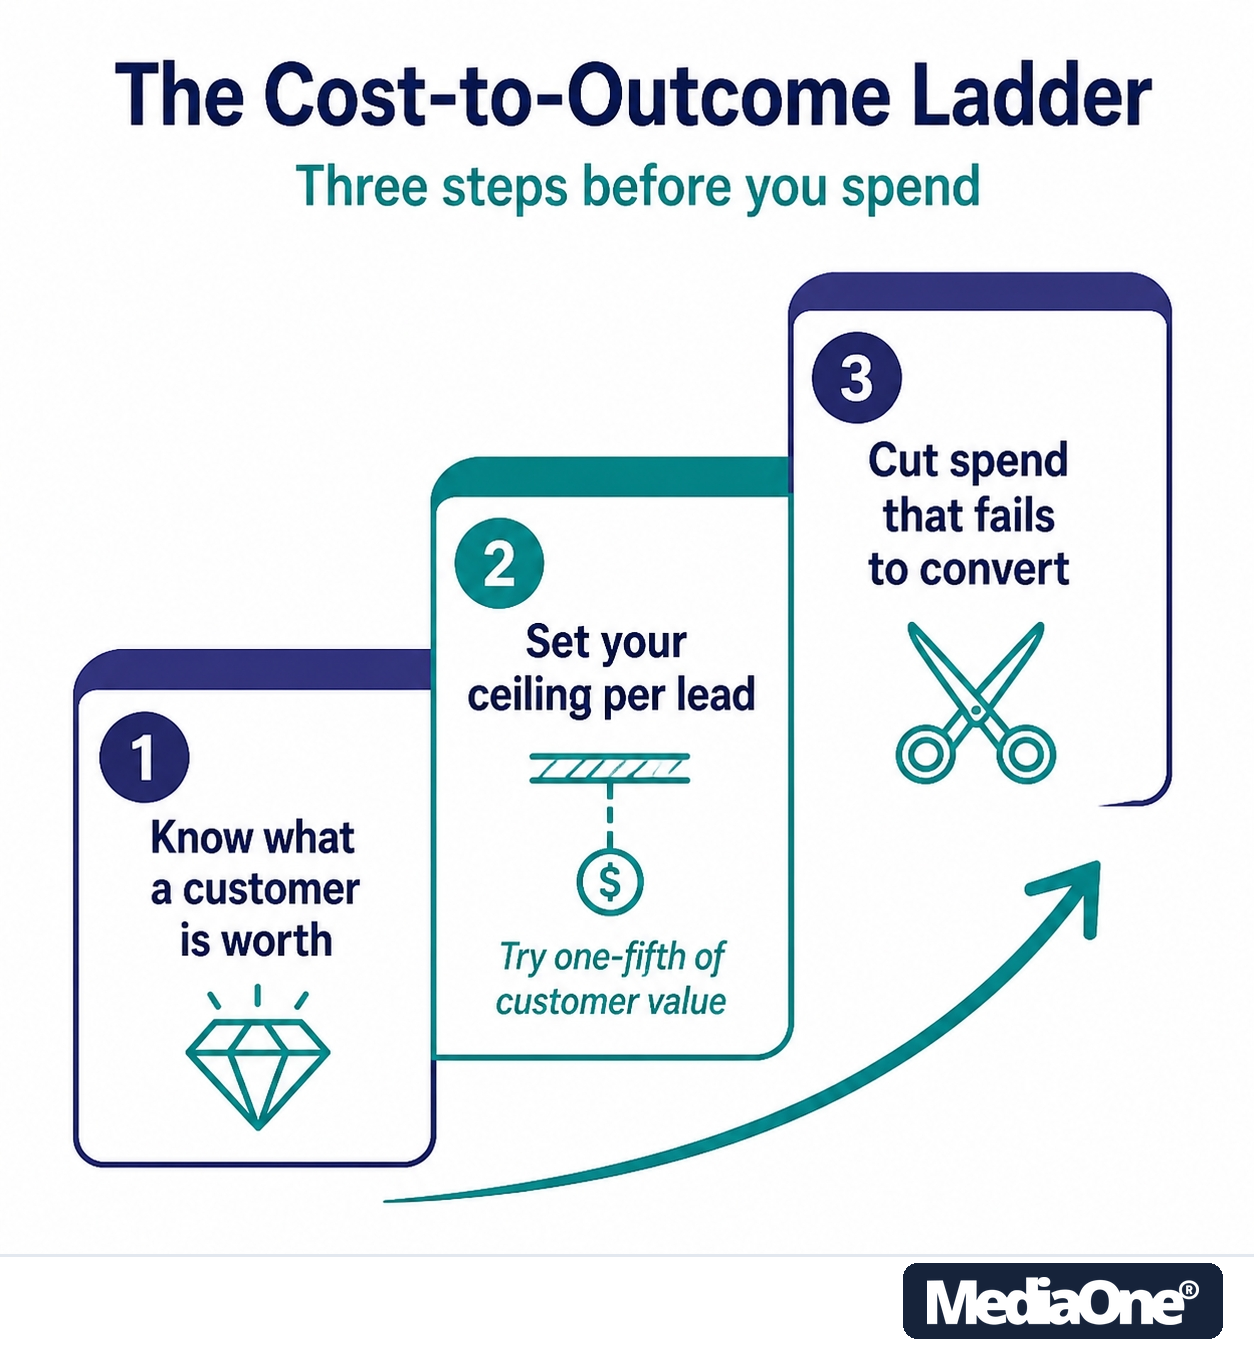
Figure: The Cost-to-Outcome Ladder: the three-step sequence this guide follows.
A worked example: calculating your expected results
Worked example. Assume a customer is worth US$150 in profit and you spend no more than US$30 per lead. A CPL of US$18.75 sits within that ceiling, and the margin is US$131.25 per customer if each lead converts. The figures below use US$ from Shopify’s November 2025 benchmarks, which are US-dollar averages from a broad market, not a Singapore price list. Convert to S$ at the rate on the day you plan.
Cost per lead equals CPM divided by 1,000, divided by the click-through rate, divided by the conversion rate on the landing page. For example, a CPM of US$16.06 with a 0.90% click-through rate gives about US$1.78 per click. If 10% of visitors fill in the form, the cost per lead is about US$17.78, close to the November 2025 average of US$18.75 reported by Shopify. Each variable is a lever on the outcome, so decide which one to pull first. Your ads cost forecast depends on these levers.
- Step 1: Budget divided by CPC gives expected clicks. At the November 2025 average CPC of 87 cents, per Shopify’s guide to Facebook ad costs, US$1,000 yields about 1,149 clicks. Treat this as a planning figure, not a promise.
- Step 2: CPM and target impressions set the spend. At the average CPM of US$16.06 (same source), US$1,000 buys roughly 62,000 impressions. A small audience with a high CPM may not be large enough for a meaningful test.
- Step 3: CPL forecasts lead volume and acquisition cost. At the average CPL of US$18.75 (same source), US$1,000 buys about 53 leads. If 10% buy, you expect about five customers at roughly US$200 each. Check that against what a customer is worth to your business.
Building a realistic monthly budget
A reliable budget has two parts: a working budget for proven campaigns and a testing reserve for new ideas, so your content strategy can evolve without starving what already works.
- Starting budget. Ninja Promo’s 2026 guide puts small-business spend at US$1,000 to US$5,000 a month, funding 2 to 3 ad sets. This is a heuristic rather than a fixed rule, and these are US-based benchmarks, so adjust to your own margins and convert to S$.
- Testing reserve. Hold back roughly 20 per cent of the monthly budget for tests. This is the writer’s own working heuristic, so new audiences or creatives do not starve proven campaigns.
- Scoring the next dollar. Score each campaign from 1 to 3 on cost per lead against your ceiling, post-click conversion rate, and frequency. A total of 7 to 9 earns more budget, 5 to 6 keeps spend while you test, and 3 to 4 gets paused or rebuilt. These cut-offs are our own heuristic, not an industry standard.
- Monthly review. Compare CPC, CPM and CPL with published figures and your previous month. A higher CPC is not automatically bad if your leads cost less. Read the metrics together, never one at a time, and you’ll spot problems sooner.
Frequently Asked Questions
How much does Facebook advertising cost per day in Singapore?
There is no fixed daily price, because Meta sets cost through a live auction. A planning frame from Ninja Promo puts small businesses at US$1,000 to US$5,000 a month, or roughly US$33 to US$165 a day — about S$43 to S$211 at the mid-October 2026 rate of US$1 ≈ S$1.28. Meta’s own platform minimums are US$1 a day for impressions-billed campaigns, with US$5 a day recommended for traffic or sales campaigns. Measure your own baseline in Meta Ads Manager, where your results will show your real cost.
What is a good CPC for Facebook ads?
A good CPC depends on your target cost per lead. The November 2025 global average CPC was 87 cents, according to Shopify’s guide. Work back from the value of one customer to set your ceiling, then check whether your ads cost stays under it.
Why is my Facebook ad cost increasing?
Rising costs usually come from ad fatigue, a narrowing audience or seasonal competition. Check frequency first. If it climbs while click-through rate falls, refresh the creative or widen the audience to protect your reach and performance.
Is Facebook advertising worth it for a small business?
It is worth it when cost per lead sits below what a customer is worth to you. Common planning guidance suggests allocating 5 to 10 per cent of revenue to digital marketing as a starting frame for budgets, but your own margins and cost per lead should set the final number.
What is the difference between CPM and CPC?
CPM is the cost to show your ad 1,000 times. CPC is the cost per click. A higher CPM can still be cheaper per lead if its audience converts better, so judge each campaign on its results.
How do I lower my cost per lead on Facebook?
Test one variable at a time: creative, audience or landing page. A better conversion rate lowers cost per lead without changing the bid. Pause ad sets whose cost per lead stays above your ceiling after a fair test.