

| AI SUMMARY
Bounce rate is the percentage of sessions that were not engaged. In Google Analytics 4, it is the inverse of engagement rate, and a session counts as engaged if it lasts longer than 10 seconds, triggers a key event or includes two or more page or screen views. This guide explains how to find and segment bounce rate in GA4, what is normal by page type and traffic source, why it is not a direct Google ranking factor, when a high rate is nothing to worry about, and seven practical ways to lower it. |
Bounce rate is one of the most watched metrics in web analytics, and one of the most misunderstood. A high bounce rate can signal a genuine problem with your website, or it can mean nothing at all, depending on your page type and traffic source.


This guide explains what bounce rate actually measures, why it matters for user experience and SEO, and which actions influence it most. It also covers when bounce rate misleads you, and how to pair it with other metrics for a complete picture of visitor behaviour.
Updated October 2026 · Reviewed against current Google documentation and 2025–2026 industry benchmarks · Reading time approx. 16 minutes
Key Takeaways
- Bounce rate is the percentage of sessions that were not engaged. In Google Analytics 4, it is the inverse of the engagement rate: a session counts as engaged only if it lasts longer than 10 seconds, triggers a key event, or includes two or more page or screen views.
- Most sites sit in a 40 –60% range, but benchmarking against your industry and your own historical baseline matters far more than hitting a universal number. Contentsquare treats 40% or lower as good and above 55% as high.
- Google does not use analytics bounce rate as a ranking factor. It does use Core Web Vitals, and it states plainly that the other page-experience aspects “don’t directly help your website rank higher”.
- In 2025, only 48% of mobile and 56% of desktop origins passed all three Core Web Vitals (LCP, INP, CLS).
- Yottaa’s 2025 Web Performance Index found that 63% of shoppers abandon pages that take four seconds or longer to load, and that saving one second lifted mobile conversions by 3%.
- Bounce rate depends on context: informational pages such as blog posts naturally bounce more than product or pricing pages, because many readers get their answer and leave.
- Setup matters: GA4 measures bounce differently from the retired Universal Analytics, so compare historical data with care, then segment by device, source and page type to find the changes that will move the needle.
What is bounce rate?
Bounce rate is the percentage of website visitors who leave after viewing only one page without triggering any other action on your site. A bounce occurs when someone lands on a page and departs without clicking a link, submitting a form, making a purchase, or navigating to another URL on your domain.
The term “bounce” comes from the idea of a visitor bouncing off your site and returning to the search results or their previous location. It is a session-level metric: if a user arrives, reads, and leaves without interacting further, that counts as one bounce.
This differs from simply leaving your site. A visitor who reads three pages and then exits is not bouncing. A visitor who lands on page A, clicks through to page B, then leaves is also not bouncing. Only single-page, unengaged sessions count.
How bounce rate is measured
Bounce rate is calculated from your web analytics platform, most commonly Google Analytics. Out of 100 sessions, if 40 are unengaged, your bounce rate is 40%. The formula is straightforward:
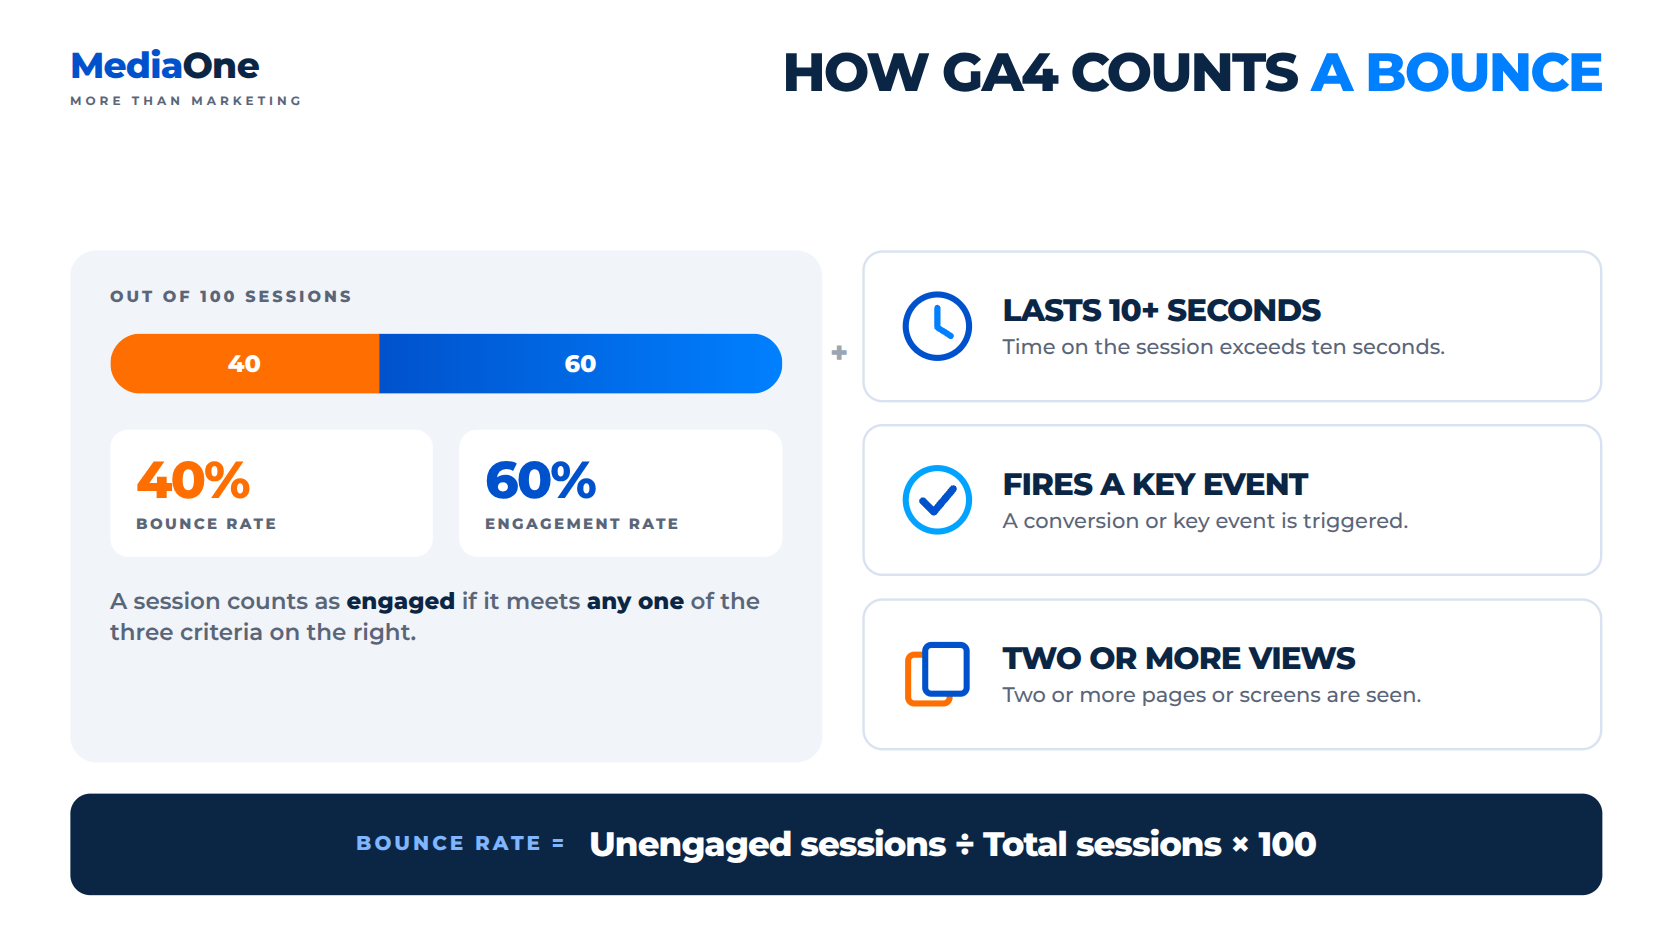
Bounce rate = (Unengaged sessions ÷ Total sessions) × 100
In Google Analytics 4 (GA4), bounce rate is defined as the percentage of sessions that were not engaged, so it is simply 100% minus the engagement rate. Google defines an engaged session as one that meets any of three criteria: it lasts longer than 10 seconds, it triggers a key event (previously called a conversion event), or it includes two or more page or screen views.
This model differs from the earlier Universal Analytics (retired in 2023), which counted any single-page session as a bounce regardless of time spent or interaction. That difference is one of the main reasons bounce rate can appear to “jump” after a migration between platforms, so compare historical data with care.
Finding bounce rate in GA4
- Sign in to Google Analytics and open your GA4 property.
- Go to Reports → Engagement → Pages and screens.
- Click Customise report (top right) and add the Bounce rate and Engagement rate metrics, since GA4 does not include them in most reports by default.
- Read the bounce rate for each page or screen, then segment it by traffic source, device, geography and user behaviour using comparisons and custom segments.
A 60% bounce rate from organic search might be normal, while 60% from paid search often signals a problem. This segmentation is critical for drawing actionable conclusions, and it is a core part of the data-driven SEO framework we use to connect analytics to outcomes.
Third-party tools such as Semrush, Contentsquare and Hotjar add context through heatmaps, session recordings and scroll depth. These reveal why visitors bounce, not just that they do.
Typical bounce rate benchmarks
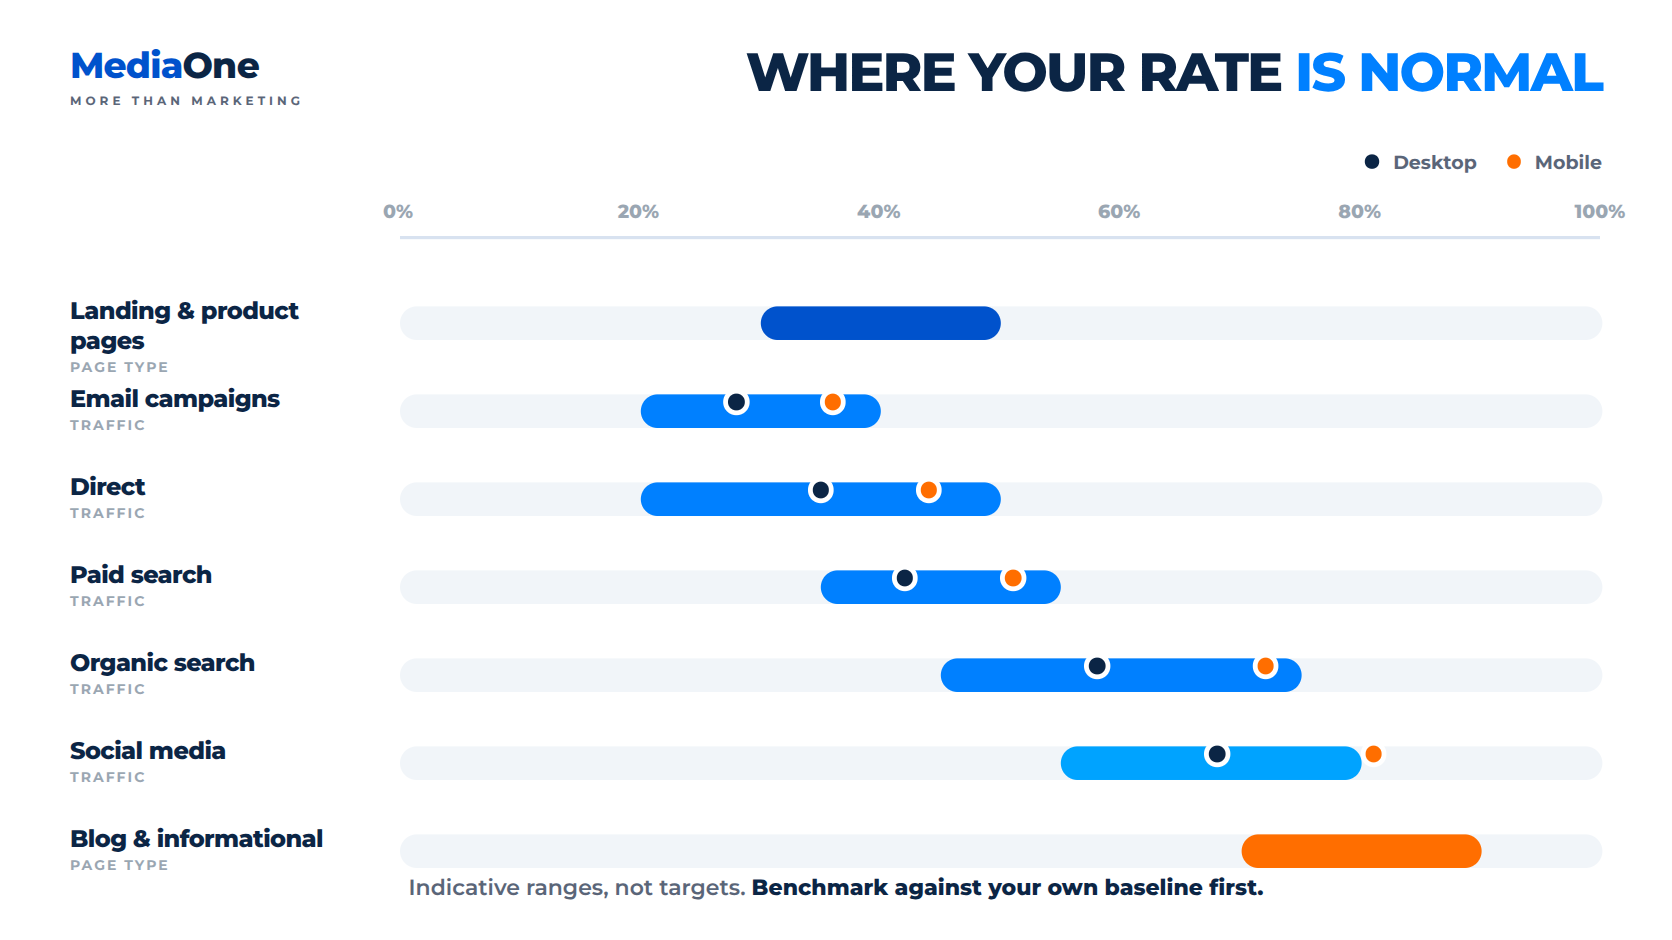
Bounce rate varies significantly by industry, page type and traffic source, which is why context is everything. A 75% bounce rate on a blog post can be healthy; a 75% bounce rate on a product page usually signals a problem.
How to read these ranges. The figures below are indicative ranges drawn from commonly cited industry benchmarks, not official Google data. They are useful for a sanity check only. For an authoritative comparison, use Contentsquare’s 2025/2026 Digital Experience Benchmarks and, most importantly, your own historical baseline.
By industry
| Indicative bounce-rate ranges by sector (for context, not targets). Sector | Typical bounce rate (indicative) |
|---|---|
| E-commerce | 40–50% |
| B2B SaaS | 45–55% |
| News and media | 55–75% |
| Blogs and content | 70–90% |
| Directory or reference | 50–65% |
| Hospitality and travel | 45–60% |
| Financial services | 40–60% |
| Retail (non-e-commerce) | 50–65% |
By page type
Landing pages and product pages typically have lower bounce rates (roughly 30–50%) because visitors arrive with intent. Blog posts and informational pages naturally see higher rates (roughly 70–90%) because readers find an answer and leave — which is intentional, not a problem.
By traffic source
| Indicative bounce rate by traffic source, with illustrative desktop/mobile splits. Traffic source | Indicative range | Desktop | Mobile | Sensible target |
|---|---|---|---|---|
| Organic search | 45–75% | 58% | 72% | <60% organic; <70% mobile |
| Paid search (PPC) | 35–55% | 42% | 51% | <45% |
| Social media | 55–80% | 68% | 81% | <70% |
| Direct | 20–50% | 35% | 44% | <40% |
| Email campaigns | 20–40% | 28% | 36% | <30% |
The read is straightforward: a 55% bounce rate on organic search may be acceptable, but the same rate on paid search likely represents wasted ad spend. Organic visitors research and may bounce when content does not match query intent, whereas paid visitors arrive with higher relevance expectations, so a high rate there points to poor ad-to-page fit.
Why bounce rate matters for your business
Connection to user experience
Bounce rate is a proxy for initial satisfaction. When visitors land on your page and leave within seconds, it usually means one of three things: the page failed to meet their expectations, the experience was broken, or the friction to finding what they needed was too high.
Google’s Core Web Vitals framework measures three dimensions of that experience: loading speed, visual stability and interactivity. Pages that load slowly, shift unexpectedly or respond sluggishly accumulate bounces, and mobile users are particularly sensitive to performance.
Bounce rate also reflects content alignment. If a user searches for “how to fix a leaky tap” and lands on a plumbing services sales page with no instructional content, they bounce. If they arrive on a mobile site that forces them to zoom and scroll horizontally, they bounce. These are not failures of the visitor; they are failures of the page to match intent or to be usable.
Unlike metrics that require deeper interaction to measure, bounce rate captures the first impression. A 70% bounce rate on your homepage suggests that seven in ten visitors do not see a sufficient reason to explore further. Conversely, a 35% bounce rate on a product page suggests the value proposition, visuals and calls-to-action are resonating.
Bounce rate as a search ranking signal
Bounce rate is not a direct ranking factor in Google’s algorithm. Google’s own page-experience documentation confirms that Core Web Vitals are the aspect of page experience used by its ranking systems, and states that “beyond Core Web Vitals, other page experience aspects don’t directly help your website rank higher in search results”. Google’s John Mueller has repeatedly confirmed publicly that the analytics bounce rate is not something Google looks at when ranking websites.
The relationship is indirect but meaningful. A page that satisfies search intent will hold visitors longer, generate more internal engagement and attract more return visits, and those satisfaction signals align with what Google’s ranking systems seek to reward. Reducing bounce rate by improving content quality, clarity, and page speed is one factor among many — SEO improvement depends on multiple signals and competitive context, not bounce rate alone.
One caveat: not all bounces are detrimental. A user who searches for a weather forecast, finds the answer at the top of your page, and leaves has still had their intent satisfied. A bounce followed by a return to search signals different intent than a bounce that ends the session. If bounce rate is high but engagement and dwell time are also high, your content is doing its job.
Impact on revenue and conversion
For e-commerce, lead-generation and subscription businesses, bounce rate is a direct revenue indicator. Every bounce is a visitor who did not add an item to the basket, request a demo, sign up to a newsletter or enter the sales funnel.
Worked example (illustrative figures, not industry averages). A site with 10,000 monthly visitors and a 60% bounce rate has 6,000 visitors who never reach a conversion point. If the conversion rate among engaged users is 2%, those bounces represent roughly 120 conversions not generated. At a GBP 50 average order value or a GBP 100 lead value, that is GBP 6,000 to GBP 12,000 in monthly revenue at stake. Lowering bounce to 40% would raise the engaged pool, and therefore potential revenue, proportionally.
The relationship between bounce rate and conversion is not linear, and results depend on your industry and traffic mix, but the direction is consistent: lower bounce rates correlate with higher engagement and higher conversion. The cost of a high bounce rate also extends beyond lost sales. It inflates customer acquisition cost. If you run paid search and 65% of that traffic bounces without converting, your cost per acquisition (CPA) climbs sharply — a GBP 2 cost-per-click campaign that converts at 2% yields a GBP 100 CPA, while the same campaign at 0.8% conversion yields a GBP 250 CPA. The ad spend is identical; the efficiency has halved.
Email marketing shows the same pattern. A campaign that drives traffic to a high-bounce landing page wastes list goodwill and budget, and subscribers who click through and bounce are less likely to engage with future campaigns. For content and blog sites, high bounce rates on articles reduce page views per session and increase the proportion of single-page visits, which limits ad and affiliate opportunity. The strategic insight: bounce rate is a leading indicator of engagement failure, and it surfaces problems faster than conversion rate alone.
Common reasons visitors bounce
Bounce rate does not rise by accident. Most bounces cluster around a small set of preventable problems: technical friction, misaligned messaging, or poor design. Identifying which issue is behind yours determines where to invest effort first.
Page speed and load time issues
Page speed is a well-documented influence on bounce behaviour, particularly on mobile. Google’s own research found that the probability of a bounce rises 32% as page load time goes from one second to three seconds. Yottaa’s 2025 Web Performance Index, an analysis of more than 500 million visits to over 1,300 e-commerce sites, found that 63% of shoppers abandon pages that take four seconds or longer to load, that cutting a second from load time lifts mobile conversions by about 3%, and that third-party apps alone account for roughly 44% of total page load time.
Core Web Vitals (LCP, INP and CLS) are the practical way to measure and improve this. As of 2025, only about 48% of mobile origins and 56% of desktop origins passed all three Core Web Vitals, according to the HTTP Archive’s Web Almanack — so roughly half the mobile web still fails. The mechanism is straightforward: a visitor arrives expecting an answer or a product, and if nothing appears within two to three seconds, they assume the site is broken or slow, and they leave.
How to identify the problem: run your site through Google PageSpeed Insights to audit Core Web Vitals, targeting an LCP under 2.5 seconds, an INP under 200 milliseconds and a CLS under 0.1.3 Then build a custom report in GA4 (under Explore) comparing bounce rate for the same page on desktop versus mobile. If mobile bounces 20 or more percentage points higher, mobile page speed is almost certainly the culprit.
What to fix first: compress images (aim for under 100 KB where possible), lazy-load off-screen images, minify CSS and JavaScript, and defer non-critical JavaScript. A Content Delivery Network such as Cloudflare or AWS CloudFront can cut load time substantially in one step, and managed hosts such as Vercel, Netlify or WordPress VIP offer built-in speed tuning.
Poor mobile experience and responsive design failures
Mobile traffic makes up a large share of web traffic globally, and mobile devices account for a disproportionate share of bounces. Statista reported that mobile devices (excluding tablets) accounted for about 51% of global website traffic in Q2 2026, while StatCounter’s desktop-versus-mobile series has hovered near an even split across 2025–2026 — different panels give different figures, but all agree mobile is at least half the audience and the fastest-growing segment.
A page that renders correctly on desktop but breaks on mobile, with columns stacking wrongly, buttons too small or text overlapping, teaches visitors to leave quickly.
How to identify the problem: in GA4, segment for mobile traffic only and compare mobile bounce rate to desktop. If mobile bounces 15 or more percentage points higher, responsive design or mobile-specific UX is the issue. Use Chrome DevTools (F12, then the device-toggle icon) to step through your page at common breakpoints: 375 px (iPhone SE), 768 px (iPad) and 1024 px (desktop). Note that Google retired its standalone Mobile-Friendly Test tool in December 2023 and now points users to Lighthouse and PageSpeed Insights, so use those instead.
What to fix first: set your base font size to at least 16 px on mobile, make interactive elements at least 48 × 48 px with clear spacing, and remove any element that forces horizontal scrolling. Test forms so that fields stack vertically rather than sitting in two columns on a small screen.
Unclear value proposition and weak headlines
A visitor lands with a question in mind. Within a few seconds, they need to know whether your page will answer it. If the headline, subheading and opening visual do not make that clear, they bounce to the next search result. Vague headlines such as “Welcome to Our Site” or “Learn More”, or headlines that misalign with the search query, drive bounces, as does burying your main value proposition below a large banner, video or hero image.
How to identify the problem: pull a sample of 10 to 20 of your highest-bounce pages and read the H1 and the opening 50 words without looking at the URL. Ask whether this matches what someone searching for the page’s target keyword would expect. Run a scroll-depth analysis using tools such as Contentsquare or Microsoft Clarity to see how far visitors actually read.
What to fix first: make your H1 a direct answer to the search query, not a brand tagline — for example, change “Your Home for Digital Marketing” to “How to Reduce Bounce Rate: 7 Strategies That Work”. Place your main benefit or answer in the first 100 words, without requiring a scroll, and use the inverted-pyramid style: answer first, detail second.
Misaligned traffic source and landing page content
Bounce can spike when the page content does not match the visitor’s intent based on how they arrived. A visitor clicking a paid ad promising “Free SEO Audit” who lands on a product pricing page will bounce. This is often called “landing-page relevance” or “message match”, and high bounce rates on paid search or social campaigns frequently signal this mismatch rather than a site-wide problem.
How to identify the problem: In GA4, segment your bounce rate by traffic source and compare organic, paid, social and direct. Paid search and social often show bounce rates 10 to 20 percentage points higher than organic when message match is poor. Tag paid campaigns with UTM parameters and group your report by “Session source/medium” and “Session campaign” to see which campaigns show the highest bounce.
What to fix first: match the headline and opening visual of the landing page to the ad or social post. If the ad says “Free 30-Day Trial”, the page H1 should echo that, not jump to “Pricing Plans”. For paid campaigns, create dedicated landing pages rather than sending ad traffic to your homepage, and match the headline, visual and opening copy closely. This connects directly to our guide on landing page optimisation in Singapore.
Cookie consent banners, exit-intent pop-ups and auto-playing video advertisements interrupt the reading experience, and many visitors bounce rather than close them. Google’s approach to page experience specifically penalises pages with intrusive interstitials, and a full-page pop-up that appears before the user sees any content is a known bounce trigger.
How to identify the problem: visit your own pages on a new device or in an incognito window. What appears first: the content, or an ad, pop-up or cookie banner? If a visitor must dismiss something before seeing the page, that is intrusive.
What to fix first: move cookie notices to a sticky footer banner rather than a full-page modal, and make the “Accept All” button no more prominent than “Reject All” — consent must be freely given, and a modal that makes rejection harder is non-compliant with privacy regulations. Delay exit-intent pop-ups until after the visitor has engaged for 30 seconds or more, and keep ads below the fold with lazy loading.
Visitors bounce when they do not know where to go next. A page with no internal links, unclear categories, or a navigation menu that does not reflect user intent forces visitors to use the browser back button instead of exploring your site. This is subtler than page speed: a visitor might stay on the page, so bounce rate alone will not catch weak navigation, but they will not convert or return.
How to identify the problem: use a tool such as UserTesting or Maze to run unmoderated user tests, watching five to ten visitors attempt a task. Alternatively, check your GA4 path exploration, filtered for bounced sessions, and audit site structure with a tool such as Screaming Frog or Semrush Site Audit to find pages more than three clicks from the homepage.
What to fix first: add two to three internal links at the end of every page or blog post, pointing to related content with descriptive anchor text, and simplify your main navigation to five to seven items. For content sites, add a related-posts widget showing three to five related articles. Internal linking is a core part of the on-page work we describe in our guide to ethical, sustainable SEO.
How to measure and audit your bounce rate
Before you can lower your bounce rate, you need to know what it is, where it is high, and why. This section covers setting up tracking, segmenting data, and interpreting what the numbers tell you.
Setting up GA4 bounce rate tracking
GA4 calculates bounce rate as the percentage of sessions that were not engaged before the user left your site. To start tracking it: sign in to your property, go to Reports → Engagement → Pages and screens, and add the Bounce rate and Engagement rate columns via Customise report, since GA4 omits them from most reports by default.1
To be alerted when bounce rate spikes, GA4 offers Anomaly Detection and Custom Insights rather than the email alerts some older documentation describes. Go to Admin → Product links → Insights (or the Insights area on the Home page) and create a custom insight that watches the bounce-rate metric and surfaces a card when your conditions are triggered.
Because GA4 pairs bounce rate with engagement rate, a session is “engaged” if it lasts at least 10 seconds, fires a key event, or includes two or more pageviews. This gives a more nuanced picture: a page with a 65% bounce rate and a 40% engagement rate is performing differently from one with a 65% bounce rate and a 10% engagement rate.
Segmenting by traffic source, device and page type
Raw bounce rate tells you only part of the story. A 55% bounce rate is normal for organic search but concerning for email campaigns. Segmenting reveals where your real problems are.

- Traffic source: open Reports → Traffic acquisition, view the bounce rate by source, and compare. Organic search typically bounces higher than email and direct traffic, which should sit below 40%.
- Device type: open Reports → Tech → Tech details and view bounce rate split by desktop, mobile and tablet. If mobile bounce is 15–20% higher than desktop, mobile experience is a leading cause of exits.
- Individual pages: open Reports → Engagement → Pages and screens, sort by bounce rate (highest first), and review the top ten bounciest pages as priority candidates for testing.
Read the combinations, not just the averages. If mobile traffic from social media bounces at 85% while the same channel on desktop bounces at 62%, your mobile user experience is the bottleneck, not your content.
Interpreting the data
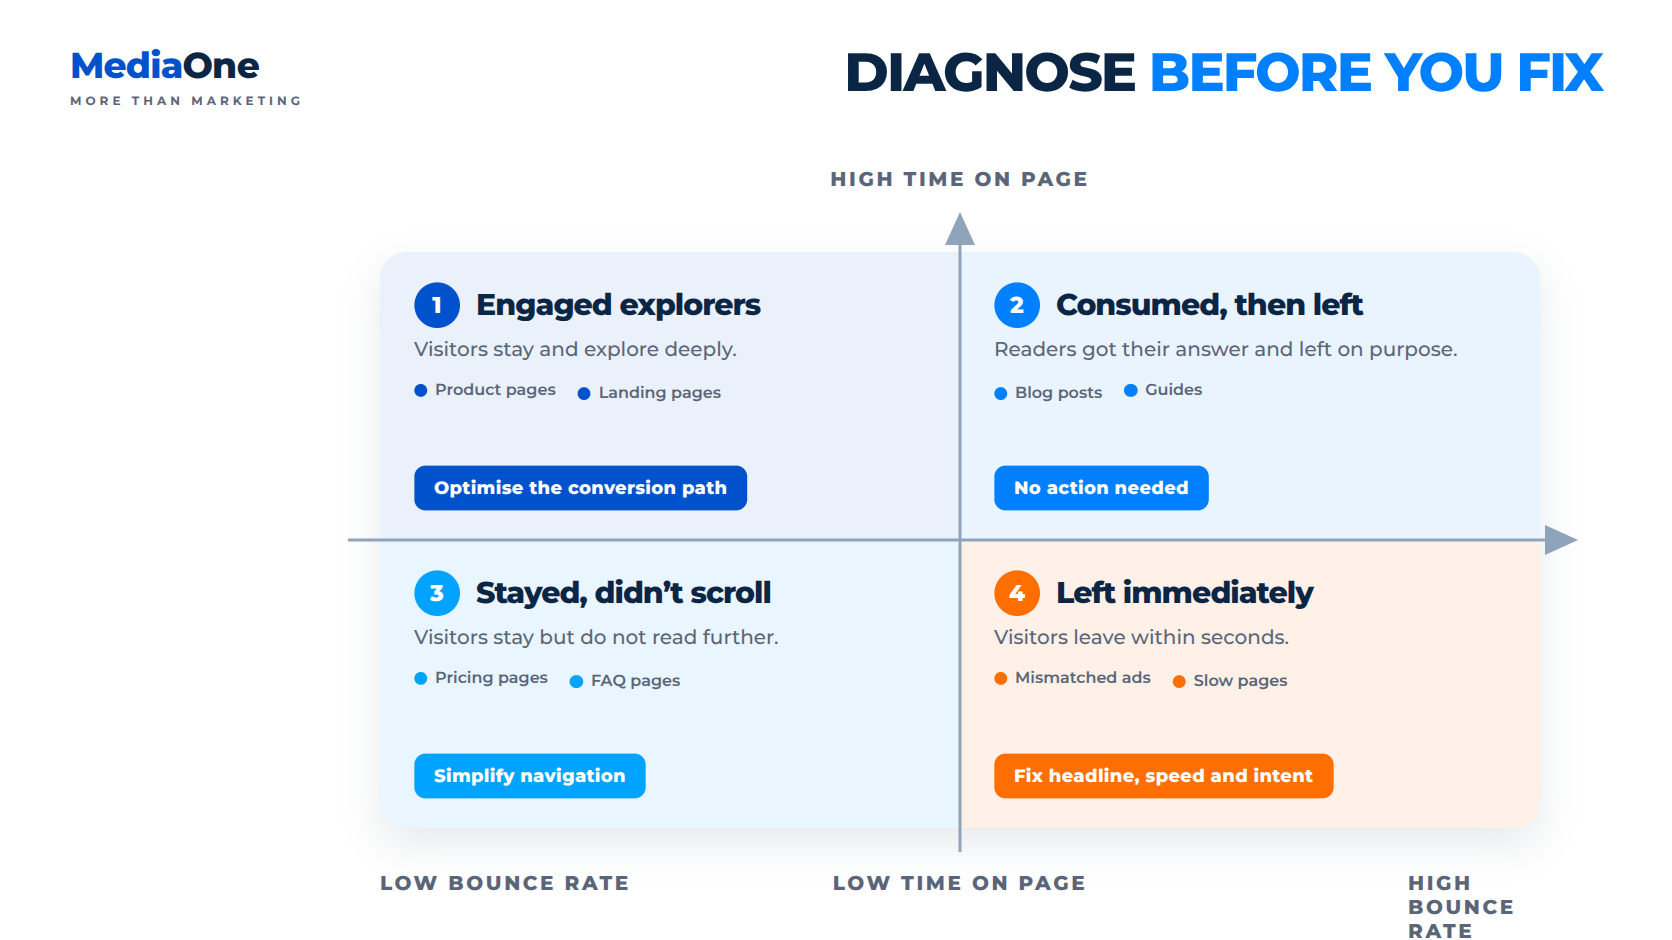
To decide whether a bounce rate is actually a problem, ask three questions: Does it match my industry baseline? Is it higher on mobile than desktop by more than 15% (which points to mobile friction)? And did it spike suddenly (which points to a code change, design update or traffic-source shift)?
Then pair bounce rate with other signals rather than reading it alone.
Tools for deeper analysis
- Google Analytics 4 — free foundation for all bounce and engagement reporting.
- Google PageSpeed Insights — measures LCP, INP and CLS against Google’s thresholds.
- Hotjar and Microsoft Clarity — heatmaps, session recordings and scroll depth to show why visitors bounce; Clarity is free.
- GA4 Explorations — build path, funnel and cohort analyses to isolate where bounced sessions land and go next.
- Semrush or Similarweb — aggregate industry benchmarks and competitor traffic patterns for context.
- A/B testing tools — Optimizely, VWO or Convert for controlled experiments on high-bounce pages. Google Optimize was shut down on 30 September 2023, so it is no longer an option.
Start with GA4 and Hotjar or Clarity to identify what and why. Once you have a specific problem — slow mobile load, an unclear headline, high form friction — use a testing tool to validate the fix before rolling it out to all traffic.
Seven actionable strategies to reduce bounce rate
Bounce-rate improvements fall into three categories: technical fixes (speed, mobile), content and messaging fixes (headlines, value proposition), and experience design (navigation, CTAs). Start with the category that matches your highest-bounce pages.
1. Improve page load speed
Target: under 3 seconds, ideally under 2.
Run PageSpeed Insights on your top ten bounciest pages and note the LCP: anything above 2.5 seconds is a bounce risk.3 Implement the quick wins first: compress images to under 100 KB, enable lazy-loading below the fold, minify CSS and JavaScript, and defer non-critical JavaScript so critical content loads first. If LCP remains above 2.5 seconds, upgrade to a CDN or a faster hosting plan. Re-test after a week.
Expected bounce reduction: 5 –15% on pages with LCP above 3 seconds.
2. Optimise for mobile-first browsing
Target: mobile bounce no more than 15 points higher than desktop.
Open your five bounciest pages on an actual device, not just an emulator. Do you need to zoom to read? Are buttons hard to tap? Does the layout break? Then test in DevTools at 375 px, 768 px and 1024 px, set font size to a minimum of 16 px, make tap targets at least 48 × 48 px, ensure forms stack vertically, and remove anything that forces horizontal scrolling. Compare mobile bounce two weeks before and after the changes.
Expected bounce reduction: 5 –20% on mobile traffic if layout or speed issues exist.
3. Strengthen headlines and opening copy
Target: the H1 directly answers the search intent, and the first 50 words compel further reading.
List your top ten bounciest pages and rewrite each H1 to be a direct answer to the searcher’s intent rather than a brand statement. Rewrite the opening 50–75 words to lead with the answer or benefit, avoiding marketing-speak. A/B test the new headline and opening on 50% of traffic for two weeks, and if bounce drops by 3% or more, roll it out.
Expected bounce reduction: 3 –8% on pages with weak headlines.
Target: every page should have two to five internal links with descriptive anchor text.
Audit your top ten bounciest pages and count internal links. If a page has fewer than two, add two to three links to related content at the end of the page or in a sidebar, using descriptive anchor text (“Learn how to optimise page speed”) rather than “Click here”. This is one of the highest-leverage, lowest-cost changes you can make, and it reinforces the internal linking we cover in our article on business blogging for growth and SEO.
Expected bounce reduction: 2 –5% on pages where internal linking is poor.

5. Improve visual hierarchy and scanability
Target: visitors understand the main point within 3 seconds of landing, without scrolling.
Open your five bounciest pages and, without scrolling, ask what you see. If the main value proposition, answer or CTA is not immediately obvious, redesign the above-the-fold area with a compelling H1 and short subheading, short paragraphs, subheadings, bullet points and visual elements. Use a heat-mapping tool to check whether the visitor’s eye path matches your intended hierarchy.
Expected bounce reduction: 4 –10% on pages with cluttered or unclear design.
6. Run A/B tests on high-bounce pages
Target: test one variable at a time to isolate what changes bounce rate.
Identify your single highest-bounce page, form a hypothesis about the cause, and create a variant with a paid tool such as Optimizely, Convert or VWO (Google Optimise is no longer available). Change one element at a time, run the test for two to four weeks until you reach statistical significance, and deploy the variant if it reduces bounce by 3% or more. Then move to the next page.
Expected bounce reduction: 2 –10% per successful test.
7. Align traffic sources with landing page intent
Target: paid and social bounce rates no more than 10 points higher than organic.
Segment bounce rate by traffic source and campaign in GA4, and identify campaigns bouncing 20%+ above your baseline. Review the ad copy against the landing page H1 and the social post visual against the page visual. Where a mismatch exists, create a dedicated landing page that matches the ad, repoint the ad or post to it, and compare bounce before and after. See our nine ways to improve website conversions for the wider conversion picture.
Expected bounce reduction: 5 –15% on paid and social campaigns with poor message match.
When a high bounce rate is not a problem

Not all high bounce rates signal genuine problems. Context determines everything, and understanding when a bounce is intentional helps you avoid wasting effort on non-issues.
Blog posts and informational content
A blog post with a 75–85% bounce rate is often a success, not a failure. A visitor searches for “how to fix a leaky tap”, finds a detailed guide, reads it, and leaves. To distinguish good bounce from bad, look at time on page and scroll depth: if visitors spend two or more minutes on the page and scroll to 80%+ of the content, they are consuming the article; if they spend 15 seconds and scroll 10%, the content is not relevant, or the page is broken.
Reference and definition pages
A dictionary entry, FAQ answer, or single-question answer page might intentionally bounce at 80–90%. The visitor found their answer and had no reason to explore further. Measure success by pageviews per visitor and return-visitor rate, not bounce rate.
Organic search traffic with high dwell time
Visitors arriving via organic search on informational keywords often bounce intentionally. They are information-seekers, not customers. If GA4 shows high engagement alongside the bounce, the bounce is healthy and reflects satisfied users finding what they need.
Turn these numbers into growth
If your analytics show bounce and engagement problems but you are not sure which fix to prioritise, our SEO and performance team can audit your site, set up GA4 tracking properly, and build a prioritised testing roadmap.