
| AI Summary This guide explains how data driven SEO works in practice: how to set up reliable tracking in Google Search Console and GA4, how attribution works in GA4, and how to connect SEO results to revenue. It also shows what smaller sites can measure first. |
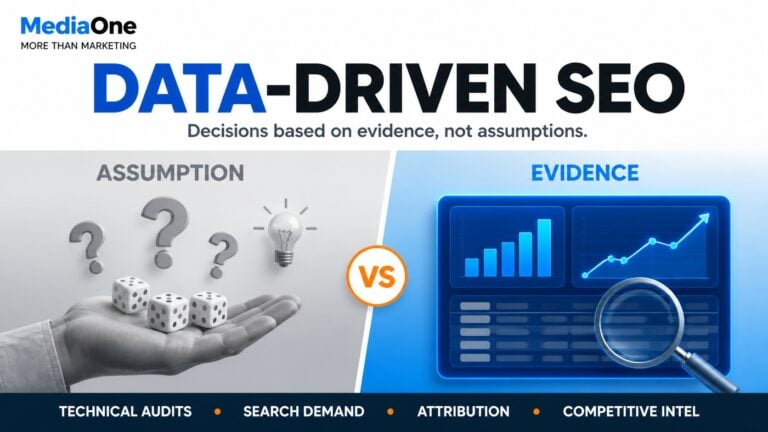
Data-driven SEO means making decisions based on empirical evidence rather than intuition or industry convention. It is the disciplined practice of measuring your technical health, search demand, content performance and competitive position before acting, then validating that your work produces the outcomes you expect.

Most SEO teams still operate on best-practice assumptions: longer content ranks better, links are the currency of rankings, page speed matters. These observations are statistically true across the web in aggregate. But they may not apply to your niche, audience or business model. Data-driven SEO closes that gap. It replaces “this is how SEO usually works” with “this is how SEO works for us, measured against our actual competitors and search behaviour.”
The difference surfaces within one quarter. Teams that invest two to three weeks upfront in tracking setup and baseline measurement see measurable performance improvements accumulate over time faster than agencies cycling through the same tactical checklist for every client. Measurement replaces assumption. You know which keywords drive revenue, which pages leak search-qualified traffic, and why your backlink profile is losing ground to competitors who seem less optimised than you.
Key Takeaways
- Data-driven SEO grounds decisions in empirical evidence, not intuition or best-practice assumption. It connects SEO work directly to business revenue, not just rankings or traffic.
- The four pillars are technical audits, search demand research, conversion attribution and competitive intelligence. Most organisations skip at least two of these.
- Setting up accurate tracking takes two to four weeks. Actionable patterns emerge within twelve weeks. Performance improvements accelerate from month four onward.
- Data-driven SEO avoids three critical pitfalls: confusing correlation with causation, survivorship bias in competitor analysis, and data quality errors that invalidate months of work.
- Even sites with 50-100 organic visits per month can apply these principles. Start with leading indicators such as crawl health, link growth and topical coverage, then layer in revenue metrics as traffic grows.
What Data-Driven SEO Actually Is
Data-driven SEO means making decisions on evidence, not intuition. Every tactic, from the URL structure of a new page to the anchor text in an internal link, rests on measurable facts: search volume data, conversion rates from actual visitors, crawl logs showing how Google indexes your site, and ranking changes tied to specific changes you made.
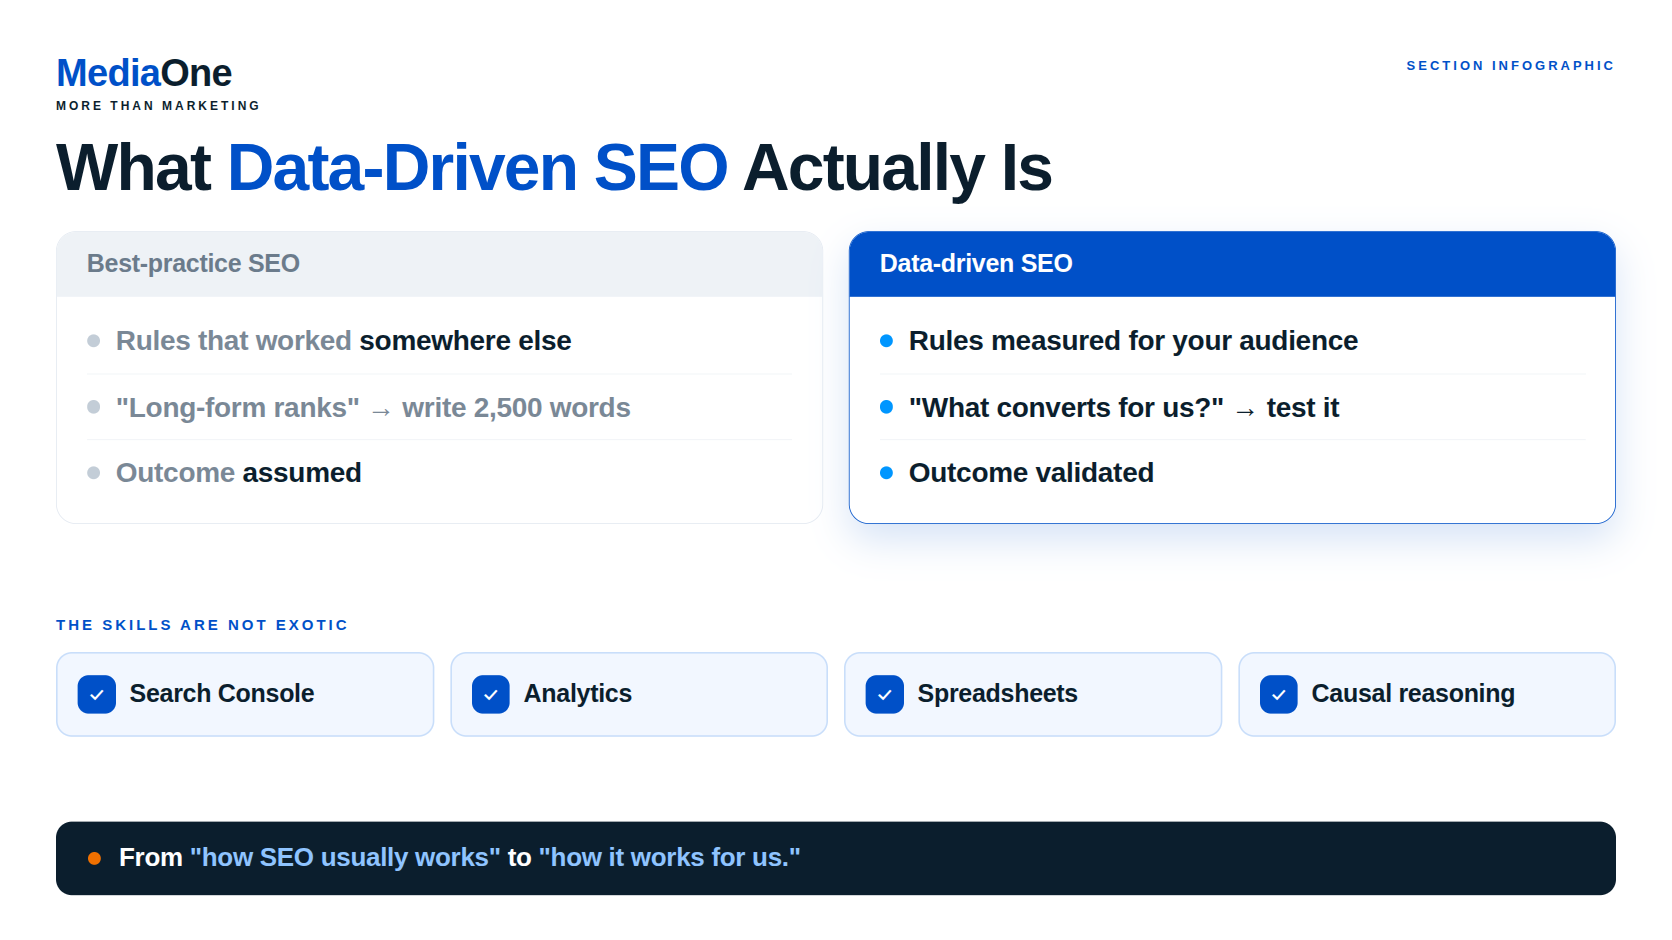
This is not the same as traditional best-practice SEO. Best-practice SEO applies general rules because they worked for someone else’s site in a different industry. Data-driven SEO is specific to your business, your audience and your market.
The distinction matters operationally. A best-practice consultant might recommend a 2,500-word guide because long-form content ranks. A data-driven SEO team asks: “What word count delivers the highest conversion rate for our audience on this topic?” They write to that threshold, measure the outcome and adjust next time.
Data literacy now separates performing teams from commodity agencies. The skills required are not exotic: proficiency in Google Search Console, Google Analytics, basic spreadsheet analysis and logical reasoning about cause and effect. Many SEO practitioners lack proficiency in reading crawl logs, spotting redirect chains and calculating cost-per-acquisition by landing page.
How Data-Driven SEO Differs from Conventional Approaches
Conventional SEO measures performance at a few discrete points. A team runs an annual technical audit, analyses competitor rankings once or twice yearly and tracks overall traffic monthly. The gaps between measurements hide what actually moves rankings and conversions.
Data-driven SEO measures continuously:
- Crawl efficiency this week versus last week
- When a content update moves a keyword from position 15 to position 8
- Which landing-page patterns convert visitors versus which do not
- Real-time changes to your competitive position
You measure weekly, not once a year. This shift changes the quality of decisions you make.
When you wait six months to analyse performance, you cannot isolate whether a ranking change came from a page update, a competitor’s site going down, a Core Web Vitals improvement or an algorithm update. When you measure weekly, you narrow the variables and connect causation more reliably.
ROI visibility separates data-driven work from guesswork. A conventional SEO report might show “organic traffic grew 12% this quarter.” A data-driven report shows the business value more precisely: “Organic revenue from new content increased by S$5,800 this quarter. The cost of producing that content was S$1,100. This represents a 5.3x return.” This connects SEO activity directly to business outcome.
Early data collection produces measurable competitive advantage. If you start tracking keyword rankings, conversion rates by landing page and crawl efficiency now, you have a baseline. In six months, you have a trend. In twelve months, you have patterns robust enough to forecast. Competitors starting their measurement later will always be further behind in predictive clarity.
Teams with two years of conversion data by content type know which content formats actually convert in their vertical. They avoid copying a competitor’s format without understanding whether their audience responds to it. That specificity, multiplied across fifty decisions per year, produces outsized results.

The Four Pillars of Data-Driven SEO
Data-driven SEO rests on four interconnected foundations. Each pillar generates a different type of signal about your site’s health, your audience’s behaviour and your competitive position. Together, they form the evidence base for every decision you make.
| Pillar | Primary Question | Key Metric | Tool Examples |
|---|---|---|---|
| Technical Audits | Is Google crawling and indexing your site? | Indexation rate, LCP score, crawl efficiency | Google Search Console, PageSpeed Insights, Screaming Frog |
| Search Demand | What does your audience search for, and when? | Search volume, seasonality, intent distribution | Semrush, Ahrefs, Google Trends |
| Performance Analytics | Did your changes drive business results? | Conversion rate by landing-page cluster, organic revenue | GA4, Littledata (for Shopify), customer-relationship-management integration |
| Competitive Intelligence | Where are you winning and losing visibility? | Share-of-voice, keyword gap, ranking distribution | Semrush, Ahrefs, SE Ranking |
Technical Audits and Crawl Intelligence
Your site can rank only if Google can find, crawl and understand it. Technical audits measure whether that is happening.
Log-file analysis reveals the truth about crawl behaviour. The Google Search Central documentation explains how to verify Googlebot, but server logs show you exactly which pages the crawler visited, how long it stayed, which resources it requested and which it skipped.
A page may appear in Google Search Console. But it might never be fully crawled. This happens if CSS or JavaScript files are blocked. Log analysis exposes crawl waste. Googlebot spends budget on duplicate pages, old parameter combinations or redirect chains instead of your core content.
Crawl budgets matter most on large sites. Google’s crawler can only visit so many pages per day. That limit is your crawl budget. If your site wastes that budget on low-value pages, high-value pages rank lower.
Tools like Botify and Screaming Frog measure crawl efficiency. They compare the number of pages crawled to the number that should be crawled. A site with 50,000 URLs but only 5,000 crawled per week has a serious efficiency problem.
Indexation rates are the bottleneck most teams miss. You might have 10,000 pages on your site but only 7,000 in Google’s index. The gap is your opportunity cost. Google Search Console reports this under Coverage. It shows you which pages are indexed, which are excluded and why (blocked by robots.txt, marked as noindex, duplicate, soft 404, or crawled but not indexed). A page that Google cannot index cannot rank.
Core Web Vitals directly influence rankings and user experience. The three metrics are:
- Largest Contentful Paint (LCP): How fast the main content loads. Target: under 2.5 seconds.
- Interaction to Next Paint (INP): How quickly the page responds to user interaction. This metric replaced First Input Delay in March 2024. Target: under 200 milliseconds.
- Cumulative Layout Shift (CLS): How much the layout jumps around whilst loading. Target: under 0.1.
For reference, consult Google’s Web Vitals guide for the latest thresholds and measurement methods.
For Singapore-hosted sites, monitor CrUX (Chrome User Experience Report) data from your Google Search Console, not just Lighthouse lab scores. Real-user data reflects actual network conditions and device capabilities across your visitor base. A page might score 90 in Lighthouse but fail Core Web Vitals in the field if your users are on 4G or older devices.
Diagnostic checklist for crawl health:
- Run a full-site crawl using Screaming Frog (free tier up to 500 URLs) or Botify. Check for broken links (4xx, 5xx responses), redirect chains (three or more hops), slow pages (over five seconds), and missing titles or meta descriptions.
- Pull your indexation report from the GSC Coverage tab. Note the excluded count. Click “Not selected” or “Crawled not indexed” and review 10 samples to understand why.
- Download your server logs (last 30 days) and filter for Googlebot user agent. Count requests per day. Crawl rates vary by server response time and site size.
- Test Core Web Vitals using PageSpeed Insights on your top 20 landing pages. Note which metric is slowest. Check whether the issue is common across pages (site-wide) or isolated (page-specific).
- Check robots.txt and your site-wide noindex rules. Ensure you are not blocking CSS, JavaScript or image files that affect page rendering.
A well-audited site shows these characteristics: indexation rate typically above 90 per cent, average crawl response time under 500 milliseconds, no redirect chains, and all Core Web Vitals passing on mobile.
Search Demand Research and Query Mapping
Keyword tools report search volume, but they do not tell you the full story. Volume estimates vary by tool. Semrush, Ahrefs and Moz often report different figures. Seasonality, geography and intent all shift demand.
Search volume variance by region and time is material. “SEO agency” has different search patterns in Singapore versus the UK or Australia. In Singapore, the term peaks in Q1 and Q3 as businesses plan campaigns. In Australia, volume is flatter year-round but spikes around budget cycles (July and November). If you target multiple regions, you need region-specific keyword clusters. Relying on global averages misses local windows of high demand.
Seasonal volatility compounds this. “Summer holiday ideas” has zero value in January and massive value in May-June. Launching a page in February means waiting five months for demand. Building an editorial calendar around seasonality ensures content goes live when search volume peaks.
Intent classification separates keyword research from strategy. The Google Search Essentials guidance treats user intent as a core ranking consideration. Every query falls into one or more of three intent categories:
- Informational: “How does SEO work?”, “Best SEO tools 2024”. The searcher wants education or comparison. Monetisation is indirect (builds trust for later purchase) or zero.
- Transactional: “Buy SEO software”, “Hire SEO agency Singapore“. The searcher intends to spend money now. Monetisation is direct.
- Navigational: “Semrush login”, “Moz SEO tool”. The searcher wants to reach a specific site or brand.
Mixing intent in a single page dilutes ROI. A page that tries to answer “what is SEO” and “hire an SEO agency” satisfies neither intent well. Map keywords to intent. Cluster keywords with the same intent together. Transactional pages should get more internal links and conversion optimisation effort. Informational pages should get breadth and depth to establish topic authority.
Keyword clustering reveals gaps in your topic coverage. Instead of treating each keyword as a separate ranking target, group keywords by topic. A cluster around “Technical SEO” might include: technical SEO audit, Core Web Vitals, site speed optimisation, XML sitemaps, robots.txt rules, canonicalisation and crawl budget.
Once clustered, audit your existing content against each cluster. Do you have a page covering the core topic? Does it mention all the subtopics searchers ask about? If your technical SEO page ignores crawl budget or robots.txt, you are leaving ranking opportunities on the table. Pages that address multiple angles of the same topic build topical authority faster.
Performance Analytics and Attribution
Measurement replaces assumption. Most teams use last-click attribution, which assigns 100 per cent credit to the final touchpoint before conversion. This breaks down for SEO because organic traffic often plays a supporting role in longer decision journeys.
Setting up accurate conversion tracking starts in Google Analytics 4. Create an event for your most valuable action: purchase, demo request, newsletter signup or contact form submission. Track the event source. Filter out internal traffic (your own IP addresses, your team’s devices). Export historical data from Universal Analytics so you can compare trends across your migration date.
Verify your tracking works by testing yourself. Complete a conversion flow from organic search, then check GA4 to confirm the event recorded. Off-by-one errors (events firing twice) or missing data (events not firing at all) are common and invisible until you check.
Multi-touch attribution models distribute credit across the customer journey, not just the final click. Here are three models:
- First-touch: Credits the first channel that brought the visitor. Useful for measuring awareness and top-of-funnel effectiveness. Organic often gets high credit because people search to discover brands.
- Linear: Splits credit equally across all touchpoints. Fair but uninformative; every channel looks equally important.
- Time-decay: Weights the final touchpoints more heavily. Assumes the most recent interaction influenced the decision most. Common in e-commerce but overstates the importance of retargeting.
For SEO, use first-touch attribution alongside conversion-attributed model (GA4’s standard) to answer two questions. Did organic bring people in? (first-touch answer). Did organic close them? (conversion-attributed answer). If first-touch is high but conversion-attributed is low, organic drives awareness but does not close sales. That signals a content or landing-page problem, not an SEO problem.
Establish baseline metrics before optimisation. Run a crawl audit and record: indexation rate, Core Web Vitals score, number of pages ranking in top 100. Record your GA4 conversion counts for the last 30 days. Document your top 20 keywords and their current rankings. These become your control group. After you make changes, you can isolate their impact against the baseline.
Measurable performance improvements accumulate over time. Baseline measurement happens in week one. Within 12 weeks, actionable patterns emerge. From month four onward, performance gains compound as your site authority builds.
Competitive and Market Intelligence
Benchmarking against competitors tells you where to invest effort. Analysing what top-ranking pages cover tells you what Google rewards.
Benchmarking against SERP leaders, not industry averages, is critical. If your competitors rank for “SEO services” but you do not, learn why. Pull the top 10 ranking pages and score them on: word count, topical depth (how many subtopics covered), number of internal links, estimated backlink count, page speed and presence of structured data.
Look for patterns, not single examples. If all 10 pages are over 3,000 words, word count likely matters. If eight of 10 have 50+ referring domains, backlink authority is probably required. If only three mention your topic, one-time mentions do not matter. Use tools like Semrush or Ahrefs to pull this data at scale.
Share-of-voice analysis measures your visibility relative to competitors across high-value keywords. Calculate it as: (your branded plus category keywords you rank for) divided by (all branded plus category keywords) multiplied by 100.
Example: if your target keywords are “SEO agency Singapore”, “technical SEO”, “link building”, “on-page SEO” and “SEO tools”, and you rank top 10 for three of them, your share-of-voice is 60 per cent. A competitor who ranks top 10 for four has 80 per cent. This gap is actionable: you know which keywords are your biggest opportunity areas.
Identifying white-space opportunities is where competitive intelligence pays off. Use a keyword gap tool (available in Semrush, Ahrefs or Moz). Filter for keywords your competitors rank for in top 10 but you do not rank for at all. Add a second filter: search volume over 100 and difficulty under 40. These are low-hanging fruit.
For example, you might discover your top competitor ranks for “SEO automation tools” and “SEO reporting software” but your site has no pages on those topics. If search volume is 500 or more monthly and difficulty is moderate, that is a high-ROI content opportunity.
Building Your Data Infrastructure
Data-driven SEO breaks down the moment your tools stop talking to each other. A ranking in Google Search Console that you cannot connect to actual revenue. A spike in GA4 conversions you cannot attribute to keyword work. A crawl report that contradicts your search visibility.
[IMAGE: A sample Google Search Console dashboard showing impressions, clicks, average position and click-through rate trends across a three-month period, with filters applied for specific landing-page clusters or query types.]
The infrastructure you build now determines what you can measure, learn and act on over the next 12 months. Many teams skip this step because it feels tedious. That mistake costs them months of blindness.
Essential Tools and Data Sources
Google Search Console and Google Analytics 4: what they do and do not tell you.
Google Search Console (GSC) shows you what Google sees: impressions (queries where you appeared in search results), clicks (users who visited from search) and your average position. It does not tell you what happened after the click. It does not tell you revenue, conversions, or whether the click came from someone searching for your product or someone researching competitors.
Google Analytics 4 (GA4) shows what happened on your website: session duration, pages visited, events fired and transactions completed. It does not automatically know which traffic came from organic search if your UTM setup is broken. It cannot tell you why a page stopped ranking without external tools.
GSC and GA4 are the foundation together. Neither is sufficient alone.
The crawl tool landscape: what you are actually buying.
A crawl tool mimics how Google’s bots see your website. It discovers which pages exist, which ones are blocked, which have broken links, and how fast they load. The output guides your technical roadmap.
| Tool | Best for | Key strength | Limitation |
|---|---|---|---|
| Screaming Frog (free tier) | Sites under 500 URLs, quick diagnostics | Transparent output, no per-URL costs | Limited to 500 URLs unpaid; no scheduling |
| Botify | Large enterprise sites with 10,000+ URLs, log-file analysis | Crawl-efficiency scoring, bot-traffic patterns | Expensive; overkill for small sites |
| Semrush Site Audit | Balanced feature set, integrated keyword data | Combines crawl and keyword metrics; easy learning curve | Data quality lags specialist tools; pricing per site |

For a small-to-medium business, start with Screaming Frog’s free tier. When you exceed 500 pages or need scheduled monitoring, migrate to Semrush or Botify depending on your technical depth.
Third-party intent and keyword-difficulty tools: what each layer adds.
Keyword tools such as Ahrefs, Semrush and Moz aggregate search volume, show keyword difficulty scores, and reveal how many backlinks top-ranking pages have. They do not show real searcher intent with 100% accuracy. Volume data is estimated, not actual. Difficulty scores are correlation-based assessments, not causation.
What they do well: identifying keyword clusters, spotting seasonal patterns, and revealing competitor keyword rankings. Use them to validate whether demand exists for a topic before writing. Do not use difficulty scores alone to reject a keyword opportunity; examine the actual search results first.
Intent-classification tools map keywords to transactional (ready to buy), informational (learning) or navigational (brand-specific) intent. This matters because ranking for “how to choose an SEO agency” is only valuable if some of those searchers become paying customers. Cross-reference intent classification with your own conversion data to confirm.
Spreadsheet architecture for consolidating disparate signals.
Your tools will never share data perfectly. GSC will not export crawl errors into GA4. Ahrefs will not pull your actual conversion data. You need a single place where all signals live together.
Build a monthly data export workflow:
- Export GSC performance data by landing page (queries, clicks, impressions, position).
- Export GA4 organic traffic, conversions and revenue by landing page.
- Export crawl health summary: crawl errors, indexation rate, page-load speed.
- Export keyword rankings from your preferred rank tracker by target keyword.
- Combine all four into a single spreadsheet with a unique landing-page identifier (the full URL path).
Use VLOOKUP or INDEX/MATCH formulas to join these tables. This single view reveals patterns: pages with high clicks but low conversions (title or meta issue, or wrong intent match); pages with good rankings but no clicks (title needs testing); pages with crawl errors blocking indexation (technical fix required).
You now have a monthly diagnostic dashboard. Update it on the same date each month. Version it so you have historical snapshots to compare.
Setting Up Tracking That Survives Platform Changes
Platform changes happen. Google deprecates features. Privacy regulations shift. If your data strategy depends on one tool staying the same forever, you will lose continuity when that tool changes.
Event tracking in GA4 that captures organic-specific actions.
GA4’s default setup tells you when someone landed on your site from organic search. It does not tell you what they did next if you do not configure events.
Set up these organic-specific events in Google Tag Manager:
- Scroll depth (user read past 50%, 75%, 100% of the page): identifies whether content engages readers enough to satisfy their search intent.
- Call-to-action clicks (newsletter signup, product add-to-cart, contact form start): tracks intent-to-convert signals before a transaction occurs.
- Video plays (if your content includes video): indicates engagement depth for learning-focused queries.
- PDF downloads (product guides, whitepapers): marks intent signals for business-to-business audiences.
- Search-box usage on-site (if your site has internal search): shows when organic traffic landed on the wrong page and is searching for what they came for, a sign your internal linking needs work.
Tag each event with a parameter identifying the query or keyword topic that brought the user, if possible. This gives you the causal link: this keyword brought this type of user, and they completed this action.
Test each event in GA4’s real-time report before declaring it live. Many setups fire events inconsistently due to Google Tag Manager container delays or tag-firing order.
UTM discipline and naming conventions for organic channels.
UTM parameters override GA4’s default source or medium classification. If your organic links carry UTM parameters, GA4 will tag them with whatever you specify. If your URLs carry conflicting or misspelled parameters, you fragment your organic traffic across multiple GA4 sessions.
Standard naming for organic UTM tagging (apply to internal links, shared links and links in newsletters):
- utm_source = google (or the specific organic source)
- utm_medium = organic (always)
- utm_campaign = your topic cluster or content pillar (for example, “seo-foundations” or “ecommerce-platforms”)
- utm_content = specific page title or intent (optional, for testing different versions)
Example: https://yoursite.com/article?utm_source=google&utm_medium=organic&utm_campaign=seo-foundations&utm_content=homepage-cta
Enforce this naming convention across your team. Document it in a shared wiki or internal guide. Inconsistent tagging creates data noise that makes month-over-month comparison impossible.
Each pillar informs the others. Technical audits reveal which pages can be optimised for demand. Search demand research tells you which pages to build. Performance analytics tell you which changes worked. Competitive intelligence tells you which gaps are worth filling. Measurement replaces assumption.
Frequently Asked Questions
What does data-driven SEO cost?
Tracking setup costs between S$2,000 and S$8,000 in agency time, or four to eight weeks of internal resources. Ongoing monitoring costs S$300 to S$1,500 monthly for tools. This cost pays for itself within two to three months when you identify and fix your highest-leverage SEO problems.
Is data-driven SEO only for large organisations?
No. Even sites with 50-100 organic visits monthly can apply these principles. Start with leading indicators such as crawl health, link growth and topical coverage. Layer in revenue metrics as traffic grows.
Do I need expensive tools like Semrush or Ahrefs?
You can start with free tools: Google Search Console, Google Analytics 4, Google Sheets for analysis. Paid tools accelerate competitor research and keyword analysis. Begin free, then invest in tools that specifically answer your business questions.
What is the difference between correlation and causation in SEO data?
Correlation means two things move together. A page might rank better at the same time you add more backlinks. That does not prove the backlinks caused the ranking improvement. Other factors such as algorithmic shifts or competitor changes may explain it. Causation requires isolating variables, which is why continuous measurement matters more than annual audits.
How do I know if my data is accurate?
Check for data quality issues regularly: filter out bot traffic, verify timezones are correct, confirm conversion events fire only when they should, and audit UTM parameter consistency. A single misconfigurations can silently invalidate months of analysis.
What if my conversion rates are too low to measure meaningfully?
Use leading indicators first. Measure crawl health, keyword ranking movement, backlink growth and content coverage. These predict revenue growth before it materializes. Once you have sufficient conversion volume, layer attribution on top.

How long before I see results from data-driven SEO?
Baseline measurement takes one to two weeks. Early patterns emerge within twelve weeks. Statistically robust trends require three to six months. Competitive advantage compounds over twelve months or longer.
Can I use spreadsheets instead of a dedicated platform?
Yes, for small sites. Use Google Sheets to log weekly metrics: rankings, crawl data, conversion rates. Document your calculations so changes do not break your analysis. Spreadsheets scale up to about 5,000-10,000 rows before performance degrades.
What is a common misconception about data-driven SEO?
Many believe that gathering more data automatically improves decisions. In reality, noise increases with data volume. Focus on a small set of metrics that directly reflect your business outcome. Measure them consistently. Ignore vanity metrics such as total impressions or ranking position without conversion context.
How do I choose between different attribution models?
First-click attribution credits the first traffic source a customer touched. Last-click credits the final source before conversion. Multi-touch models split credit across all sources. Choose based on your business: first-click for awareness campaigns, last-click for conversion optimisation, multi-touch for understanding the full customer journey. Document your choice so stakeholders understand what the data represents.
What happens if a platform like Google Search Console changes its API or reporting?
This is why you track data yourself. Store your own logs of rankings, crawl data and conversion events. When a platform changes, your historical data remains intact. You can connect your own data to new platforms without losing context.