

| AI Summary
Website page speed affects user experience, SEO and conversions. Learn how to measure Core Web Vitals, identify performance issues and improve loading speed using PageSpeed Insights, image optimisation, caching and other practical fixes for Singapore websites in 2026. |
Website page speed affects how quickly visitors can see content and use your website. To identify problems, start with Google PageSpeed Insights. Check real-user Core Web Vitals, locate the slowest page template and investigate the failing metric before making changes.


For Singapore businesses, we recommend testing mobile and desktop performance separately. This guide explains how to measure results and prioritise fixes.
Key Takeaways
- Measure real-user experience first. Check Largest Contentful Paint (LCP), Interaction to Next Paint (INP) and Cumulative Layout Shift (CLS).
- Diagnose before optimising. A slow server, late-loading image and unresponsive button require different solutions.
- Prioritise shared templates. Fixes to a common product, service or article template can improve many pages.
- Verify improvements twice. Use repeatable lab tests immediately, then review fresh field data as it accumulates.
What Is Website Page Speed, and Why Does It Matter?
Website page speed describes how quickly a page displays useful content and responds to visitors. It is not one universal number. A page can display its main image quickly but remain difficult to use because scripts delay button responses.
Page load time often refers to a browser loading milestone, such as the load event. It does not prove when useful content appeared or whether the page responds promptly. We evaluate several measurements instead.
Page speed and visitor experience
People expect to find information without waiting through blank screens or moving layouts. Delays can interrupt product research, appointment bookings and contact-form submissions. We recommend comparing engagement and conversion data before and after technical changes.
For a Singapore ecommerce site, the priority might be a product page’s main image and add-to-cart button. A service business may need its landing-page heading and enquiry form to become usable quickly. Both should test beyond the homepage.
Does website page speed affect SEO?
Google confirms that its ranking systems use Core Web Vitals, but there is no single overall page-experience ranking signal. Google’s page experience guidance also explains that good scores do not guarantee higher rankings. Search relevance and helpful content remain essential.
Server performance can affect crawling, particularly on large or rapidly changing websites. Google’s crawl budget documentation explains that slow responses or server errors can reduce crawl capacity. Smaller sites with prompt indexing rarely need a dedicated crawl-budget project.
Core Web Vitals: The Website Page Speed Benchmarks
Google’s Core Web Vitals measure loading performance, responsiveness and visual stability. They are assessed using the 75th percentile of real-user visits, with mobile and desktop evaluated separately. Google’s official thresholds are:

| Metric | Good | Needs improvement | Poor |
| Largest Contentful Paint (LCP) | 2.5 seconds or less | Over 2.5 to 4 seconds | Over 4 seconds |
| Interaction to Next Paint (INP) | 200 milliseconds or less | Over 200 to 500 milliseconds | Over 500 milliseconds |
| Cumulative Layout Shift (CLS) | 0.1 or less | Over 0.1 to 0.25 | Over 0.25 |
All three must meet their good thresholds for a passing Core Web Vitals assessment where sufficient field data exists. The thresholds are not different for homepages, product pages or articles, though their causes may differ.
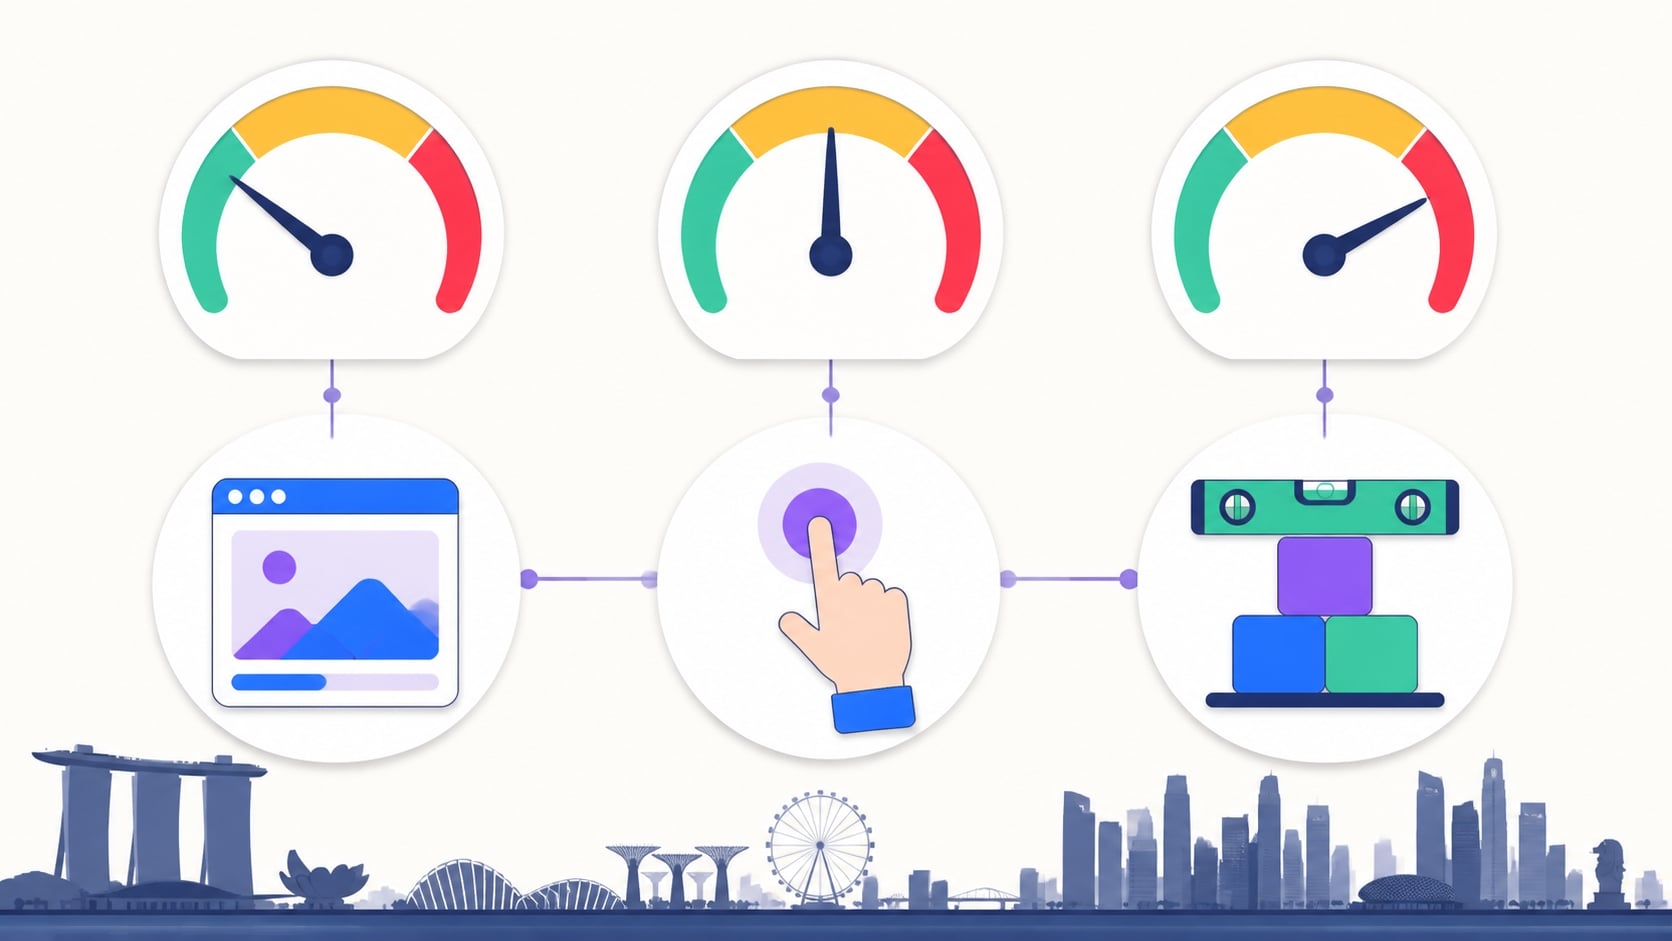
Largest Contentful Paint (LCP): When does main content appear?
LCP measures when the largest eligible visible image, text block or other content element finishes rendering. Poor LCP can result from slow initial responses, delayed image discovery, oversized resources or rendering blocked by code.
We recommend identifying the actual LCP element in a Lighthouse trace before compressing images. The element may be a heading rather than a hero image. Compressing an unrelated image may achieve little.
Interaction to Next Paint (INP): How responsive is the page?
INP evaluates the responsiveness of a page to qualifying clicks, taps and keyboard interactions throughout a visit. It captures input delay, processing and the time until the next visual update. INP replaced First Input Delay (FID) in March 2024.
A page may look fully loaded yet respond slowly to a menu tap. Third-party tags, heavy JavaScript and expensive event handlers are common causes. Google’s INP optimisation guide explains how to investigate these delays.
Cumulative Layout Shift (CLS): Does content move unexpectedly?

CLS measures unexpected shifts in visible content. Images without reserved space, dynamically inserted banners and web-font changes can push text or buttons from their original positions. This creates a frustrating experience, especially when someone is trying to tap a control.
CLS is unitless. Google’s CLS guidance recommends defining image dimensions and reserving space for ads and embedded elements before they load.
Time to First Byte is useful but not a Core Web Vital
Time to First Byte (TTFB) measures the time from a navigation request until the browser receives the first byte of the response. As a rough diagnostic guide, web.dev recommends 0.8 seconds or less as good, more than 0.8 to 1.8 seconds as needing improvement, and more than 1.8 seconds as poor.

TTFB is not a Core Web Vital, and 200 milliseconds is not a universal requirement. Improving it may help LCP but will not fix unrelated JavaScript or layout issues.
How to Measure Website Page Speed
Start with representative pages, not just your homepage. We would test one high-traffic article, service page, product page and conversion page where applicable. Record the mobile and desktop results separately so improvements can be compared accurately.

1. Check PageSpeed Insights and real-user field data
Open PageSpeed Insights, enter the full page URL and run the report. Inspect the real-user experience section first. It uses data from the Chrome User Experience Report (CrUX) over the previous 28-day period.
Check whether data represents the URL or the whole origin. Low-traffic pages may lack sufficient Chrome data. If field data is unavailable, use lab diagnostics or collect your own real-user metrics.
Next, read the Lighthouse diagnostics below the field section. These reveal loading and JavaScript issues. Google’s PageSpeed Insights documentation explains the distinction between field data and simulated lab results.
2. Compare PageSpeed Insights, Lighthouse, GTmetrix and WebPageTest
Each tool answers a different question. We recommend combining real-user measurements with controlled tests instead of treating their scores as interchangeable.
| Tool | Data and main strengths | Best use |
| PageSpeed Insights | CrUX field data, when available, plus Lighthouse lab diagnostics | Checking real-user Core Web Vitals and identifying potential issues |
| Lighthouse | Controlled lab audits through Chrome DevTools and other environments | Debugging a page or testing changes before release |
| GTmetrix | Synthetic performance tests, request waterfalls and monitoring options | Inspecting resource sizes, request timing and repeated test trends |
| WebPageTest | Browser-based tests, request waterfalls and configurable test conditions | Investigating loading sequences and comparing controlled runs |
GTmetrix pricing: Its published pricing page lists paid plans with different test limits and locations. A free sign-up option is also advertised, but we would not rely on a fixed free-plan allowance without checking the current account terms.
WebPageTest access: The service offers public tests and paid capabilities. Confirm your available locations and quotas before scheduling audits.
3. Read results in the correct order
First, identify which field metric is failing and whether the problem is mainly on mobile. Then review the matching lab diagnostic. For slow LCP, inspect the LCP element and network waterfall; for poor INP, investigate interaction-related main-thread activity; for high CLS, identify the elements causing shifts.
Lighthouse’s Performance score ranges from 0 to 100. Google labels scores of 90 and above as good in that lab assessment, but a score of 90 does not guarantee passing field metrics. A poor lab score also does not describe every visitor.
Use repeatable runs to validate changes immediately. Field data takes time to reflect the new experience because CrUX uses a rolling 28-day window. Search Console’s Core Web Vitals report can then help you monitor groups of affected URLs.
What Causes a Website to Load Slowly?
A slow website is usually the result of several interacting factors. We recommend matching the symptom to the technical cause before choosing an optimisation tactic. This avoids unnecessary work.
Slow hosting, database queries and server responses
A server can delay the entire page when it must process expensive database queries or generate uncached content. Network distance and connection overhead also affect delivery time. A Singapore data centre or nearby content delivery network (CDN) may help local audiences, but the measurable benefit depends on the original hosting setup.
Inspect TTFB during both cached and uncached requests. If it is persistently high, investigate server processing and caching before purchasing a new hosting plan. A CDN cannot repair a slow database query by itself.
Heavy images and poorly prioritised resources
Large image files require longer transfers, especially on constrained mobile connections. However, file size is only part of the LCP problem. An image discovered late through JavaScript or a stylesheet can remain delayed even after compression.
Use responsive image sources and modern formats such as WebP or AVIF when appropriate. Prioritise the real LCP resource and avoid lazy-loading it. Google’s LCP optimisation guide discusses resource discovery, download time and rendering delay separately.
Render-blocking CSS and excessive JavaScript
Critical stylesheets can delay the first render, while synchronous scripts may interrupt HTML parsing. JavaScript can also occupy the main thread after the page appears, delaying interactions. Large bundles and code loaded on pages that never use it deserve attention.
Remove unused code before changing loading rules. Test script order carefully to protect menus, forms and tracking.
Chat widgets, advertising scripts, consent tools and video embeds can add network requests or main-thread work. Fonts may also affect rendering and layout stability. These resources deserve a separate audit because they are often managed by marketing teams rather than developers.
Review every tag against its business purpose. Delay non-essential functionality when appropriate, but ensure consent, accessibility and analytics requirements continue to work as intended.
Quick diagnosis: match the symptom to the fix
| Symptom | Likely cause | First investigation |
| Main content appears late; LCP is poor | Slow TTFB, delayed LCP resource or render blocking | Inspect the LCP breakdown and waterfall |
| Buttons feel unresponsive; INP is poor | Long main-thread tasks or expensive handlers | Profile interactions in Chrome DevTools |
| Images or buttons jump; CLS is high | Missing dimensions, late banners or font swaps | Inspect layout shifts and reserve space |
| Repeat visits still download large assets | Weak browser caching or uncompressed responses | Check response headers and transferred bytes |
How to Improve Website Page Speed: Eight Prioritised Fixes
The most valuable fix depends on the failing metric. We would begin with a shared problem affecting important landing pages, then work down to less consequential assets. Use consistent test settings after changes.

1. Optimise images without delaying the LCP element
Identify the largest image on each important page template. Export suitable WebP or AVIF versions, provide responsive dimensions using srcset and sizes where relevant, and compare visual quality at actual display sizes. Choose compression settings according to image quality.
Set width and height or an appropriate CSS aspect ratio to reserve layout space. Lazy-load images that are safely below the initial viewport. Keep the LCP image eagerly loaded and consider fetchpriority=”high” when testing shows it needs greater priority.
2. Improve server response and caching
Check for slow database queries, costly plugins and uncached page generation. Where appropriate, enable server-side page or object caching and configure browser cache headers for versioned static files. Check that personalised content and checkout sessions are not incorrectly cached.
Measure results before upgrading infrastructure. If most delay comes from server processing, a better hosting environment may help; if resources are simply delivered from far away, a CDN may be the more relevant change.
3. Remove unnecessary JavaScript and defer non-critical work
Audit the scripts used by each template. Remove unused libraries and plugins before spending time minifying code that should not load at all. Split larger JavaScript bundles when routes or components do not need the same functions.
Use defer or async where the script’s dependencies and execution order permit it. Break up expensive interaction handlers and unnecessary main-thread work to improve INP. Confirm that navigation, forms and conversion tracking still function.
4. Reduce render-blocking CSS
Identify styles needed for the first visible screen. Remove unused CSS and keep the critical portion small. Non-critical styles can sometimes be loaded later, but the method must preserve a stable, correctly styled page.
Avoid inlining large stylesheets; they increase HTML size and reduce caching benefits. Google’s render-delay recommendations support reducing the critical rendering path selectively.
5. Compress text files and improve asset delivery
Minify production HTML, CSS and JavaScript where useful. Enable Brotli compression, or gzip when Brotli is unavailable, for suitable text responses. Verify the content-encoding header and transferred bytes.
Use long-lived caching for fingerprinted static assets so returning visitors do not download unchanged files repeatedly. Avoid blindly combining every CSS or JavaScript file; modern protocols and caching can make that counterproductive.
6. Prevent layout shifts from images, ads and fonts
Give images, videos and embedded widgets defined dimensions or reserved aspect ratios. Allocate sufficient space for advertisements and consent banners before they appear. Avoid injecting new content above text someone may already be reading.
For fonts, select sensible fallbacks and review how font swapping changes text dimensions. Test with real content lengths and mobile breakpoints. Reducing CLS should improve reading stability even when download time stays unchanged.
7. Audit third-party tools and mobile performance
Check whether every chat widget, social embed, analytics tag and advertising script is still needed. Use a tag inventory to identify owners and business purposes. Loading fewer unnecessary resources can benefit both LCP and INP.
Test on lower-powered phones and realistically constrained connections. Fast desktop results can hide mobile problems. Test on representative Singapore network conditions.
8. Validate fixes and monitor important page templates
Run controlled before-and-after tests under matching conditions. Log the date, page template, metric, change made and immediate lab result. Avoid attributing an improvement to one fix if multiple changes were deployed together.
Review CrUX and Search Console over the following weeks to confirm whether actual visitors benefit. Monitor important conversions alongside the performance metrics, while remembering that traffic mix and campaign changes can also affect business results.
Website Page Speed Audit Checklist
Use this checklist for a first audit, then repeat the process after major website releases. We recommend assigning each issue to an owner and prioritising problems that affect many high-value URLs.
- Select representative mobile and desktop URLs from important page templates.
- Record LCP, INP and CLS from available real-user data.
- Check whether PageSpeed Insights shows URL-level or origin-level data.
- Identify the actual LCP element and inspect its loading sequence.
- Investigate TTFB, server errors and caching when the response is slow.
- Resize or replace oversized images and prevent lazy-loading of the LCP image.
- Reserve space for images, advertisements and embeds.
- Audit unused JavaScript, render-blocking CSS and third-party tags.
- Verify compression, browser caching and key interactions after deployment.
- Re-test under matching lab conditions and review new field data over time.
Frequently Asked Questions
What is a good website page speed score?
A Lighthouse performance score of 90 or above is classified as good for that lab test. For real visitors, we prioritise Core Web Vitals: LCP at or below 2.5 seconds, INP at or below 200 milliseconds and CLS at or below 0.1 at the 75th percentile.
Does website page speed affect Google rankings?
Yes. Google uses Core Web Vitals in its ranking systems, but fast pages are not guaranteed higher positions. Content relevance and overall usefulness still matter.
Why do PageSpeed Insights and GTmetrix show different results?
Their devices, locations, connection settings and test environments may differ. PageSpeed Insights can also display CrUX field data, which represents real visits over a rolling period rather than one synthetic run.
Can I improve page speed without changing hosting providers?
Often, yes. Optimising images, removing unnecessary scripts and enabling caching can improve performance without a hosting migration. If server processing is the main bottleneck, hosting or backend changes may still be necessary.
Should a Singapore website use a CDN?
A CDN can reduce delivery delays for cacheable resources, particularly when visitors are geographically dispersed. We recommend testing its effect on the actual audience before treating it as a required purchase.
How often should I check website page speed?
Test after major theme, plugin, tracking or design changes, and review important templates regularly. Allow time for the 28-day field-data window to reflect deployed improvements.
Fix the Bottleneck That Affects Visitors
Improving website page speed begins with evidence, not a target Lighthouse score. Use PageSpeed Insights to identify failing Core Web Vitals, then investigate the responsible server, resource or interaction problem. Apply the change to affected templates and validate it with repeatable tests and updated field data.

For Singapore businesses managing SEO and conversion performance, we recommend prioritising pages that generate enquiries or sales. If shared technical problems are affecting those pages, our SEO services can help connect performance diagnostics with a broader search strategy.