

| AI Summary
Social media ROI helps Singapore businesses see how much a campaign earned after the costs of selling and marketing. A team can measure it by linking sales to a campaign, subtracting the cost of serving those customers, then comparing what remains with the full campaign cost. A monthly report should show the attribution window, flag estimates and explain what the team plans to change. |
Social media ROI is the financial return on a social media campaign. The formula is [(attributed contribution profit before marketing costs − campaign cost) ÷ campaign cost] × 100. Contribution profit is sales after the direct costs of fulfilling those sales. Campaign cost includes ads, staff time, production and other resources used to run the campaign.
Key Takeaways
- An order report and an ad dashboard can give the same sale credit twice. One set of sales records keeps the total grounded.
- A lead has an estimated value until a customer buys. An estimate can support planning when the report shows how the team calculated it.
- A campaign review needs a decision. The numbers should tell the team whether to keep spending, fix a specific problem or pause.
Two Singapore retailers can each make S$10,000 in sales from an Instagram campaign and walk away with very different results. One might sell full-price products with low delivery costs. The other might rely on discounts and pay more to fulfil each order. Their sales totals look the same. Their returns can be far apart.
Social media ROI makes that difference visible. The steps below show how to measure it for online orders and leads, then turn the result into a budget decision. The examples use illustrative figures in Singapore dollars.
What Social Media ROI Measures
How ROI differs from ROAS
Social media ROI shows how much a campaign earns or loses for every dollar the business puts into running it. A 0% ROI means the campaign broke even on the costs included in the calculation. A negative result means it lost money on that basis. A positive result means it earned more than it cost. The value of measuring advertising ROI is that it connects campaign spending to the money a business keeps.
Return on ad spend, or ROAS, answers a narrower question. It divides the sales credited to ads by the amount spent on those ads. A campaign with S$10,000 in credited sales and S$2,500 in ad spend has a 4× ROAS. That figure helps when comparing ads. The campaign’s ROI also takes account of expenses such as staff time and the cost of fulfilling orders.
The distinction helps during a budget meeting. A campaign may have a high ROAS because it sold plenty of products. If the team relied on heavy discounts or the products cost a lot to deliver, the same campaign could earn less than a smaller one with fewer sales. Both figures can sit in the report if each has its own label.
What engagement can tell you
Likes, shares and comments help a team understand how people respond to a post. A video with plenty of saves might explain a product well. A post with many clicks and few purchases might send people to a page where delivery fees appear too late. These signals give the team a place to investigate.
An Instagram marketing strategy can use these signals to choose which formats to test. The financial review asks a separate question about what customers did after seeing or clicking the content. A post designed for awareness can be assessed on reach and audience response while the team gathers enough evidence to judge sales.
Set a Goal and Choose What to Track
One outcome per campaign
A campaign goal should say what the business wants customers to do, by when and at what cost. A retailer might aim for 100 completed orders during a two-week promotion. A business software company might aim for 60 qualified enquiries in a month at up to S$40 each. Each goal tells the team what to count and when to review the results.
A digital marketing project can include a short measurement plan alongside its budget. One person owns the weekly checks. Another person may confirm orders, refunds or signed deals. A small business can assign both tasks to the same person as long as the checks still happen.
Metrics for sales, leads and bookings
A few key performance indicators, or KPIs, are enough to show where people stop and which actions create value. The main KPI should be the one that guides the next spending decision. Supporting numbers help explain why it moved.
| Campaign goal | Main KPI | Supporting measures |
| Sell products online | Completed orders or contribution profit from those orders | Product page visits, checkout starts and refund rate |
| Generate enquiries | Cost per qualified lead | Form submissions, share of leads that qualify and sales won |
| Fill appointments | Cost per completed appointment | Bookings, cancellations and no-shows |
| Reach new customers | Reach among the intended audience | Video completion, shares and visits to the offer page |
For LinkedIn Ads, the sales team can agree in advance what makes an enquiry qualified. A company might count a lead once sales confirms the prospect serves the right market, has a relevant need and can make or influence a buying decision. That gives the team a consistent basis for comparing one campaign with the next.
A tracking plan before launch
A tracking plan can start with a shared sheet. Each row can show the campaign name, platform, offer, target action, budget and where the team will confirm the result. A campaign run across Instagram and Facebook should have a shared campaign name and a separate source for each platform. The sales team needs the same campaign name if it will enter outcomes by hand.
The plan should also say what counts as a completed action. A click on a booking button is one action. A confirmed booking is another. An attended appointment is a third. A team that wants to measure completed appointments can still track the other steps to see where people drop out. Each step should have a distinct name so the report stays easy to read.
How to Calculate Social Media ROI
Step 1. Work out what the sales contributed
Contribution profit starts with the net sales credited to a campaign. The team then subtracts the costs that came with those orders, such as products, packaging, payment fees and any delivery charges the business covered. Discounts and refunds should be reflected in net sales. A discount already deducted from sales stays out of the cost column.
For a retailer, Shopify profit reports can help identify product costs where the business recorded a cost for the item at the time of sale. The finance or order system can supply other expenses that the report leaves out. A service business can use the direct cost of carrying out the work, such as contractor fees or materials for the job.
Step 2. Count the full campaign cost
Campaign cost covers the work required to run the campaign. A practical cost list includes the items below.
- Ad spend across the social platforms used for the campaign
- Staff time for planning, production, community replies and reporting
- Outside work such as creator fees, agency fees, editing or photography
- Campaign tools such as the share of a scheduling or reporting tool used for the work
A small team can estimate staff cost using hours worked and an hourly rate agreed with finance. A staff member who spends 20 hours on a campaign at S50anhouraddsS1,000 to its cost. If an agency bill already covers editing and design, the team records the bill once. If user-generated content replaces a studio shoot, the team can still record creator payments, permission work and staff editing time where applicable.
Step 3. Calculate the percentage
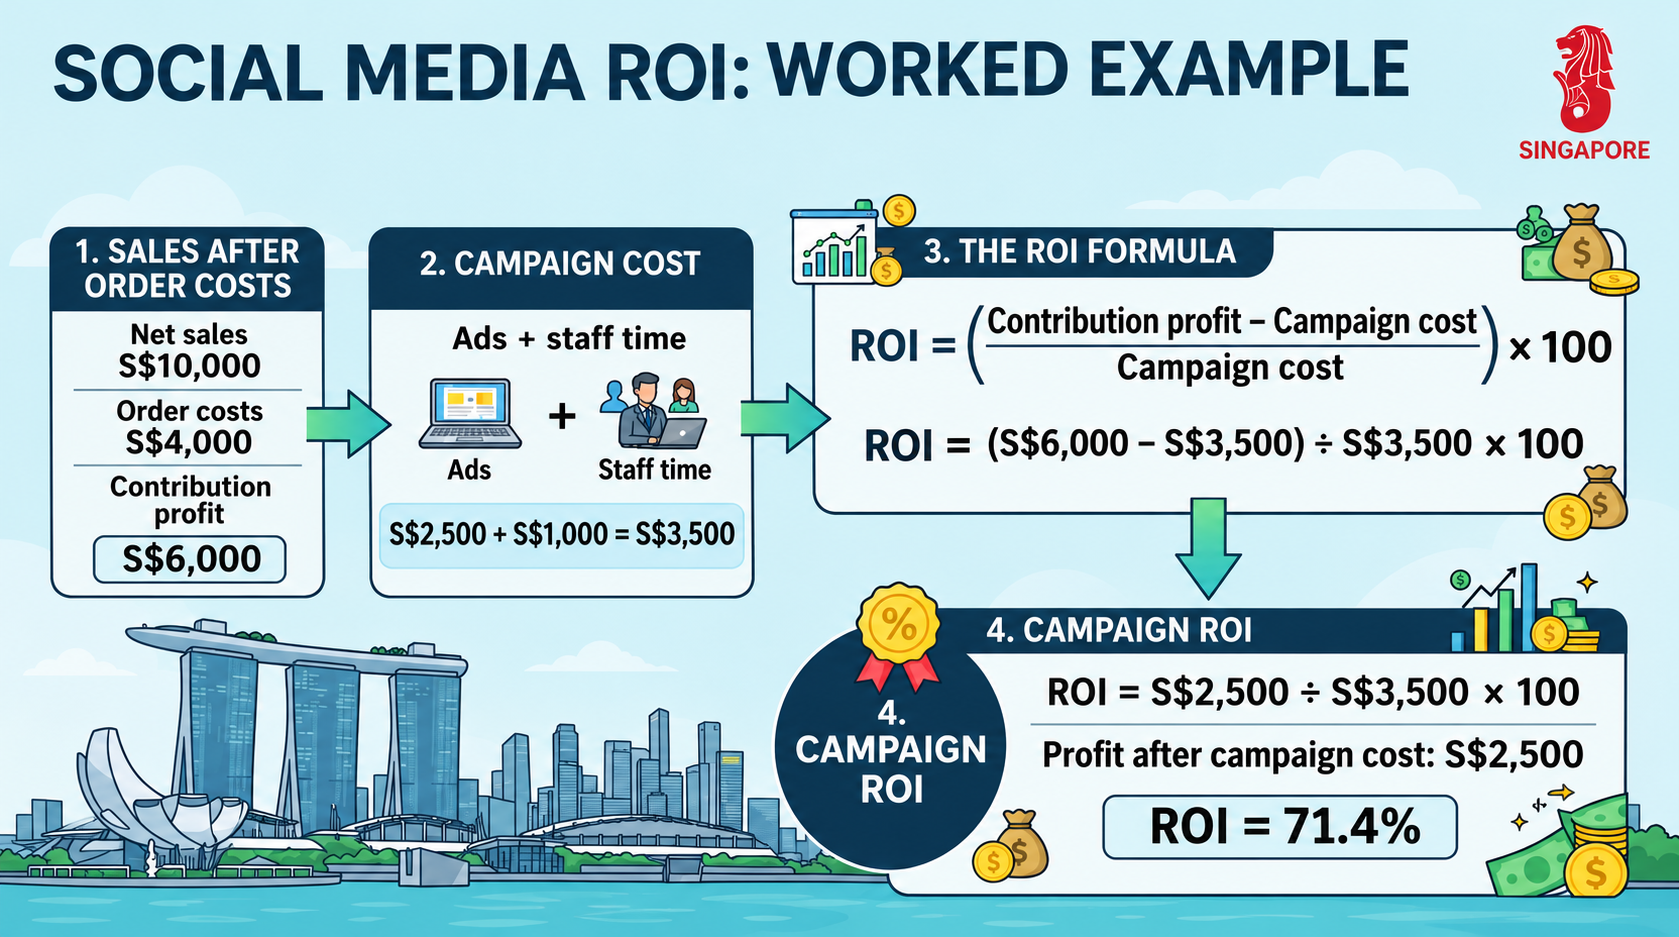
An illustrative retail campaign records S$10,000 in net sales. Product and fulfilment costs total S$4,000, leaving S$6,000 in contribution profit before marketing costs. Ads cost S$2,500, and staff time costs S$1,000. The campaign has S$3,500 in marketing costs.
| Calculation | Amount |
| Net sales credited to the campaign | S$10,000 |
| Product and fulfilment costs | S$4,000 |
| Contribution profit before marketing | S$6,000 |
| Full campaign cost | S$3,500 |
| Profit after campaign cost | S$2,500 |
| Social media ROI | 71.4% |
Social media ROI = [(S$6,000 – S$3,500) ÷ S$3,500] × 100 = 71.4%.
The campaign earned about S$0.71 after campaign costs for every S$1 spent on it. That is the return on the campaign’s marketing investment using the costs listed above. The team can use the same cost rules for a later campaign, even if its product mix, discount or production budget changes.
A lead generation campaign may end before its prospects sign a contract. The team can show the cost per qualified lead now and estimate its return using past sales data. Two figures make that estimate possible. The first is the share of similar qualified leads that became customers. The second is the average contribution profit from one of those customers.
Suppose S$2,400 brings in 60 qualified leads. If one in five similar leads usually buys, the team can estimate 12 sales. At S$300 in contribution profit per sale, the estimated contribution is S$3,600. That gives an estimated ROI of 50%. A lower close rate would reduce the result. The team can replace the estimate with the contribution from actual sales once the deals close.
How to Connect Social Media to Sales
Tag links and test the customer action
A tagged campaign link can tell Google Analytics 4, or GA4, which post or ad brought someone to a site. Google’s campaign URL builder documentation explains how UTM tags identify the source, medium and campaign. A team might use instagram as the source, paid_social as the medium and year_end_sale as the campaign name. Consistent spelling keeps one campaign from appearing under several names.
The next step is to record what the visitor does. A shop can use GA4 ecommerce events to record purchases. A service business can record a completed form submission and mark it as a key event in GA4. A test order or enquiry should reach both the analytics tool and the system that stores the order or lead. DebugView lets the team check which events arrive during the test.
An enquiry can take a less direct route. A customer may start a WhatsApp chat after seeing an offer, then buy over the phone. A prefilled message with an offer name can help staff identify the campaign. If the customer clears the message and the source is unknown, the team can leave the field blank. The sale still belongs in the sales total, with its source recorded as unknown.
Bring the numbers into one report
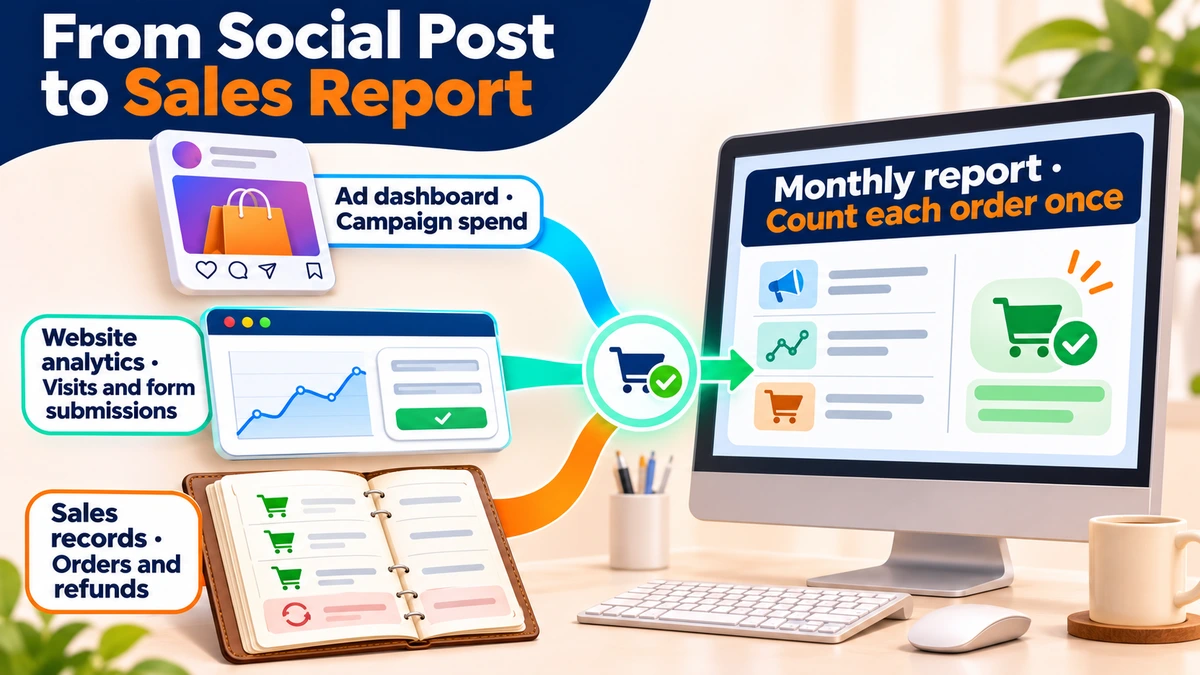
A team can use a spreadsheet to compare what the platform charged, what website analytics recorded and what customers bought. Each source answers a different question. The platform shows spend and activity. Website analytics shows visits and actions on the site. The sales or order system shows paid orders, refunds and won deals.
A Facebook marketing campaign might report a purchase in its ad dashboard while analytics credits another channel for that sale. The same purchase can appear in both reports because they use different rules. A team can start with one order record, then apply one rule to decide how much credit social receives. That keeps totals from rising just because more platforms report the order.
Choose an attribution window and a credit rule
An attribution window is how far back the team looks for an interaction that can receive credit for a sale. A shop with a two-week offer might start with a short click window. A business that sells annual software contracts can use past enquiry and close dates to see how long buyers take. The window used for the report should be recorded before the team compares results. GA4 lets teams set a lookback window for key events.
The credit rule determines which channel gets credit within that window. A customer may click an Instagram post on Monday, visit through an email on Wednesday and buy on Friday. A last-click rule can give the email credit. A report that shows earlier interactions can reveal that social was involved too. The GA4 attribution paths report helps teams see which channels appeared before a purchase or enquiry.
A consistent rule lets the team compare campaigns over time. A change in the window or credit rule can move sales between channels even when the number of orders stays the same. If the business changes either setting, the report can state when it changed and show which earlier figures use the old rule.
Separate credited sales from extra sales
A credited sale meets the reporting rule. An extra sale is one the business would have missed without the campaign. The difference becomes important when a campaign targets people who already know the brand. Someone who sees a retargeting ad may have been ready to order after receiving an email or putting an item in their basket.
A business with enough orders can compare randomly assigned groups, showing the campaign to one group and holding it back from the other. The difference in outcomes helps estimate the extra sales the campaign caused. For a small campaign, the team can report the sales that received credit and describe any uncertainty. A quiet week followed by a busy one gives the team something to investigate, especially if a payday, public holiday or new offer also fell during the campaign.
How to Report Results and Improve Returns
A one-page report for leadership
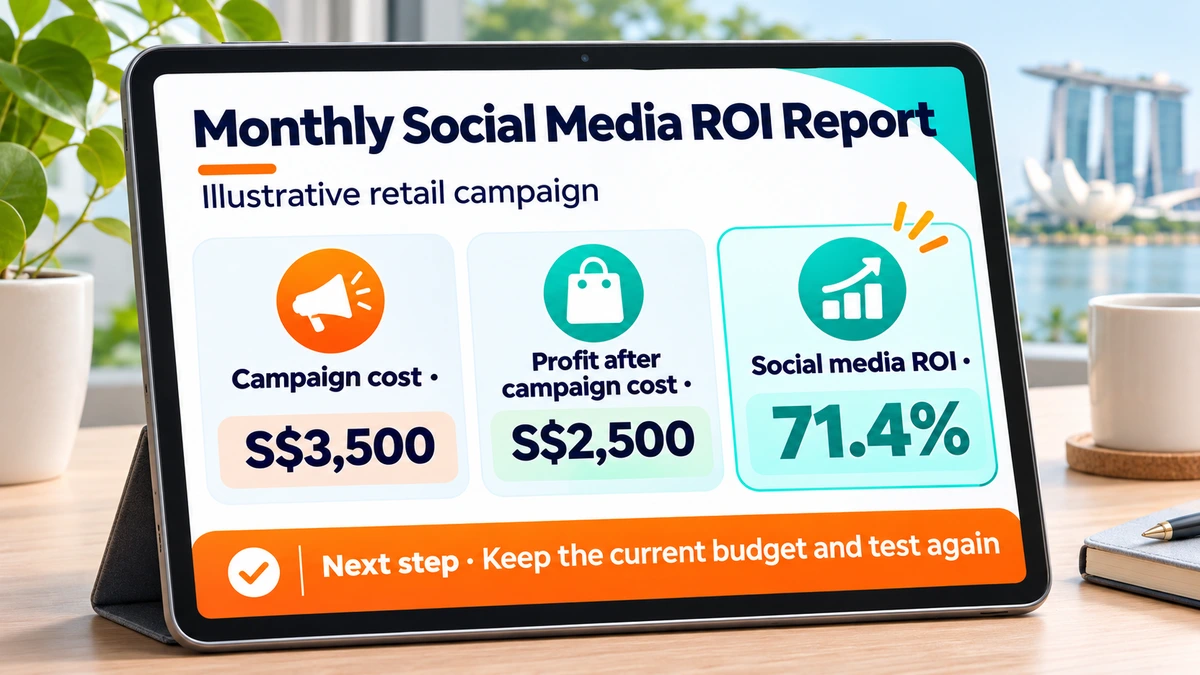
A one-page report can open with the decision, followed by the figures that support it. For the retail example, the business could keep the current budget for another run and check whether the same product mix still earns a return. The report would show S3,500incampaigncost,S2,500 in profit after campaign cost and 71.4% ROI. It would also state the click window and where the team checked orders and refunds.
A monthly report can keep three lines distinct.
| Report line | What belongs here |
| Sales return | Contribution from completed sales and ROI after campaign cost |
| Sales pipeline | Qualified leads, deals still open and any estimated value |
| Service efficiency | Changes such as time spent answering repeated questions |
Staff time saved can help a team serve more customers or free up hours for other work. A time saving becomes a cash saving only when the business can show the related expense fell. A report can show hours saved separately from campaign profit so leadership can see what changed in each area.
Where to make the next change
The best place to change a campaign is often the first point where results fall short. An ad that attracts visitors but generates few purchases may need a better match between its offer and the product page. A lead campaign with many form submissions and few qualified enquiries may need to show the price range or intended customer in the ad. A campaign that sells well and earns little may need a different offer or product mix.
A useful review compares the result with the team’s next best use of the budget. If two campaigns use the same cost rules and have enough time to record sales, the team can compare their returns. When one campaign has just launched and another has already recorded weeks of sales, the team can wait for a comparable period or label the newer result as early.
A higher budget can also change the result. The first group of buyers may know the brand well. A larger campaign can reach more people who need time before they buy. A small increase, followed by a check on cost per order and contribution profit, gives the team a better basis for its next decision than the original ROI percentage alone.
Conclusion: Use Social Media ROI to Guide Your Next Budget
A first review can start with one campaign and one decision. For an online shop, that could mean matching last month’s credited orders with refunds and delivery costs before renewing the ads. For a service business, it could mean asking sales which enquiries qualified and how many turned into paid work. The review is ready when someone outside marketing can trace the figure back to the records behind it.
MediaOne’s social media marketing services can help Singapore businesses plan and manage campaigns around the actions they want customers to take. A recent campaign report gives the team a starting point for discussing which offers, audiences and channels to test next.
FAQs About Social Media ROI
Yes, when the report uses a defined period and can connect those purchases to the customers the campaign acquired. For example, a retailer can track contribution from first orders and then report repeat-order contribution after 90 days. A separate repeat-order figure makes it easier to compare a campaign that has just ended with one that has had time to generate repeat sales.
How should a business report ROI when a campaign has no recorded cost?
The formula cannot produce a percentage when the cost is zero because it requires division by cost. An organic campaign may still use staff time, paid tools or production resources. If the team cannot assign a reasonable cost, the report can show the orders or enquiries it recorded and leave the ROI field blank.
A code helps identify orders tied to a promotion. Customers may share it outside the creator’s audience, and some people who saw the post may buy without using it. The code therefore captures part of the result. The financial review can use the contribution from code orders and include creator fees, gifted products and other campaign expenses.
A shop can record a campaign offer code at the till or ask customers how they heard about the offer. A code provides a more consistent record for a specific promotion. Customer answers can supply context for other purchases. The team can record each method separately so a single sale appears once even if the customer mentions the ad and uses the code.