| AI Summary
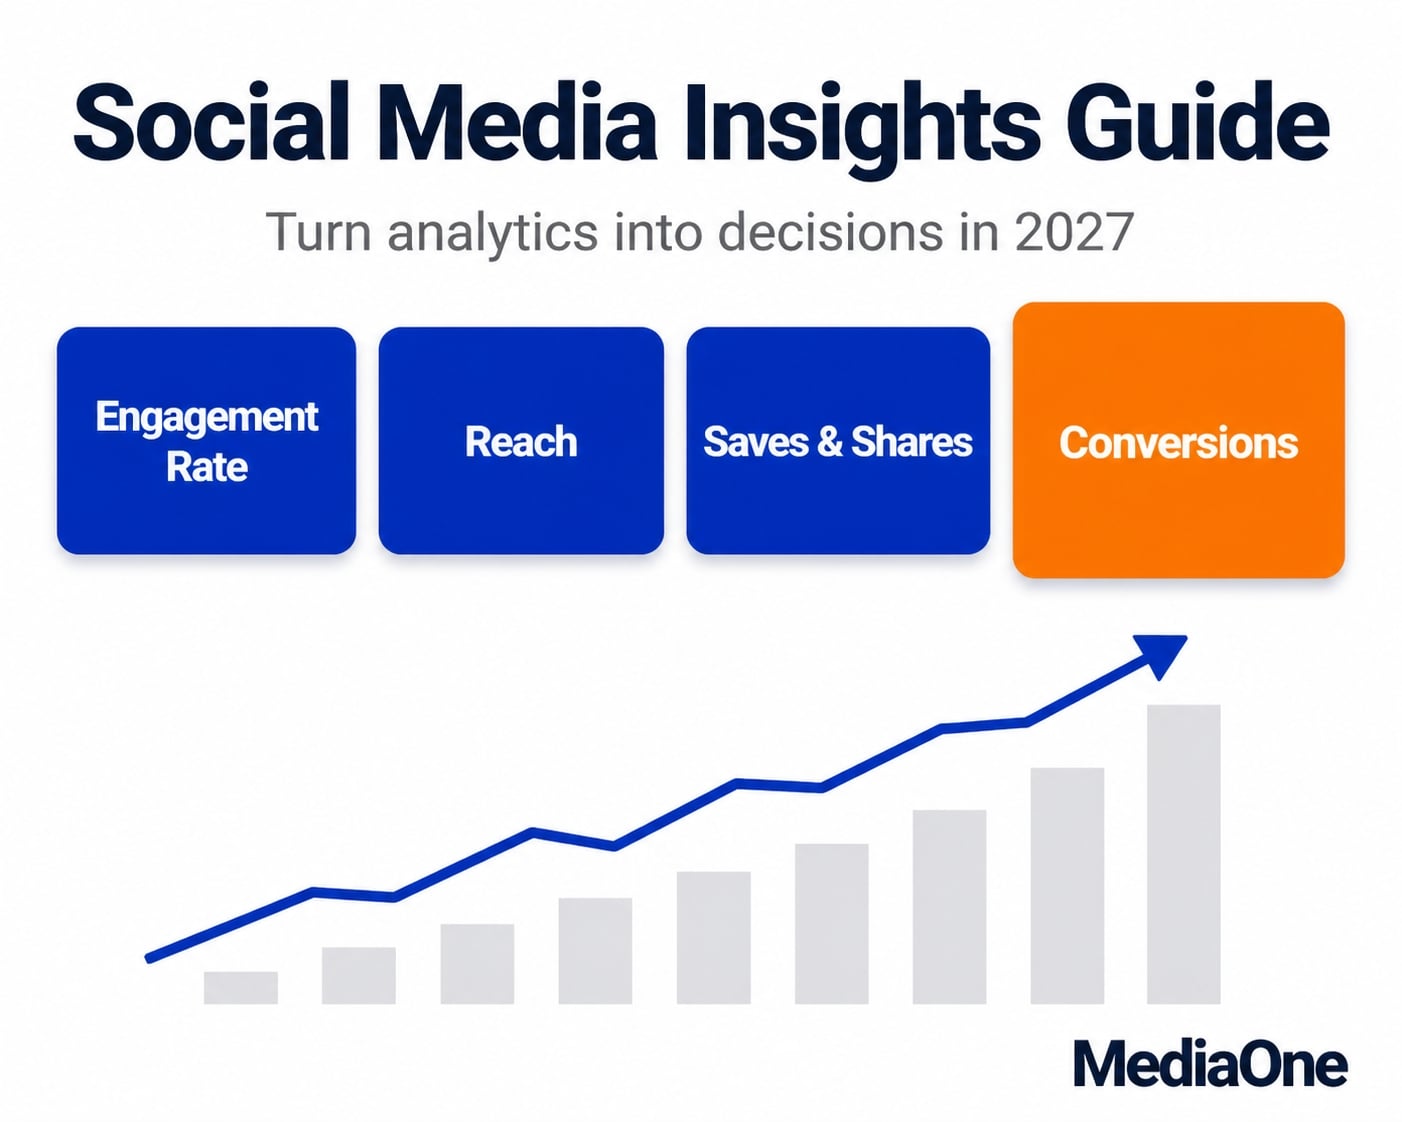
Social media insights are patterns that tell you what to do next, while metrics are just raw counts. To turn data into decisions, track seven metrics (engagement rate, audience composition, content-type performance, reach vs impressions, saves and shares, click-through rate and follower source) in each platform’s free native analytics, and connect them to business results with UTM tags and Google Analytics 4. Three frameworks (Content Audit, Audience Segment Map and Monthly Insight Statement) turn the numbers into one clear action, supported by a rhythm of weekly, fortnightly, monthly and quarterly reviews. Judge performance on 30+ day trends rather than single posts, and account for seasonality and algorithm changes. |
Social media insights and metrics are not the same thing. A metric tells you “500 people saw this post.” An insight tells you “this post format generates higher engagement from your 25–34-year-old audience when posted Tuesday through Thursday at 6 p.m.” That distinction matters because insights drive decisions, while raw metrics provide no actionable direction.

Most brands check their social analytics reactively: after a post underperforms, or when they remember to look. By then, the pattern is already lost. This guide walks you through where to find actionable data on every major platform, which metrics actually predict growth and conversions, and how to build a sustainable rhythm of checking analytics so insights become automatic rather than an occasional scramble.
Key Takeaways
- Social media insights are actionable patterns extracted from engagement data, audience demographics and content performance. Metrics are raw counts; insights are the patterns that inform decisions.
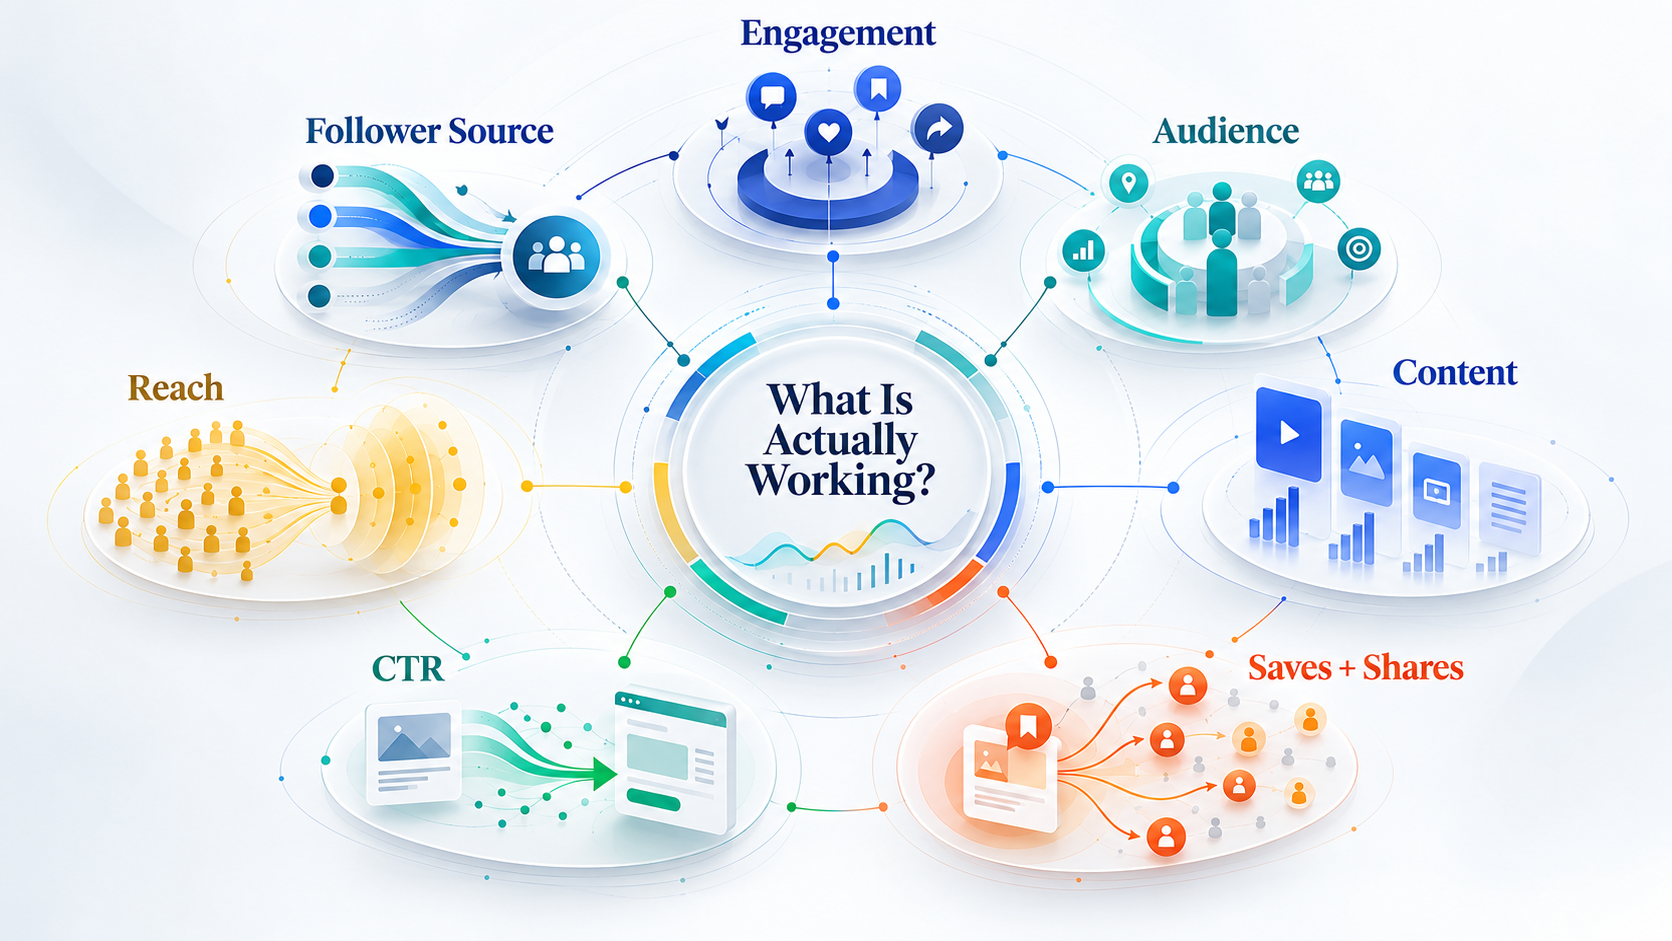
- The seven metrics that matter most are engagement rate, audience composition, content-type performance, reach versus impressions, save and share rates, click-through rate (CTR), and follower source.
- Native platform analytics (Meta Insights, YouTube Studio, TikTok Analytics, LinkedIn Analytics) are reliable and free. Start here before considering third-party tools.
- Implement a sustainable insights habit: 15-minute weekly check-in, 45-minute fortnightly deep dive, 90-minute monthly strategy session, and quarterly reflection.
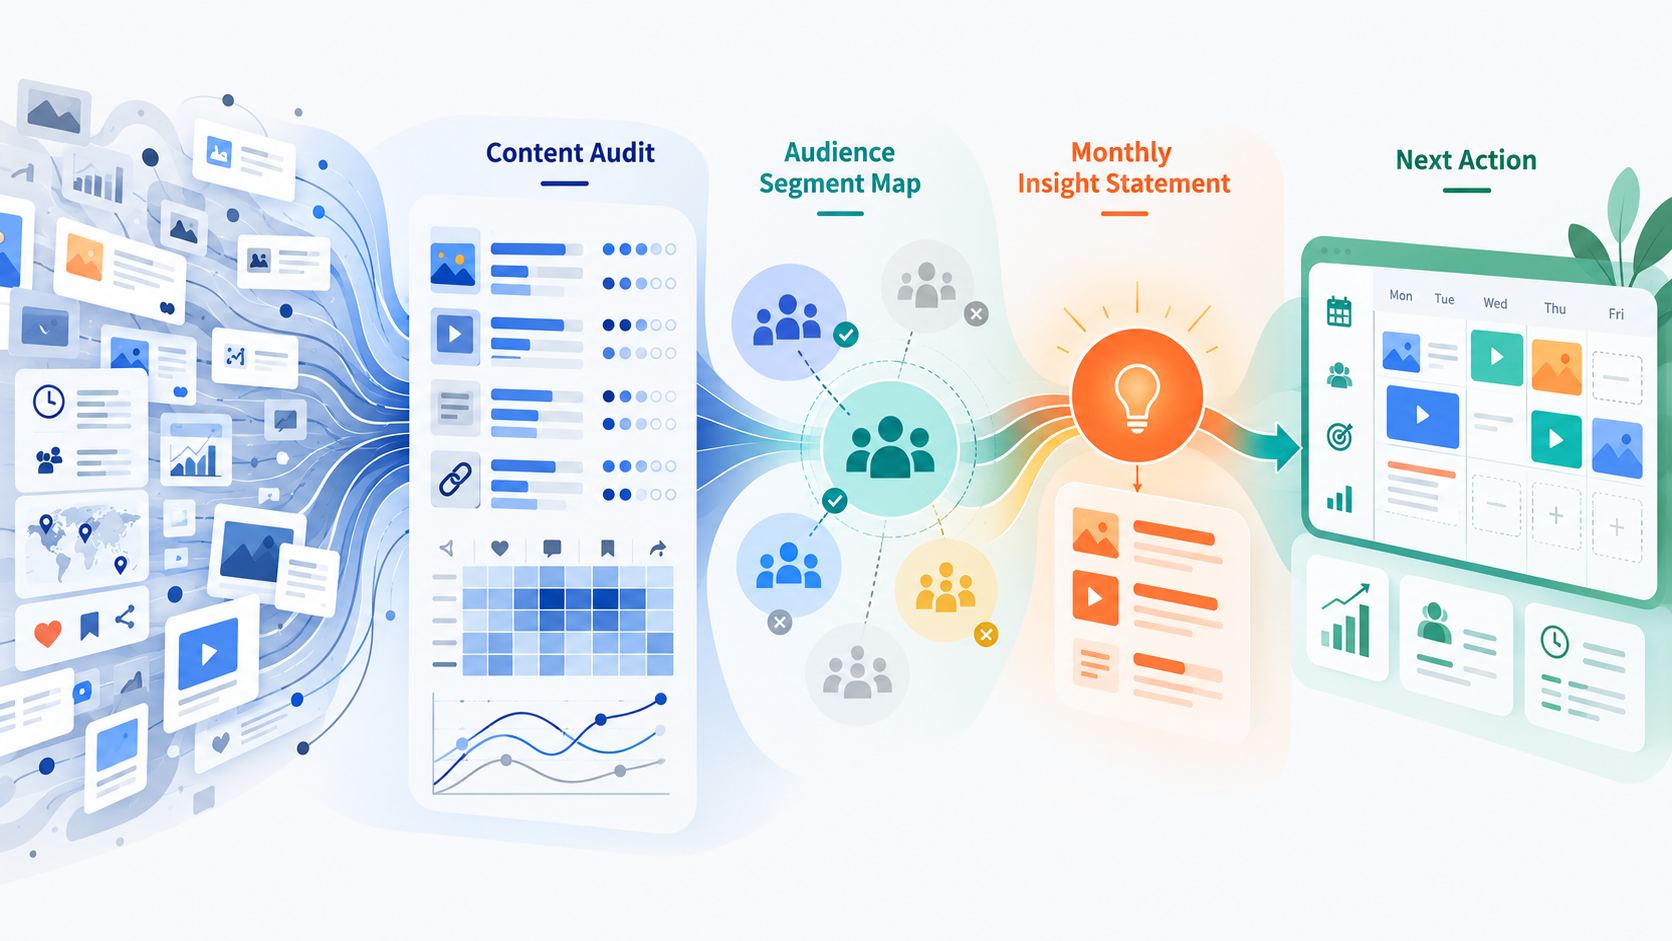
- Use one of three frameworks to extract insight from raw data: the Content Audit (identify top-performing patterns), the Audience Segment Map (align audience composition to business goals), or the Monthly Insight Statement (distil findings into one actionable priority).
- Avoid common pitfalls: chasing vanity metrics, ignoring seasonal context, confusing correlation with causation, and obsessing over single posts instead of 30+ day trends.
- Cross-reference social analytics with Google Analytics 4 to connect engagement with business outcomes, including traffic, conversions and revenue.
What Social Media Insights Actually Are (And Why They Matter)
The Core Definition
Social media insights are quantitative and qualitative data patterns generated when audiences interact with your content. They include likes, shares, comments, save rates, audience demographics and behavioural trends. Unlike vanity metrics such as follower count, true insights reveal why your content resonates and who engages with it most.
Insights are actionable patterns extracted from engagement data. Metrics are raw counts. A metric is inert. An insight tells you what to do next.
The Difference Between Metrics and Insights
Consider two examples:
A metric: “Your post received 500 impressions.”
An insight: “Your Reels perform strongly with your 25–34-year-old audience in Southeast Asia when posted on weekday evenings, with notably higher save rates.”
The first number stands alone and does not direct action. The second statement tells you when to post, what format to use and who your content serves best.
Metrics are the raw materials. Insights are what you build from them.
Most brands track metrics obsessively and extract almost no insights. They watch follower count, total likes and total impressions fluctuate without asking why. Insights require you to look for patterns beneath the noise.
Why Insights Drive Business Results
Brands that act on insights can inform better decisions in three areas: audience growth, conversion rates and cost-per-acquisition.
Insights inform content strategy. When you identify that how-to videos outperform opinion pieces in your analytics, you shift your content calendar toward what actually works. This raises your engagement rate. Platforms reward engagement by showing your content to more people. More of your target audience discovers you.
Insights inform platform prioritisation. If you discover that LinkedIn drives qualified leads while TikTok drives awareness metrics, you allocate time and budget accordingly. You stop wasting effort on platforms where your audience is not present or not ready to convert.
Insights inform campaign timing. If your data shows engagement dips during summer holidays but spikes in January, you plan heavier campaigns around peaks and lighter ones around troughs. This smooths performance and reduces wasted spend.
A brand with 5,000 followers and a 6% engagement rate may grow faster and attract more conversion-ready customers than a brand with 50,000 followers and a 0.5% engagement rate. Engagement quality, not follower size, is the lever. Results vary significantly depending on industry, product type and audience intent.
Where to Find Social Media Insights on Each Major Platform
Each major platform hosts its own native analytics dashboard. These are your primary source of truth and are available free to all accounts, though some require minimum follower counts or specific account types.
Platform Comparison Table
| Platform | Free Access | Key Metrics | Minimum Requirements | Best For |
|---|---|---|---|---|
| Meta (Facebook/Instagram) | Yes | Engagement breakdown, reach, impressions, audience demographics, content-type performance | Business account | Product-focused brands, visual storytelling |
| TikTok | Yes | Views, average watch time, completion rate, FYP ratio, sound performance | 1,000 followers (estimated current threshold) | Viral reach, trend-driven content, younger audiences |
| YouTube | Yes | Watch time, average view duration, CTR, audience retention graphs, A/B testing | Monetisation features at 1,000 subscribers | Long-form content, educational material, technical audiences |
| Yes | Impressions, engagement rate, follower demographics, profile visits | Business account; detailed insights at 10,000+ followers | B2B, professional positioning, recruiter visibility | |
| X | Yes | Impressions, engagement rate, retweets, replies, bookmarks, tweet-type breakdown | Business or creator account | News, real-time conversation, thought leadership |

Meta Platforms (Facebook and Instagram)

Access Meta Insights through your business account’s Insights tab on both Facebook and Instagram. You will find reach (unique accounts that saw your content), impressions (total times your content was displayed), a detailed engagement breakdown (likes, comments, shares and saves by post), audience demographics (age range, location, gender and language), follower growth trends over time and content-type performance comparisons.
Reels receive separate tracking. The platform flags video completion rate (how far viewers watched before stopping), shares and placement source (whether the Reel reached followers, non-followers or the broader Explore feed). A Reel reaching 80% Explore traffic signals the algorithm is promoting it; one reaching 80% followers-only may benefit from format or topic refinement.
For Instagram Stories, you will see tap-forward rate (how many viewers swiped to the next Story), exit points (where viewers stopped watching your Story sequence) and interaction counts. This reveals which Story slides held attention and which caused viewers to stop watching.
TikTok
TikTok Analytics unlocks at 1,000 followers (or with a Creator Fund invitation). The threshold has changed historically, so verify current requirements on the TikTok Creator Portal. Once available, the dashboard shows video views, average watch time in seconds, completion rate (percentage who watched to the end), traffic source (FYP, followers or other), device type (iOS, Android, web) and audience location by country and region.
The “For You Page” (FYP) performance indicator is TikTok-specific and critical. It shows what percentage of views came from the FYP (algorithmic discovery) versus your existing followers. An 80% FYP ratio signals the algorithm is favouring your content; a 20% FYP ratio suggests you are reaching mostly your known audience and may need different hooks or trending sounds to expand reach.
Sound and hashtag metrics are tracked separately, so you can identify which audio tracks and hashtags appeared in your top-performing videos. This intelligence feeds directly into your next content brainstorm.
YouTube
YouTube Studio’s analytics are split into several reports. Watch time shows total hours viewers spent on your videos (the metric YouTube’s algorithm prioritises most). Average view duration breaks this down per video: a 4-minute average on a 10-minute video suggests the algorithm may not promote it further, while a 7-minute average suggests strong viewer retention.
Click-through rate (CTR) measures the percentage of impressions (thumbnail views) that led to clicks. YouTube shows CTR for both search impressions and suggested-video impressions. Performance thresholds vary by content type and niche. Audience retention graphs display second-by-second where viewers stopped watching, revealing which segments of your videos lose attention.
YouTube’s native A/B testing feature lets you test two different thumbnails or titles on the same video simultaneously and see which drives higher CTR. This removes guesswork from thumbnail and title optimisation.
LinkedIn Analytics centre on impressions and engagement rate (total interactions divided by impressions, expressed as a percentage). Profile views show how many accounts visited your profile, often from content discovery. Follower demographics break down by job title, industry, company size and seniority level, allowing you to verify your content reaches your intended professional audience.
LinkedIn distinguishes sharply between organic reach (followers and network) and paid reach (LinkedIn Ads). This separation helps you understand whether growth comes from content strength or ad spend. The platform also shows which industries and job titles engage most with your content, letting you refine your messaging to high-engagement segments.
For creators with 10,000+ followers, LinkedIn provides more detailed audience insights, including seniority level and company size. Verify current thresholds on LinkedIn Creator documentation.
X
X displays impressions, engagement rate, retweets, replies, bookmarks and profile visits. The platform segments performance by tweet type: text-only tweets, image tweets, video tweets and poll tweets often perform differently, and X breaks these out separately so you can see which format resonates with your audience.
X also shows which audience segments interact most (based on follower demographics and interests), helping you identify whether your audience matches your target or has drifted. Bookmark count is particularly useful on X because bookmarks signal intent to consume content later, often a stronger signal than retweets.
Accessing these dashboards requires a business or creator account on each platform. If you use a personal account, convert it first. All five platforms offer conversion at no cost, and switching is reversible.
Start by checking your native platform analytics before exploring third-party tools. Platform data is always more reliable than aggregated data from outside services, and you will not need paid tools to extract the insights covered in this article.
Note: Platform analytics are subject to change as algorithms and feature sets evolve. Cross-verify social platform metrics with your own analytics (such as Google Analytics 4) to connect engagement with owned business outcomes.
The Seven Metrics That Matter Most (And What They Actually Tell You)
Engagement Rate, Not Vanity Numbers
Engagement rate measures the percentage of your audience that interacts with your content. The formula is: (total engagements ÷ total impressions) × 100.
A 2–5% engagement rate is typically considered healthy across most platforms, whilst 5% or above is generally regarded as strong. However, these benchmarks vary significantly by platform and industry, so use them as reference points rather than absolute targets.
This metric reveals whether your audience genuinely cares about what you post, regardless of follower count. Consider two accounts: a 50,000-follower account with a 1% engagement rate generates 500 engagements per post. A 5,000-follower account with a 6% engagement rate generates 300 engagements per post. The smaller account has a stronger, more valuable audience because each follower is more likely to engage.
Engagement rate is foundational to all other insights. Platforms promote content with high engagement to more people. This creates momentum: better engagement triggers wider distribution, which attracts more engaged viewers. Focus on improving this metric before chasing raw follower counts.
Audience Composition and Demographic Alignment
Pull your platform’s demographic breakdown: age, location, gender and interests. Compare it directly against your target customer profile.
If your target customer is women aged 25–34 in urban Singapore, but your audience is 60% men aged 18–24 spread across all regions, something is misaligned. This signals one of three problems: you are on the wrong platform for your audience, your content tone does not match your target, or you have attracted the wrong audience segment through an unrelated viral post.
Cross-reference demographic data with conversion data if available. Do the 25–34 women segment drive more website visits or sales than younger followers? If yes, shift your content themes and posting times to appeal to that segment. Demographic alignment is the difference between a growing follower count and a growing business.
Content-Type Performance Breakdown
Different content formats almost never perform equally on the same platform.
On Instagram, Reels typically outperform static posts by a significant margin. On LinkedIn, articles and polls often outperform image posts. On YouTube, watch time matters more than subscriber growth: content where viewers stay to watch 50% or more of the video performs better than content with high drop-off rates. On TikTok, native video content consistently outperforms repurposed material from other platforms.
Export your last 30–50 posts into a spreadsheet and group them by format: Reels, carousels, static images, stories, text-only. Calculate the average engagement rate for each group. Identify which format wins on your platform. Plan your next month’s content calendar to allocate roughly 50% of posts to your strongest format, with the remaining 50% split between variations and new approaches to test.
Reach vs. Impressions
Reach is the number of unique accounts that saw your content. Impressions are the total number of times your content was displayed. If the same person sees your post twice, that counts as two impressions but only one reach figure.
If a post has 5,000 reach and 7,500 impressions, your audience is seeing your content multiple times (high impression-to-reach ratio). This signals strong algorithmic promotion and audience interest. If a post has 5,000 reach and 5,100 impressions, most people saw it only once (low ratio), suggesting limited algorithmic boost and limited reach beyond your existing followers.
A low reach-to-impression ratio often indicates weak discovery beyond your follower base. Try new hashtags, post at different times or adjust your content style to expand reach. A high ratio means your strategy is working, so maintain your current approach.
Saves indicate your audience intends to return to the post later. Shares suggest they believe the content is valuable enough to show others. Both are stronger signals than likes.
A post with 50 saves and 20 shares often outperforms one with 200 likes but no saves. This is because platforms prioritise signals that suggest long-term value. Saves and shares indicate content worth keeping and spreading, so algorithms boost it to more people.
Track which of your posts get saved or shared most. These are often how-to content, educational posts, inspirational quotes or niche advice. Examine what made them shareable: the topic, format, tone or timing. Build more posts around that formula.
Click-Through Rate (CTR) and Traffic Source
If you are driving traffic to a website, CTR shows what percentage of people who saw your post actually clicked the link. This metric bridges social performance and business outcomes.
Compare CTR across posting times, caption styles and link placement. A post with a 2% CTR outperforms one with a 0.5% CTR. Use Google Analytics or your website analytics tool to tag social traffic with UTM parameters. For example, use: https://yoursite.com/?utm_source=instagram_reels&utm_medium=social&utm_campaign=february. This allows you to see in Google Analytics exactly which posts drove site visits and which visitors converted.
This is where social insights move beyond vanity metrics to revenue. A smaller audience that clicks and buys is infinitely more valuable than a large audience that ignores your links.
Audience Growth Rate and Follower Source
Track your week-over-week or month-over-month follower growth as a percentage rather than absolute numbers. Percentage growth accounts for different starting sizes across accounts.
More importantly, segment new followers by source. Did they come from a viral post, a collaboration, a paid campaign or organic discovery? Growth from irrelevant sources (for example, 2,000 new followers from a viral post about a topic unrelated to your brand) will not improve engagement or conversions. Growth from your target audience segment (for example, 300 new followers from a post about your core offering) is far more valuable.
If your follower count is rising but engagement rate is declining, your new followers do not match your target audience. Pause growth tactics and refocus on content that attracts your intended segment.
How to Read Your Platform’s Dashboard Without Misinterpreting Data
Set a Consistent Reporting Period
Pick a single reporting window and stick with it. Most platforms offer 7-day, 28-day or custom date ranges. The 28-day period is standard because it smooths out weekly anomalies and aligns with monthly planning cycles.
Consistency matters because seasonal patterns distort conclusions. Engagement typically dips during holidays, summer breaks and year-end periods. Compare month-on-month (January 2024 versus January 2025, or the first week of February versus the first week of February the previous year) to account for these rhythms automatically.
Set a calendar reminder to pull data on the same day each month. Most businesses choose the first working day of the following month so the prior month’s data is complete.
Understand Reporting Delays
Your platform’s analytics lag behind real activity. This lag varies by platform:
- Meta platforms (Facebook, Instagram): 48-hour delay. Data from Tuesday may not finalise until Thursday.
- TikTok and YouTube: Daily updates, typically overnight.
- LinkedIn: Near real-time, with minor adjustments within 24 hours.
- X: Real-time impressions; engagement metrics update within hours.
Do not expect yesterday’s data to be complete or final. If you check analytics on Wednesday morning, you will see incomplete Tuesday data and full data only through Monday. This is normal and expected.
Build this rhythm: check analytics every Friday morning to review the full prior week (Monday through Thursday, with Wednesday still settling). By Friday, 95% of the week’s data is final. This prevents you from reacting to incomplete numbers or making strategy changes based on preliminary data.
Cross-Reference With External Tools
Platform dashboards are valuable but incomplete. They tell you what happened (engagement metrics, reach, follower growth) but not whether any of it mattered to your business. Platform metrics are also subject to change as features are updated or algorithms shift.
Google Analytics fills this gap. It shows whether social traffic converts to sign-ups, purchases or meaningful actions. A post may achieve a 5% engagement rate but drive zero sales. Conversely, a lower-engagement post might drive high-intent traffic that converts.
Set up UTM parameters in every social link you share. For an Instagram post linking to your homepage, use https://yoursite.com/?utm_source=instagram&utm_medium=social&utm_campaign=february_promo. This tags traffic so you can see in Google Analytics exactly which posts drove site visits and which visitors took action.
Additionally, maintain a simple monthly spreadsheet log with columns for:
- Month
- Total followers (end of month)
- Posts published
- Average engagement rate
- Top-performing post (by engagement)
- Top traffic source (by volume)
Platform dashboards retain data for only 2 years and do not easily show 12-month trends. A spreadsheet log reveals patterns dashboards hide. After six months of logging, you will spot seasonality, growth trajectories and which content types consistently outperform.
Watch for Platform Algorithm Changes
Sudden engagement or reach drops rarely mean your content got worse overnight. They often signal algorithm updates.
Meta, YouTube and TikTok regularly adjust how they rank and distribute content. When these changes happen, reach and engagement can drop 20–40% across your entire account, regardless of content quality. This is frustrating but usually temporary. Within weeks, most accounts stabilise as audiences adapt to new ranking criteria.
Distinguish between content decline and algorithmic shifts:
- Algorithmic shift: reach or engagement drops uniformly across all your content types on the same date.
- Content issue: only certain content types (for example, Reels) or topics drop, whilst others hold steady.
Follow official announcement channels to stay informed:
- Meta: Meta help resources
- YouTube: YouTube Official Blog (search “algorithm” or “ranking”)
- TikTok: TikTok Creator Centre (announcements section)
- LinkedIn: LinkedIn Help Centre
When you spot a sudden drop, check these channels first. If competitors also report drops on the same dates, it is algorithmic. If only your account is affected, the issue is likely content- or audience-related.
Build a simple document: log the date, which metric dropped, by how much, and what platform announcement explains it. Over time, this historical record helps you separate real content issues from temporary algorithm updates.
Three Actionable Frameworks to Extract Insights From Raw Data
Raw data is overwhelming. Three concrete frameworks turn platform numbers into decisions you can act on this month.
Framework 1: The Content Audit (Three-Step)
This framework reveals which content types and topics move the needle on your account.
Step 1: Log your last 30–50 posts into a spreadsheet.
Create columns for:
- Post date
- Content type (video, carousel, static image, text-only)
- Caption length (word count)
- Primary topic (for example, how-to, opinion, behind-the-scenes)
- Call-to-action present (yes/no)
- Impressions
- Engagement rate
- Saves
- Shares
You can export this data from your platform’s native analytics. Meta Insights, YouTube Studio and TikTok Analytics all allow CSV export. If your platform does not offer export, manually copy the numbers. The 30-minute setup pays back within two weeks.
Step 2: Sort by engagement rate (highest to lowest) and hunt for patterns.
Look at your top 10 posts and ask:
- Do videos outperform static images? By how much?
- Do how-to or educational posts rank higher than opinion or entertainment?
- Do longer captions suppress reach, or do they drive engagement?
- Do posts with a clear call-to-action (for example, “link in bio”, “save this”) outperform those without?
- Are your saves and shares proportional to likes, or do certain post types save or share at notably higher rates?
Do not expect 100% consistency. If 7 of your top 10 are videos, that is your signal. If only 4 of 10 are, video may not be your primary format.
Step 3: Identify your top 3–5 performers and reverse-engineer them.
Write down what these posts have in common: the format, topic, caption tone, posting time, call-to-action and even the thumbnail or opening hook. Plan your next 20 posts to amplify this formula with slight variations. Test a new angle within the winning format, or a new posting time.
Example: if your top three are all 60-second Reels on time-management, all posted Tuesday at 6 p.m., all with a save-focused call-to-action, then next month’s calendar should include at least six similar Reels on productivity-adjacent topics, posted Tuesday or Thursday at 6 p.m.
Framework 2: The Audience Segment Map (Four-Step)
This framework surfaces whether you are building an audience aligned with your business goals, or attracting the wrong people.
Step 1: Export your audience demographics.
Pull age, location, gender and interests from your platform. Instagram, Facebook, TikTok and YouTube all display these breakdowns under Audience or Analytics.
Step 2: Compare to your target customer persona.
If you sell luxury skincare to women aged 25–40 in Singapore, Australia and New Zealand, highlight in a separate spreadsheet column which demographic segments align. Mark misaligned segments too: if 35% of your followers are aged 18–24, or 40% are outside your target regions, that data deserves investigation.
Step 3: Pull engagement data per segment.
Most platforms allow you to filter engagement by demographic (age, region, gender). Cross-reference your engagement rate in aligned segments versus misaligned ones. Often, your best-engaged audience will not be your primary target, or your target will show little activity.
For example: you may find that women aged 35–44 in Australia engage at 6%, but women aged 22–28 globally engage at 8%. That is a signal worth acting on.
Step 4: Decide on your next move.
If misaligned segments are highly engaged, you have two options:
- Create secondary content streams for them. If your unintended 18–24-year-old audience is strong, test one post monthly aimed at their interests while maintaining your core strategy.
- Refocus your content to attract your true target. If your target segment shows minimal activity, your content tone, topic or format may be off. Audit that content using Framework 1 and shift accordingly.
Document your decision. Re-run this audit quarterly to see if the gap has closed.
Framework 3: The Monthly Insight Statement (Two-Step)
This framework turns one month of data into one actionable directive for next month. It is compact, shareable and keeps your team aligned.
Step 1: At month’s end, write three sentences.
(a) “Our strongest content type this month was [format], performing [X%] above our average engagement rate.”
(b) “Our audience grew [X%], primarily from [source: organic search, paid ads, a viral post, collaborations, etc.].”
(c) “Our top insight for next month is [specific, actionable finding].”
Example:
(a) “Our strongest content type this month was short-form Reels under 30 seconds, performing 47% above our average engagement rate of 3.2%.”
(b) “Our audience grew 12% month-over-month, primarily from a Reel that reached the Explore page.”
(c) “Our top insight for next month is to test posting Reels at 7 p.m. instead of 6 p.m., since our Tuesday 7 p.m. post outperformed Wednesday 6 p.m. posts by 23% in the past two weeks.”
Keep it specific. “More video content” provides no actionable direction. “Test Reels under 30 seconds, posted Thursday and Saturday at 7 p.m., with product-in-context hooks” does.
Step 2: Share this statement with your team and build next month’s calendar around point (c).
Assign at least one-third of next month’s content calendar to testing the insight from point (c). If insight (c) focuses on posting time, schedule the format wins from point (a) at the new time. If insight (c) focuses on topic, create 8–10 posts in that direction.

Repeat monthly. After three months, you will have three compounding insights. After a year, you will have data on what actually works for your specific audience, on your specific platform, in your specific context. That becomes your competitive advantage over rivals copying generic best practices.
Common Pitfalls That Lead Brands to Misread Their Data
Vanity Metrics Masquerading as Strategy
Focusing on follower count, total likes, or total impressions without engagement rate is like measuring a car’s value by its fuel tank size. A 10,000-follower account with a 0.5% engagement rate is weaker than a 2,000-follower account with a 4% rate when measured against reach, algorithm amplification and conversions.
Engagement rate and audience quality must always come first.
Ignoring Seasonal and Contextual Patterns
Summer holidays, year-end periods and major events suppress engagement across nearly all accounts. Do not panic at a July engagement dip or judge December performance against November. Compare periods with similar context: July to July, November to November.
Similarly, do not compare a weekday post’s performance to a weekend post and conclude one is better. Day-of-week matters significantly.
Misattributing Causation to Correlation
A post succeeded the day after you changed your bio. That does not mean the bio change caused it. It could be coincidence, or the post itself could be the driver. Use simple A/B tests before claiming a tactic works: change one variable, keep everything else constant, test for one week, then measure.
Obsessing Over Single-Post Performance at the Expense of Trends
A single viral post is noise. A pattern of strong performance from a content type over 8 or more weeks is a signal. Always look backwards at least 30 days before making strategy shifts. One Reel hitting 50,000 views does not prove Reels are your best format if your last 10 Reels averaged 8,000 views each.
Tools and Integrations That Amplify Your Insight Capability
| Platform / Tool | Free Access | Key Metrics Provided | Best For |
|---|---|---|---|
| Meta Insights | Full (native to account) | Engagement rate, reach, impressions, audience demographics | Facebook and Instagram analysis |
| YouTube Studio | Full (native to account) | Watch time, average view duration, click-through rate, traffic sources | Video performance and viewer behaviour |
| TikTok Analytics | Full (50+ followers required) | Video views, completion rate, audience demographics, shares | Short-form content analysis |
| LinkedIn Analytics | Full (native to account) | Engagement rate, follower growth, audience insights, impression sources | B2B content and professional audience |
| Google Analytics 4 | Free tier available | Traffic source, conversion tracking, user behaviour, device data | Cross-platform attribution |
Native Platform Analytics
All major platforms offer free analytics. Start here: they are reliable and cover 80% of your needs. Meta Insights, YouTube Studio, TikTok Analytics and LinkedIn Analytics are foundational. Master these first to avoid over-relying on third-party tools that may lag or misinterpret data.
Platform analytics are subject to algorithm changes and occasional reporting delays. Cross-reference significant findings with external tools before making major strategy decisions.
Google Analytics 4
Link your website to Google Analytics 4 to track which social platforms drive traffic and conversions. Set up UTM parameters in your social links so you can distinguish traffic from Instagram versus Facebook versus TikTok. This closes the loop between social metrics and actual business outcomes.
Example UTM structure: ?utm_source=instagram&utm_medium=social&utm_campaign=january_promo
Spreadsheet Logging and Dashboards
A simple monthly log in Google Sheets (followers, posts published, engagement rate, top post, top traffic source) creates a historical record that platform dashboards do not retain long-term. Use Google Sheets’ CHART function to visualise trends over quarters.
Spreadsheet logging takes 10 minutes monthly and becomes invaluable after six months.
Third-Party Tools
Buffer, Hootsuite and Later offer cross-platform analytics and scheduling. Most have free tiers that pull data from your platforms and display it in one dashboard. These are optional but valuable if managing multiple accounts or platforms. Expect to pay £10–35 per month for meaningful analytics features.
AI-Powered Tools and Platform Suggestions
Some platforms (including TikTok and YouTube Studio) now suggest optimal posting times using AI. Use these as suggestions, not directives, and always validate against your own historical data. An AI suggestion that conflicts with 12 weeks of your own data should be ignored.
Building a Sustainable Insights Habit: The Monthly Rhythm
Weekly Check-In (15 Minutes)
Every Friday, log these items in a running notes document:
- Top post for the week
- Current engagement rate
- Any anomalies (unusual spike or drop)
A simple template: “Week of 2026. Top post: [title]. Engagement rate: [X%]. Anomalies: [notes].”
This prevents you from forgetting details by month’s end and creates a searchable archive.
Fortnightly Deep Dive (45 Minutes)
Every second Monday, review the past two weeks of data:
- Which content types are trending?
- Are there platform algorithm changes mentioned in official platform blogs?
- Has audience composition shifted?
- What engagement patterns have emerged?
Share key observations with your team in a brief written summary.
Monthly Strategy Session (90 Minutes)
On the last working day of the month:
- Pull the full month’s data from your analytics dashboards
- Run the Content Audit framework (Framework 1)
- Write your Insight Statement (Framework 3)
- Plan next month’s content calendar around top-performing patterns
- Assign one insight-driven experiment for the month ahead (for example, “test video length under 60 seconds”)
Quarterly Reflection (Two Hours)
Every quarter, zoom out to 90-day performance:
- Are you moving toward or away from your audience and revenue goals?
- What has changed about your audience composition?
- Has your platform’s algorithm shifted?
- How is your competitive landscape evolving?
Adjust your focus for the next quarter based on these findings. Document decisions in a quarterly summary shared with stakeholders.
Frequently Asked Questions
Local and International Nuances in Reading Social Media Data
Time Zone and Geographic Variance
An insight valid for your Singapore-based audience (peak engagement 7–9 p.m. SGT) may not apply to your UK or Australia following. Segment your audience data by region within your platform analytics. If you are targeting multiple time zones, post at the time that maximises reach in your primary market, then repurpose content at optimal times for secondary markets.
Meta and TikTok allow region-level audience filtering. Use it.
Platform Dominance by Region
Instagram and TikTok dominate in Southeast Asia. LinkedIn is growing for B2B globally. YouTube is universal. X remains niche for customer service and news. Allocate analytics attention proportional to where your audience actually spends time. Do not spend 40% of your analysis time on a platform where 5% of your audience is active.
Currency and Conversion Rates
If you are tracking revenue per follower or cost-per-engagement, convert all figures to a single currency to avoid misleading month-to-month comparisons. Use consistent, documented exchange rates (for example, always use month-start rates, or use a fixed annual rate).
Regulatory and Privacy Context
GDPR (EU), PDPA (Singapore) and other data protection laws limit which audience insights platforms can share. Expect less granular demographic data in regulated regions. Work with what is available and do not assume gaps in data are platform errors: they are often legal boundaries.
Comparison Table: Platform Analytics at a Glance
| Platform | Free Access | Key Metrics | Minimum Requirements | Best For |
|---|---|---|---|---|
| Meta Insights | Full (Business Account required) | Engagement rate, reach, impressions, demographic breakdown, post-level performance | Business Account; 100+ followers recommended | Facebook and Instagram unified analysis |
| TikTok Analytics | Full, with restrictions | Video views, completion rate, audience demographics, engagement rate | 1,000 followers and 100,000 video views in past 30 days | Short-form video performance |
| YouTube Studio | Full | Watch time, average view duration, audience retention, click-through rate, traffic source | Verified account; 1,000 subscribers (for monetisation) | Long-form video and audience retention |
| LinkedIn Analytics | Full (Creator Mode required) | Engagement rate, follower growth, post impressions, demographic data | Activated Creator Account | B2B and professional audience insights |
| X Analytics | Full (X Premium recommended for depth) | Engagement rate, impressions, clicks | Active account | Real-time engagement and news topics |
Note: Platform requirements and feature availability change regularly; verify current thresholds with each platform.
Troubleshooting Common Analytics Challenges
| Common Challenge | Why It Happens | Recommended Action |
|---|---|---|
| Analytics dashboard shows zero data for recent posts | Platform reporting delays (typically 24-48 hours) or account eligibility threshold not met | Wait 48 hours before investigating. Verify account meets minimum follower/view requirements for full analytics access. |
| Engagement rate dropped suddenly across all content | Algorithm change, seasonal pattern, or audience timezone shift | Check platform announcements for algorithm updates. Compare your drop to competitor accounts. Cross-reference with a 7-day and 30-day average to rule out single-day anomalies. |
| Reach and impressions differ significantly | Reach counts unique accounts; impressions count all displays (repeat viewers). This is expected. | Monitor both metrics together. High reach, flat impressions suggests new audience acquisition. High impressions, low reach suggests existing followers engaging repeatedly. Both are healthy signals. |
| Third-party analytics tool numbers differ from native platform analytics | Third-party tools may use different counting methods, apply filters automatically, or experience data sync delays | Always validate third-party figures against native platform analytics. Investigate discrepancies before reporting to stakeholders. Use native analytics as the source of truth. |
| Viral post skews monthly average metrics | Single anomalies affect month-on-month comparison | Analyse the viral post separately (format, timing, topic, hook). Test whether similar content delivers consistent results over 4-6 weeks. Treat as a learning moment, not a strategy shift. Include context in stakeholder reports. |
| Geographic audience data unavailable in regulated regions | GDPR, PDPA and other privacy laws restrict granular demographic reporting | Accept legal data boundaries; do not treat absence of data as platform error. Work with available segmentation (device type, language, broad region). Focus on behaviour metrics instead of demographics. |
Frequently Asked Questions
How Often Should I Check My Social Media Analytics?
Weekly checks (a 15-minute Friday review) prevent you from missing anomalies and ensure month-end analysis is accurate. Checking daily often leads to knee-jerk reactions to single posts and burnout. A weekly rhythm balances responsiveness with sustainable habits.
What’s a “Good” Engagement Rate Across Platforms?
Engagement rates vary significantly by platform, account age, audience size and industry. Instagram and Facebook typically see 2–5% as healthy engagement; 5%+ is considered strong. TikTok typically achieves 3–5% engagement; 8%+ is excellent. YouTube’s health is better measured by average view duration (4+ minutes) and 50%+ relative audience retention. LinkedIn companies typically see 1–3%; creators often achieve 3–5%+. Use your own 90-day average as your baseline rather than external benchmarks, since your specific context will vary.

Should I Care More About Followers or Engagement Rate?
Engagement rate. A smaller, highly engaged audience is more valuable for algorithm promotion and conversions than a large, disengaged audience. Platforms prioritise content with high engagement, so improving engagement rate can indirectly grow followers faster. Pursue followers as a side effect of strong engagement, not as a primary goal.
How Do I Know If a Drop in Engagement Is an Algorithm Change or My Content Getting Worse?
Check if the drop affects all your content uniformly (suggests an algorithm change) or only certain content types (suggests a content issue). Compare your performance trend to competitor accounts and official platform announcements. If competitors also saw drops on the same dates, it is likely algorithmic. If only your account dropped, it is content-related.
Can I Trust Platform Analytics, or Should I Use Third-Party Tools?
Platform analytics are trustworthy and the primary source of truth. Third-party tools are useful for cross-platform dashboards and historical tracking, but always validate their numbers against your native platform analytics. Never trust only a third-party tool. If a third-party tool’s numbers differ materially from native analytics, investigate the discrepancy before acting. Important: platform metrics are subject to change and may be affected by algorithm updates or technical adjustments; cross-verify insights with owned analytics tools (such as Google Analytics 4) when tracking offline conversions.
How Do I Turn Insights Into a Content Calendar?
Use your Content Audit results to identify top-performing formats and topics. Allocate roughly 50% of next month’s content to formats that performed well (with slight variations to test), 30% to emerging opportunities and 20% to experiments. Build this into your calendar at the start of each month, then review mid-month to adjust if early results diverge from your hypothesis.
What Do I Do If My Best-Performing Content Doesn’t Align With My Brand Values?
This is a real tension. If educational content outperforms your main product-focused content, you have three options. Option one: lean into education and reposition your brand messaging around solving customer problems rather than selling. Option two: test whether a blend of education and product content maintains engagement while staying true to your brand. Option three: accept that your current audience does not perfectly match your target and slowly shift content to attract a new audience (this takes months). Do not publish content you are uncomfortable with just because it performs; that leads to burnout and inauthenticity.
Should I Ignore a Viral Post if It Doesn’t Match My Overall Strategy?
One viral post is not a strategy. If you achieved 50,000 views on a topic outside your core focus, analyse what made it work (format, timing, hook, topic), but do not overhaul your calendar for one anomaly. Test whether a similar format or topic delivers consistent results over 4–6 weeks. If it does, consider whether it deserves permanent calendar space. If it does not, treat it as a learning moment and move on.
What’s the Difference Between Reach and Impressions, and Which Should I Prioritise?
Reach is the number of unique accounts that see your content; impressions count total displays, with the same person counted multiple times if they see your post repeatedly. Prioritise reach for audience growth and impressions for engagement depth. If your reach is growing but impressions are flat, you are attracting new people, but they are not returning. If impressions are deep but reach is low, your existing followers engage repeatedly. Monitor both metrics together to understand your audience behaviour.
How Do I Account for Seasonal Dips When Reporting Performance to Stakeholders?
Always compare year-on-year or same-period-last-month. If December 2024 engagement is lower than November 2024, flag it as seasonal context: “December engagement typically dips 15–25% due to holiday disruption. Our December 2024 dip of 18% is in line with historical patterns.” Include a forward-looking statement: “We expect January to recover to November levels based on 3-year data.” This prevents panic over normal seasonal variation and sets realistic expectations.
What Metrics Should I Track if I’m Building Community Rather Than Driving Sales?
Community-focused metrics: comment sentiment (are discussions positive or negative?), repeat commenter count (who returns?), share rate (do people amplify your posts?), and direct message volume and tone. Engagement rate and reach matter, but are secondary. Prioritise depth of interaction over breadth. A post with 20 thoughtful comments is stronger for community than one with 200 likes and no discussion. Track also which topics or formats spark conversation and who your most active community members are.
Should I Post Every Day to Maximise Reach and Engagement?
No. Posting frequency matters less than consistency and quality. Most platforms prioritise engagement rate, not post count. Posting five times weekly with an average 3% engagement beats posting daily with 0.5% engagement. Start with 3–4 consistent posts per week on your primary platform. Track engagement rate. If it drops as you increase frequency, dial back. If it holds or improves, test increasing. Find your sustainable rhythm; for most accounts, this is 3–5 times per week.