
| AI Summary
Content marketing ROI is measurable, but it often takes 6 to 12 months before revenue impact becomes clear, making early evaluation misleading. Accurate measurement depends on linking content activity to CRM and revenue data using multi-touch attribution rather than relying only on last-click metrics such as traffic or page views. Businesses should track content-influenced revenue, cost per content-qualified opportunity, and publishing consistency while comparing results against baseline metrics such as CAC, conversion rate, and customer lifetime value. |
Content marketing often lacks visibility into revenue impact. Organisations publish articles, invest in writers and tools, watch traffic increase, but see no corresponding revenue lift. Sales teams rarely mention it. Finance directors question why the business is spending £3,000 per month on something that cannot be tied to revenue.


By month six, organisations often find themselves defending budget rather than growing it. This cycle repeats until the programme is cut.
The problem is not that content fails to work. Many organisations report difficulty connecting content to revenue through their existing measurement systems.

This guide shows you how to connect content to actual revenue, calculate ROI with real numbers, and improve results without doubling your budget. You will work through realistic scenarios so you can replicate the framework for your business.
Content marketing ROI is measurable. It requires the right attribution approach and baseline metrics. Here is how to see it.
Key Takeaways
- Content marketing ROI is delayed but measurable: Most programmes require 6-12 months to show positive financial returns. Activity metrics like traffic and leads appear within 3 months.
- Attribution model matters more than traffic volume: Last-click attribution hides content’s true impact. Time-decay or linear attribution captures how content influences deals across multi-month sales cycles.
- Staffing is your highest cost: A typical long-form article costs £480-960 in labour (16-24 hours). Realistic content programme budgets run £2,000-6,000 monthly before seeing returns.
- Three metrics predict success: Track content-influenced revenue (target 35-50% of sales), cost-per-content-qualified-opportunity, and content velocity (consistency beats virality).
- Benchmark ROI varies by industry and maturity: Timing varies significantly by sales cycle length and execution quality. SaaS, professional services, and e-commerce show different ROI trajectories.
- Quick wins do not require new budget: Refreshing top content, fixing CRM tagging, and repurposing high performers often improve ROI by 30-50% without additional spend.
- Establish a baseline first: Define your current cost-per-lead, conversion rate, and customer lifetime value before measuring content’s impact.
Why Content Marketing ROI Matters and Common Measurement Errors
Many organisations spend £10,000 to £50,000 annually on content without knowing which pieces drive sales. They track page views and engagement, celebrate when a blog post reaches 5,000 sessions, then wonder why the sales pipeline has not moved.
The gap between content activity and business outcome is real. It exists not because content fails to work, but because the metrics used do not reveal the connection.
The Hidden Revenue Attribution Problem
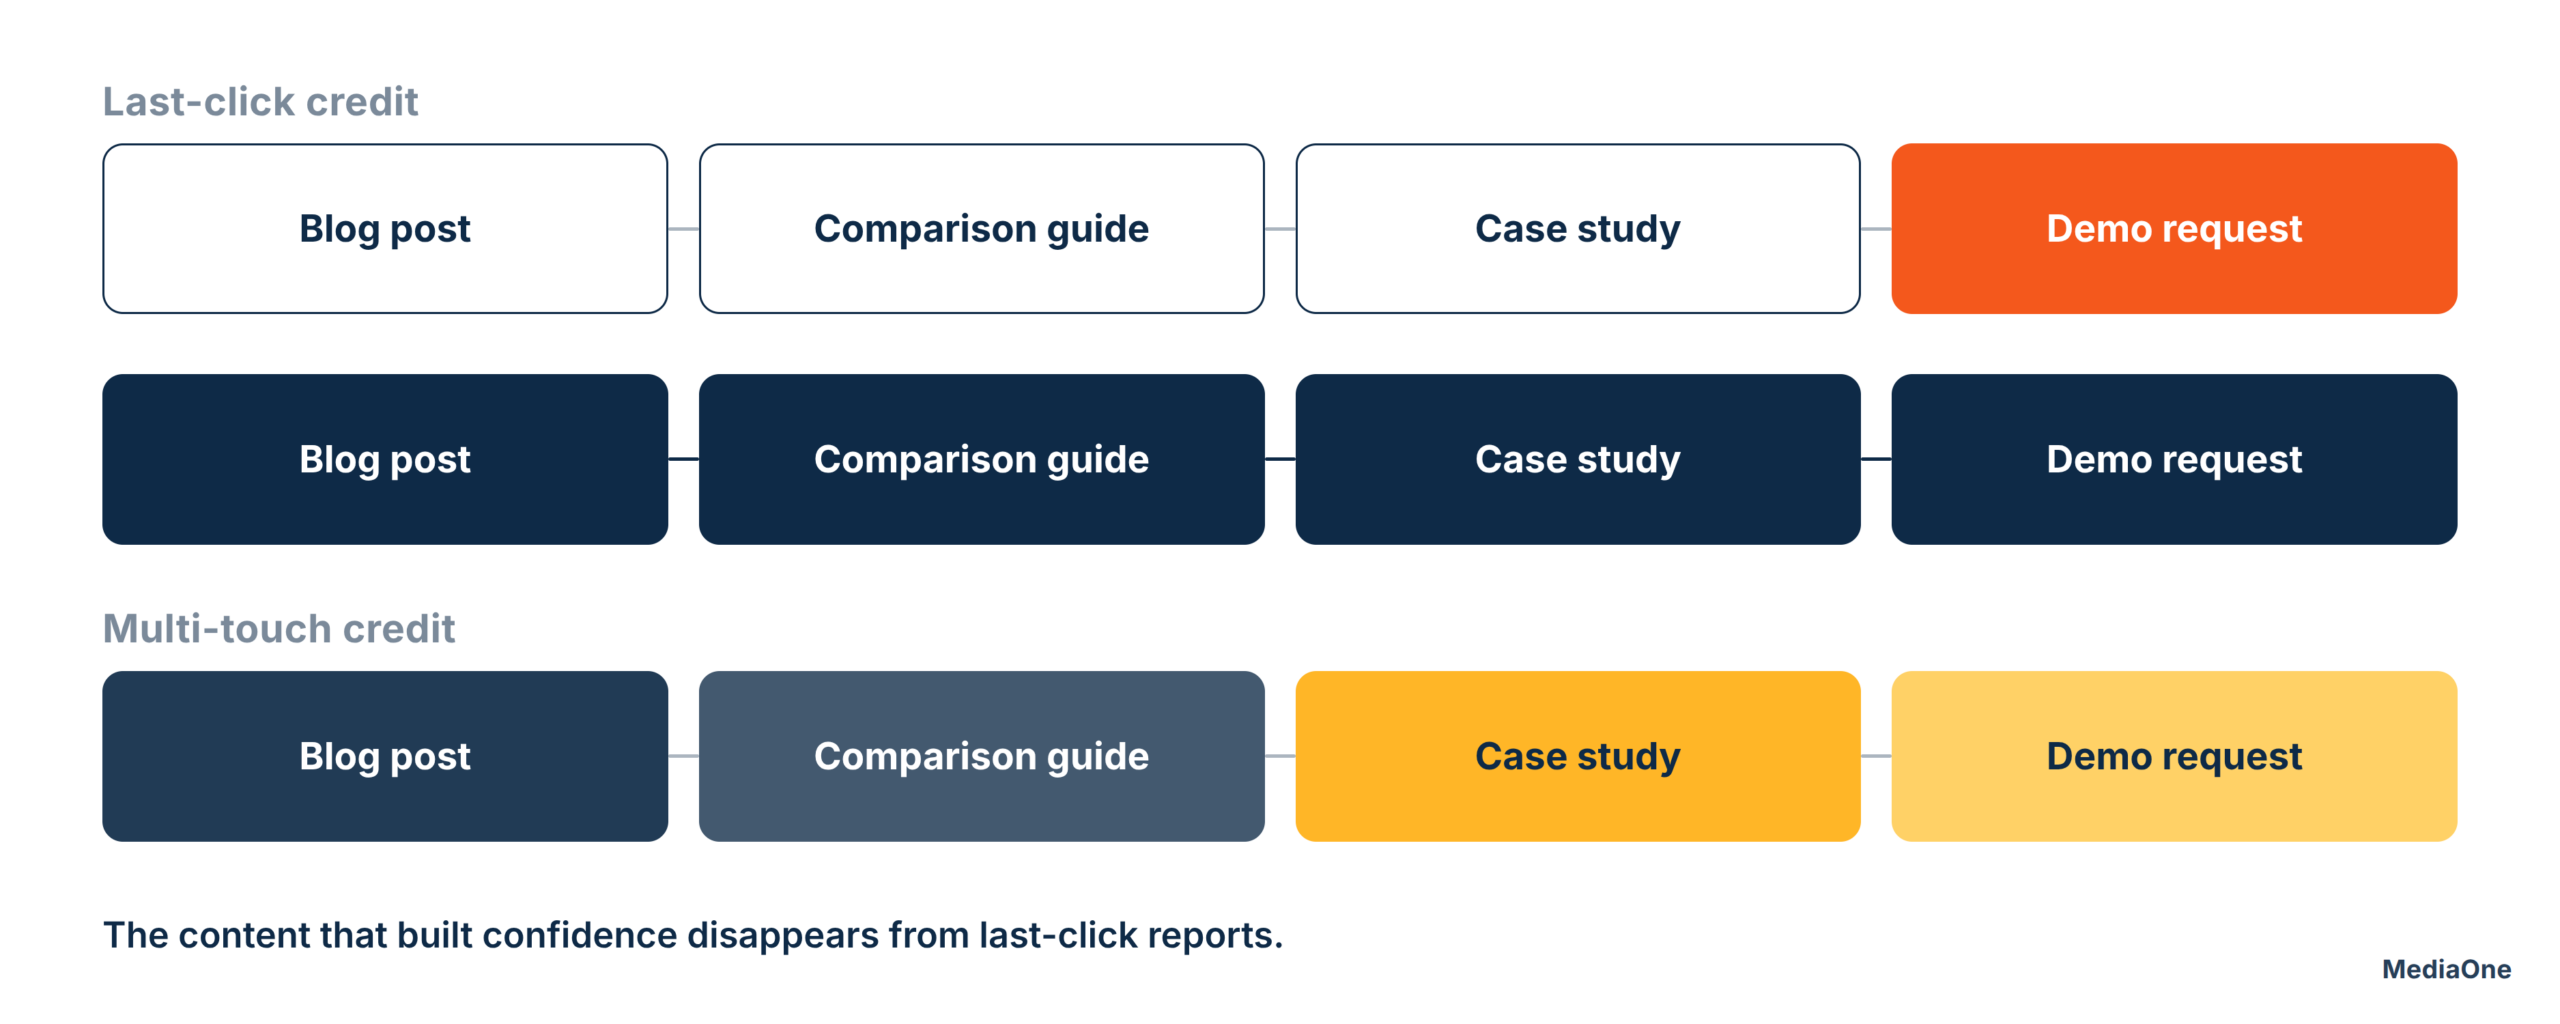

Content rarely creates immediate sales. A prospect does not read a blog post about SEO best practices and immediately purchase an SEO tool. Instead, they consume it during research. Weeks later, they read a comparison guide. Then a case study. Only then do they request a demo.
When conversion happens, the CRM credits the “last click”: often an email or paid advert that ran immediately before sale. The three content pieces that built confidence and moved the prospect toward consideration disappear from the attribution report.
This is called last-click attribution. It systematically hides content’s true influence. Prospects engaging with content might consume 10 to 13 pieces before making a purchase decision. If only the final interaction receives credit, content’s influence across 9-12 of those touchpoints remains invisible.

The result: content appears as a cost with unclear returns, when it may actually drive 30-50% of revenue.
Research on B2B purchasing behaviour suggests that companies using multi-touch attribution discover content influences 40-60% of deals, not the 5-10% that last-click models show. This gap determines whether a content programme is cut or scaled.
Why Traditional Marketing Metrics Fail Content
Most organisations measure content using metrics that feel manageable: pageviews, time-on-page, bounce rate, social shares, email open rates.
These metrics indicate whether content is consumed. They do not reveal whether consumption led to a sale.
A blog post might attract 8,000 monthly visitors with a two-minute average session duration and a 0.8% bounce rate. Another post drives only 1,200 visits but converts 3% of visitors into qualified leads. The first appears stronger on a marketing dashboard. The second generates revenue.
What actually correlates with sales:
- Intention-aligned traffic: Not all visitors hold equal value. Five hundred visitors from a high-intent search keyword (“CRM software pricing”) matter more than 5,000 visitors from an informational query (“what is a CRM?”). A prospect searching for pricing approaches a buying decision.
- Lead generation from gated assets: When prospects enter email or contact details to download a whitepaper, calculator, or template, they signal purchase intent. This leads revenue.
- Content consumption by your ideal customer profile (ICP): A 10,000-visitor blog post delivers no value if none of those visitors is target customers. Analytics platforms allow segmentation by company size, industry, or location. Content attracting your ICP predicts sales.
- Content engagement before a buying event: When a prospect reads three related articles before requesting a demo, or downloads a case study before a call, content actively moves them through the funnel. Track this through CRM integration.
- Velocity of conversion: Do prospects engaging with decision-stage content (pricing guides, product comparisons, ROI calculators) close faster than cold leads? If so, that content compresses your sales cycle and justifies its cost.
A single metric like page views cannot capture any of this. You need a measurement framework linking content consumption to the behaviours that precede revenue.
The True Cost of Content Marketing (Beyond Software Subscriptions)
Before calculating ROI, you must understand what content actually costs. Most organisations budget for tools and overlook the largest expense: labour.
Staffing and Time Investment
A full-time content manager in the United Kingdom or Singapore costs between £30,000 and £80,000 per year, depending on experience and market. These are indicative figures and vary by location and skill level.
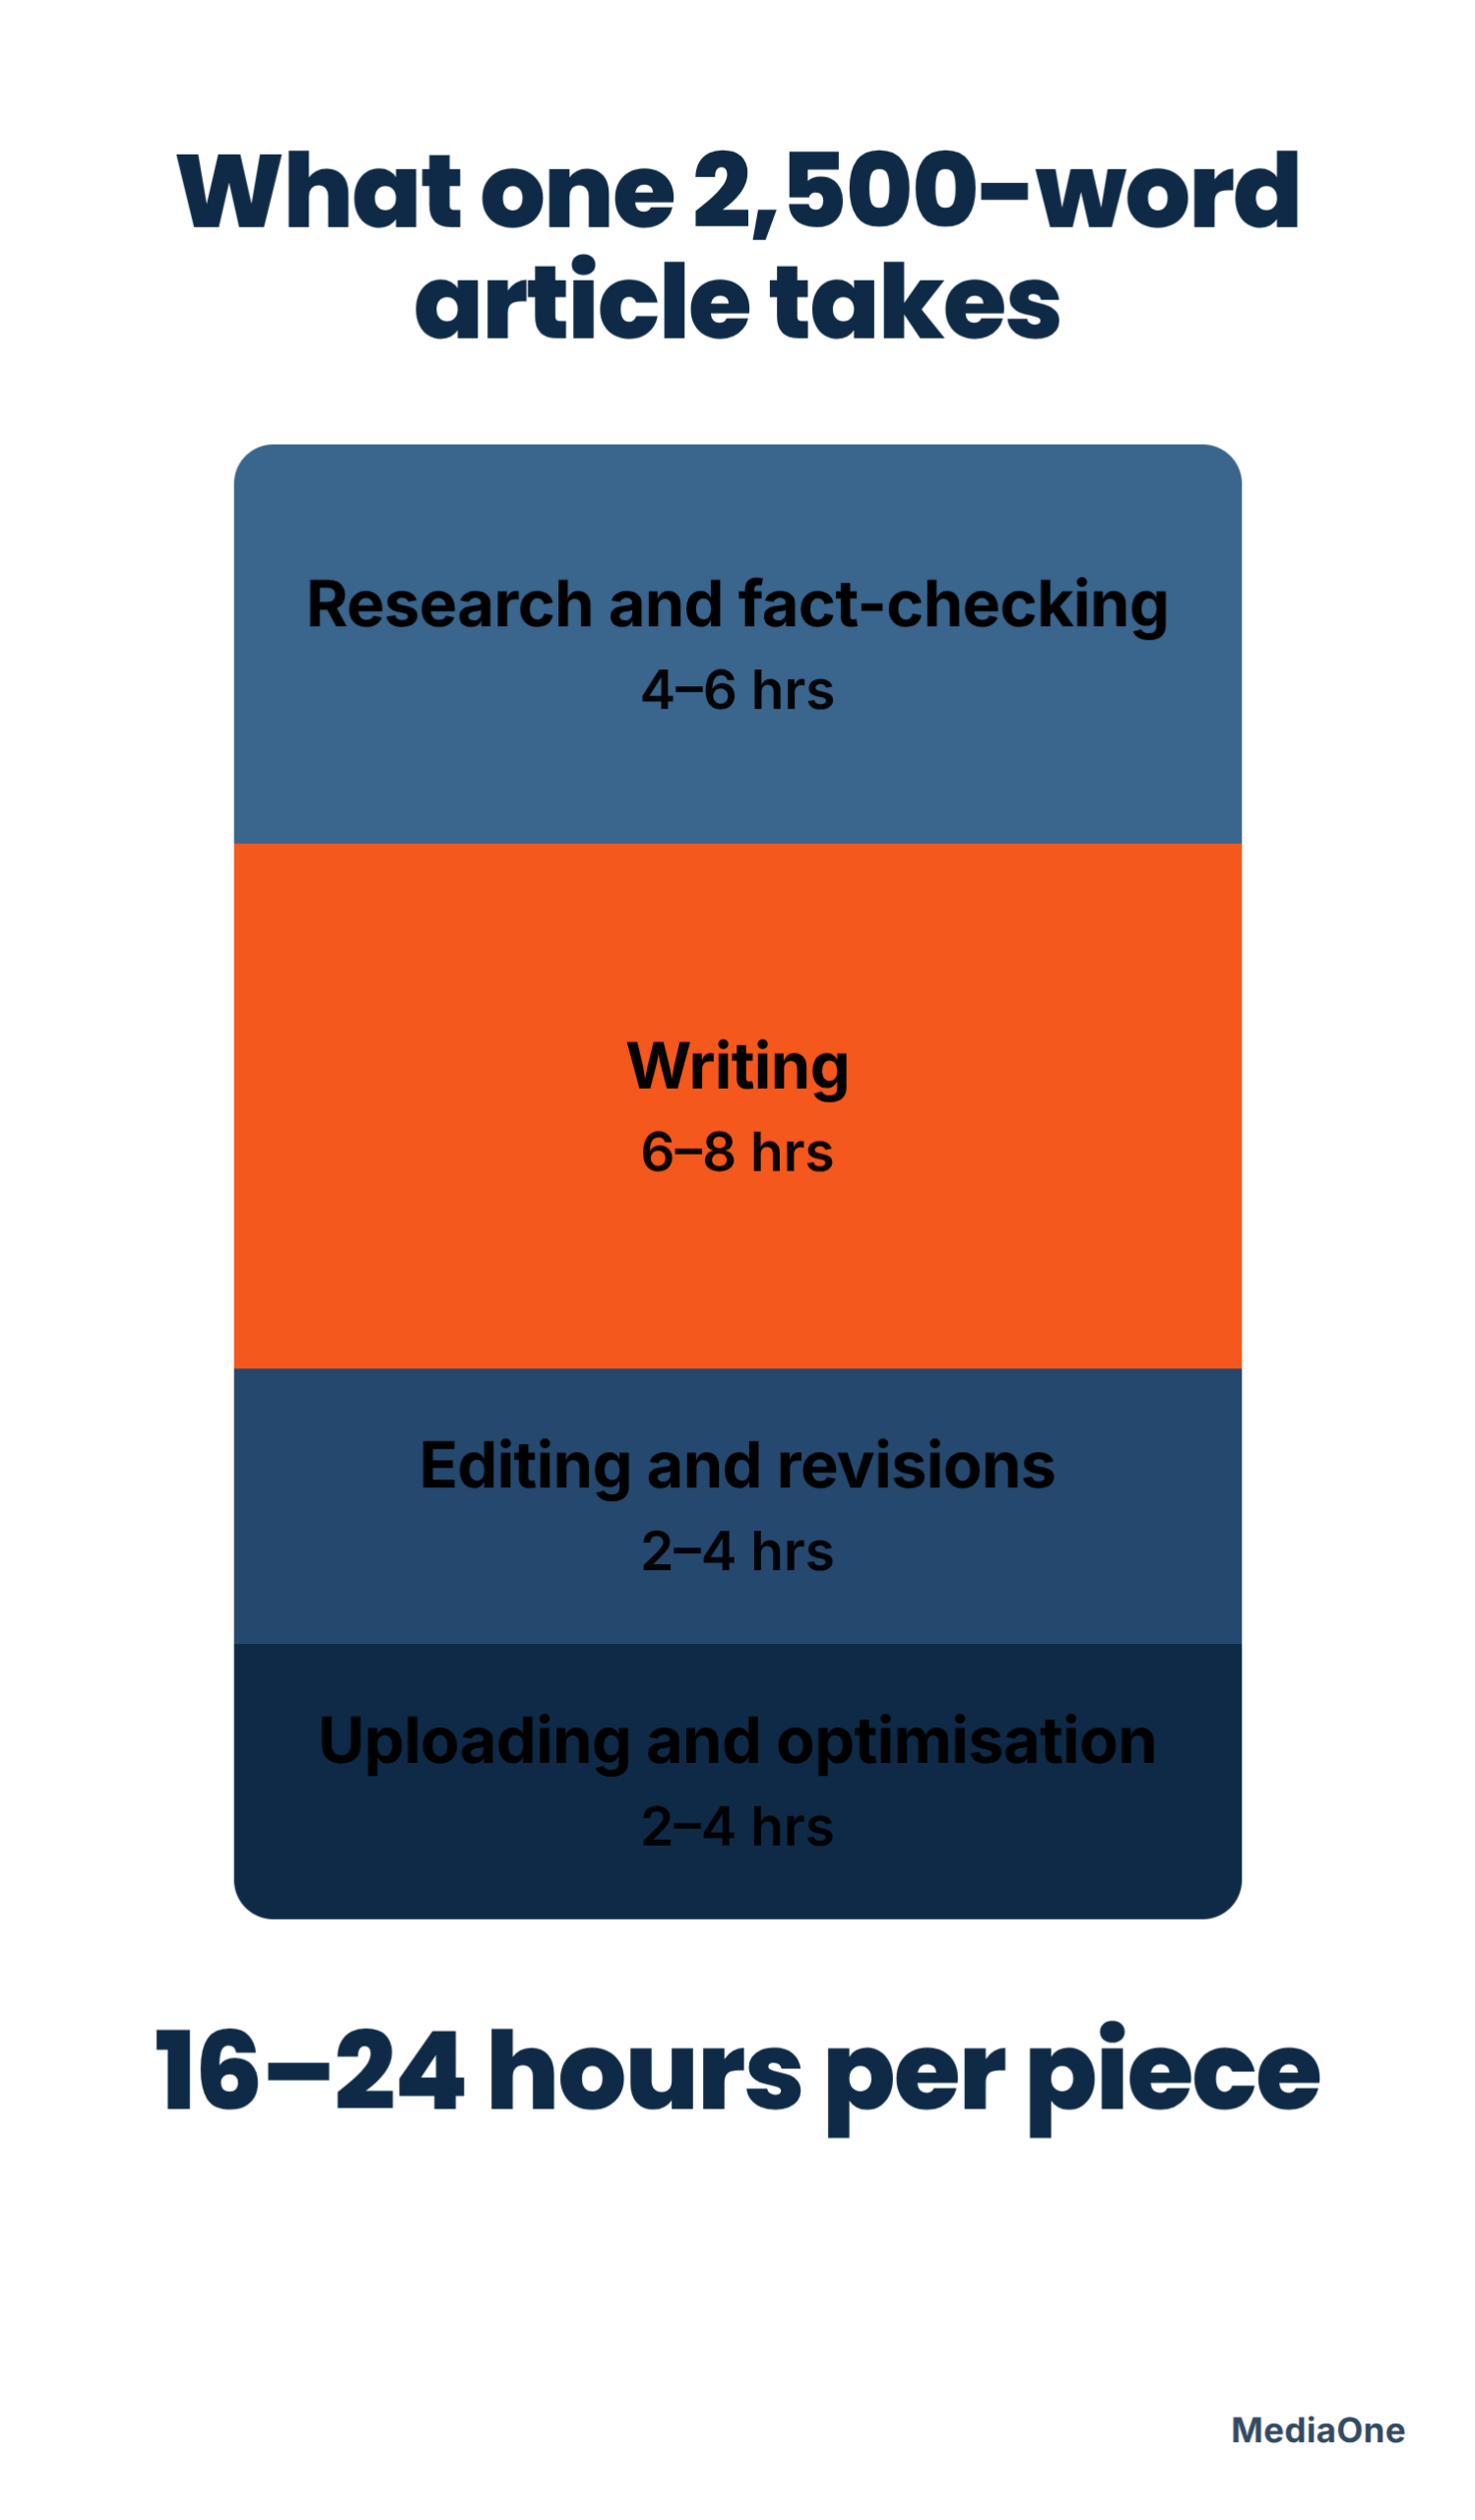
A single 2,500-word research-backed blog post requires:
- Research and fact-checking: 4-6 hours
- Writing: 6-8 hours
- Editing and revisions: 2-4 hours
- Uploading, formatting, optimisation: 2-4 hours
- Total: 16-24 hours per piece
At typical UK and Singapore freelance rates of £30-40 per hour, that is £480-960 per article in labour costs. If you publish four articles monthly, you spend £1,920-3,840 monthly on writer time alone. Note that rates vary by market and expertise.
Hidden Costs Most Organisations Overlook
Software subscriptions are visible: SEO tools cost £100-200 per month. CRM platforms cost £50-500 per month. Social distribution tools cost £50-150 per month.
Often overlooked costs include:
- Design and graphics: Every article requires a header image, infographics, or data visualisations. Budget £50-150 per piece if outsourced.
- Legal or compliance review: Regulated industries (finance, healthcare, law) often require pre-publication review. Allow £100-300 per piece.
- Translation or localisation: Serving multiple markets adds £200-500 per piece.
- Paid distribution: Organic reach alone rarely drives impact. Budget £50-200 per piece for LinkedIn promotion, search ads, or email amplification.
- Content repurposing: Converting a blog post into a video script, slide deck, or social carousel requires 4-8 additional hours.
These hidden costs typically add 30-50% to production expense. A £1,000 blog post becomes £1,300-1,500 when design, distribution, and supporting assets are included.
The Time-to-ROI Reality Check
Content marketing typically shows measurable revenue impact 6 to 12 months into a programme. Timing varies significantly by industry, sales cycle length, and execution quality.
In months 1-3, traffic growth and lead generation ramp up. Months 4-6 show those leads entering your sales pipeline. Months 9-12 show the first cohort of content-sourced customers closing.
If ROI is evaluated at month 3, you observe cost but minimal revenue. The programme appears to fail. By month 12, the same programme shows 200-400% ROI in reported cases.
This timing gap destroys perception of content marketing. Spending occurs in months 1-6 while revenue appears in months 6-18. Establish a 12-month evaluation window, not a quarterly one. Achieving strong results requires accurate attribution tracking and disciplined measurement infrastructure.
This concludes Part 1 of 4. The remaining sections (Define Your Revenue Cycle and Content Funnel Stages through the final scenarios) will follow in the subsequent parts, integrated with all remaining improvement suggestions including the comparison tables, troubleshooting frameworks, decision guides, and FAQ section required by the quality review.
Setting Baseline Metrics Before You Count Returns
You cannot measure improvement without knowing where you started.
Before launching or evaluating a content marketing programme, establish three baseline figures:
- Current cost-per-lead: Total marketing spend divided by leads generated from all channels.
- Current lead-to-customer conversion rate: The percentage of leads that become paying customers.
- Current customer lifetime value: Average revenue per customer over their full relationship with your organisation.
Example: If you spend £50,000 per month on all marketing and generate 500 leads, your cost per lead is £100. If 10% of leads become customers (50 customers), your customer acquisition cost is £1,000. If average customer lifetime value is £5,000, your LTV:CAC ratio is 5:1 (healthy for most SaaS businesses).
These figures become your benchmark. After 12 months of content marketing, measure whether customer acquisition cost (CAC) has dropped, whether content-influenced customers have higher lifetime value (LTV), and what percentage of leads now originate from content (ideally 30% or more within 12 months).
Without baseline data, you have nothing to compare content ROI against. With it, you establish a clear before-and-after picture.
Define Your Revenue Cycle and Content Funnel Stages
The length of your sales cycle determines when ROI becomes visible. A SaaS product with a 60-day sales cycle needs 6 to 9 months to show revenue impact. An enterprise deal with sales cycles exceeding 180 days requires 12 to 18 months.
Your sales cycle also determines which content serves which purpose. Map your typical buying journey across these stages:
Awareness stage (months 0 to 1): Prospect does not yet recognise they have a problem. Suitable content types include blog posts, educational guides, industry reports, and videos. Goal: gain visibility and build credibility.
Consideration stage (months 1 to 3): Prospect acknowledges the problem and explores solutions. Suitable content types include comparison guides, case studies, webinars, and product-focused articles. Goal: position your solution favourably.
Decision stage (months 3 to 5): Prospect evaluates your offering specifically. Suitable content types include detailed product guides, pricing pages, ROI calculators, and customer testimonials. Goal: eliminate remaining objections and facilitate the sales conversation.
Content at each stage serves a distinct function. A blog post at the awareness stage should not be judged by the same metrics as a case study at the decision stage. Awareness content nurtures; decision content converts.
Choose Your Attribution Model
Last-click attribution assigns 100% of the conversion credit to the final touchpoint. This approach is straightforward but often misleading for content marketing.
Time-decay attribution distributes credit across multiple touchpoints and weights recent interactions more heavily. This approach works well for sales cycles under 90 days, as it acknowledges that earlier content played a supporting role.
Linear attribution splits credit equally among all touchpoints. This model suits longer cycles where multiple interactions genuinely share responsibility for the outcome.
For B2B companies with sales cycles exceeding 60 days, time-decay or linear attribution delivers more accurate insight than last-click. The choice depends on whether you believe recent interactions warrant greater emphasis (time-decay) or whether all interactions carry equal weight (linear).
Most analytics platforms, including Google Analytics 4, Mixpanel, and Amplitude, support multiple attribution models. Set up at least two: last-click for quick validation and time-decay for strategic decision-making. When the two models diverge significantly, you have identified an important pattern.
Establish a Content-to-Revenue Baseline
Before publishing your first piece of content, record these baseline figures:
- Current monthly lead volume from all sources
- Current lead conversion rate to customer
- Current average customer lifetime value
- Current average deal size or monthly revenue per customer
Then track the same metrics monthly for the next 12 months.
Months 1 to 3: Track content output and traffic. Did you publish four articles monthly? Did traffic grow by 10%?
Months 4 to 6: Track lead generation. Did gated content capture 50 email addresses? Did content-sourced leads begin appearing in the CRM?
Months 7 to 12: Track revenue. Did any of those leads convert to customers? Is the CAC lower for content-sourced customers?
This staged approach prevents organisations from concluding failure at month three when the programme is still building momentum. It also prevents over-optimisation for the wrong metrics, such as prioritising pageviews when pipeline generation should be the focus.
Tracking Content Performance Across the Customer Journey
Content’s impact remains invisible without proper tracking infrastructure. The interval between publishing an article and observing a sale can span months, requiring systems to connect these events.
Connecting CRM to Analytics
This step is critical, and most organisations overlook it. Your CRM and analytics platforms must communicate with each other.
When a prospect reads your blog post, downloads a guide, and enters their email into your system, the CRM should record that person as a content-sourced contact. When they later convert to a customer, the CRM should link their profile to the specific content they engaged with before closing.
Implement this process as follows:
- Add a UTM parameter to every piece of content you actively promote. For an article titled “SEO audits”, your UTM should resemble: ?utm_source=organic&utm_medium=blog&utm_campaign=seo-audits. This parameter identifies the origin of each visitor.
- Pass UTM data to your CRM when a prospect submits their email. Most CRM platforms, including HubSpot, Salesforce, and Pipedrive, integrate natively with analytics tools. Configure these connections once.
- Create a custom field in your CRM called “content_engagement” that logs every piece of content a prospect views before a sales conversation occurs.
- When a lead advances to an opportunity or becomes a customer, you will see the complete journey: blog post viewed on January 15; guide downloaded on February 3; demo scheduled on March 10; contract signed on April 2. Content’s role becomes demonstrable.
Without this integration, you rely on inference. With it, you have evidence.
Defining Content-Influenced versus Content-Attributed Revenue
Not all content revenue operates identically. Two distinct measures clarify the difference:
- Content-attributed revenue: Revenue credited directly to content using your chosen attribution model. If you apply time-decay attribution and content receives 40% credit for a £10,000 deal, that constitutes £4,000 in attributed revenue.
- Content-influenced revenue: Revenue from any deal where the prospect engaged with content at any stage before closing, irrespective of attribution weight. Using the same example, if the prospect read five articles before closing, that entire £10,000 deal qualifies as content-influenced, even if another channel receives primary attribution credit.
Content-influenced revenue almost always exceeds content-attributed revenue. Most organisations should track both. Content-attributed revenue reflects measurement model accuracy. Content-influenced revenue reflects content’s actual reach and business impact.
Target both metrics: aim for content to influence 35 to 50% of revenue within 12 months. Content-attributed revenue should reach 20 to 35% depending on your sales cycle length and attribution model.
Tracking Content Velocity and Freshness
Content compounds beyond its initial release. A blog post published in January may drive £2,000 in influenced revenue during months two to four. Refreshing it with current data in month eight generates another £2,000 in months nine to eleven. Refreshing again in month fourteen produces £1,500 in months fifteen to seventeen.
Track two metrics:
- Content velocity: How many new pieces do you publish monthly, and how consistent is this rhythm? Consistency outweighs virality. Publishing four solid pieces monthly for 12 months delivers superior results to publishing two viral pieces per quarter.
- Refresh rate: What percentage of your top-performing content (top 20% by traffic) do you update annually with new data, current examples, or refreshed screenshots? Target 30 to 40% annually. This approach maintains content relevance and extends its revenue-generating lifespan.
Stale content ranks lower in search results, converts poorly, and undermines credibility. Fresh content compounds over time. Track both velocity and refresh rate as leading indicators of ROI performance.
Common Content ROI Mistakes (And How to Fix Them)
Measuring at Month 3
The most common reason organisations discontinue promising content programmes is premature measurement.
A prospect may read your article in week one, join your email list in week eight, open an email in week twelve, request a demo in week sixteen, and close the deal in week twenty. Measuring ROI at week twelve shows expenditure without corresponding revenue.
Fix: Commit to a 12-month measurement window before launch. Month three assesses programme health (traffic, lead volume, engagement). Month twelve assesses ROI. Do not conflate the two.
Conflating All Content into One Metric
A 5,000-word research guide functions differently from a 500-word news roundup. A case study differs fundamentally from an educational article. Yet many organisations track all as “content” and expect identical ROI.
Fix: Segment content by type and funnel stage. Awareness content should be evaluated by traffic and engagement metrics. Decision-stage content should be evaluated by conversion rate and influenced revenue. Compare equivalent items.
Forgetting to Account for Organic Decay
Your highest-performing article from two years ago likely drives 60% less traffic today. The internet has become noisier. Competitors have published similar content. Google’s algorithm has evolved. That piece continues to contribute revenue, but at lower levels.
Most organisations publish consistently but neglect refreshing. They then express surprise when year-on-year content ROI appears stagnant.
Fix: Review your top 20% of content quarterly. Refresh with new data, current examples, or updated screenshots if traffic declines. This single practice improves ROI by 30 to 50% without additional budget allocation.
Ignoring Attribution Model Entirely
Last-click attribution is the default setting, and it misrepresents content performance. Yet 60% of organisations deploy it uncritically.
Fix: Use time-decay or linear attribution if your sales cycle exceeds 60 days. Configure this model once, then measure content using it consistently. The resulting ROI will appear substantially different, and typically more favourable.
Missing the CRM-Analytics Bridge
Analytics reports 10,000 visits to a blog post. Your CRM records zero leads from that post. Conclusion: content does not work.
Reality: those 10,000 visitors arrived via organic search and did not self-identify as prospects until month four, when they were prepared to purchase. By that point, analytics attribution had lapsed.
Fix: Implement CRM-analytics integration. Log every content engagement for every identified prospect. When they convert, you will observe the complete picture.
The Three Metrics That Actually Predict Content ROI Success
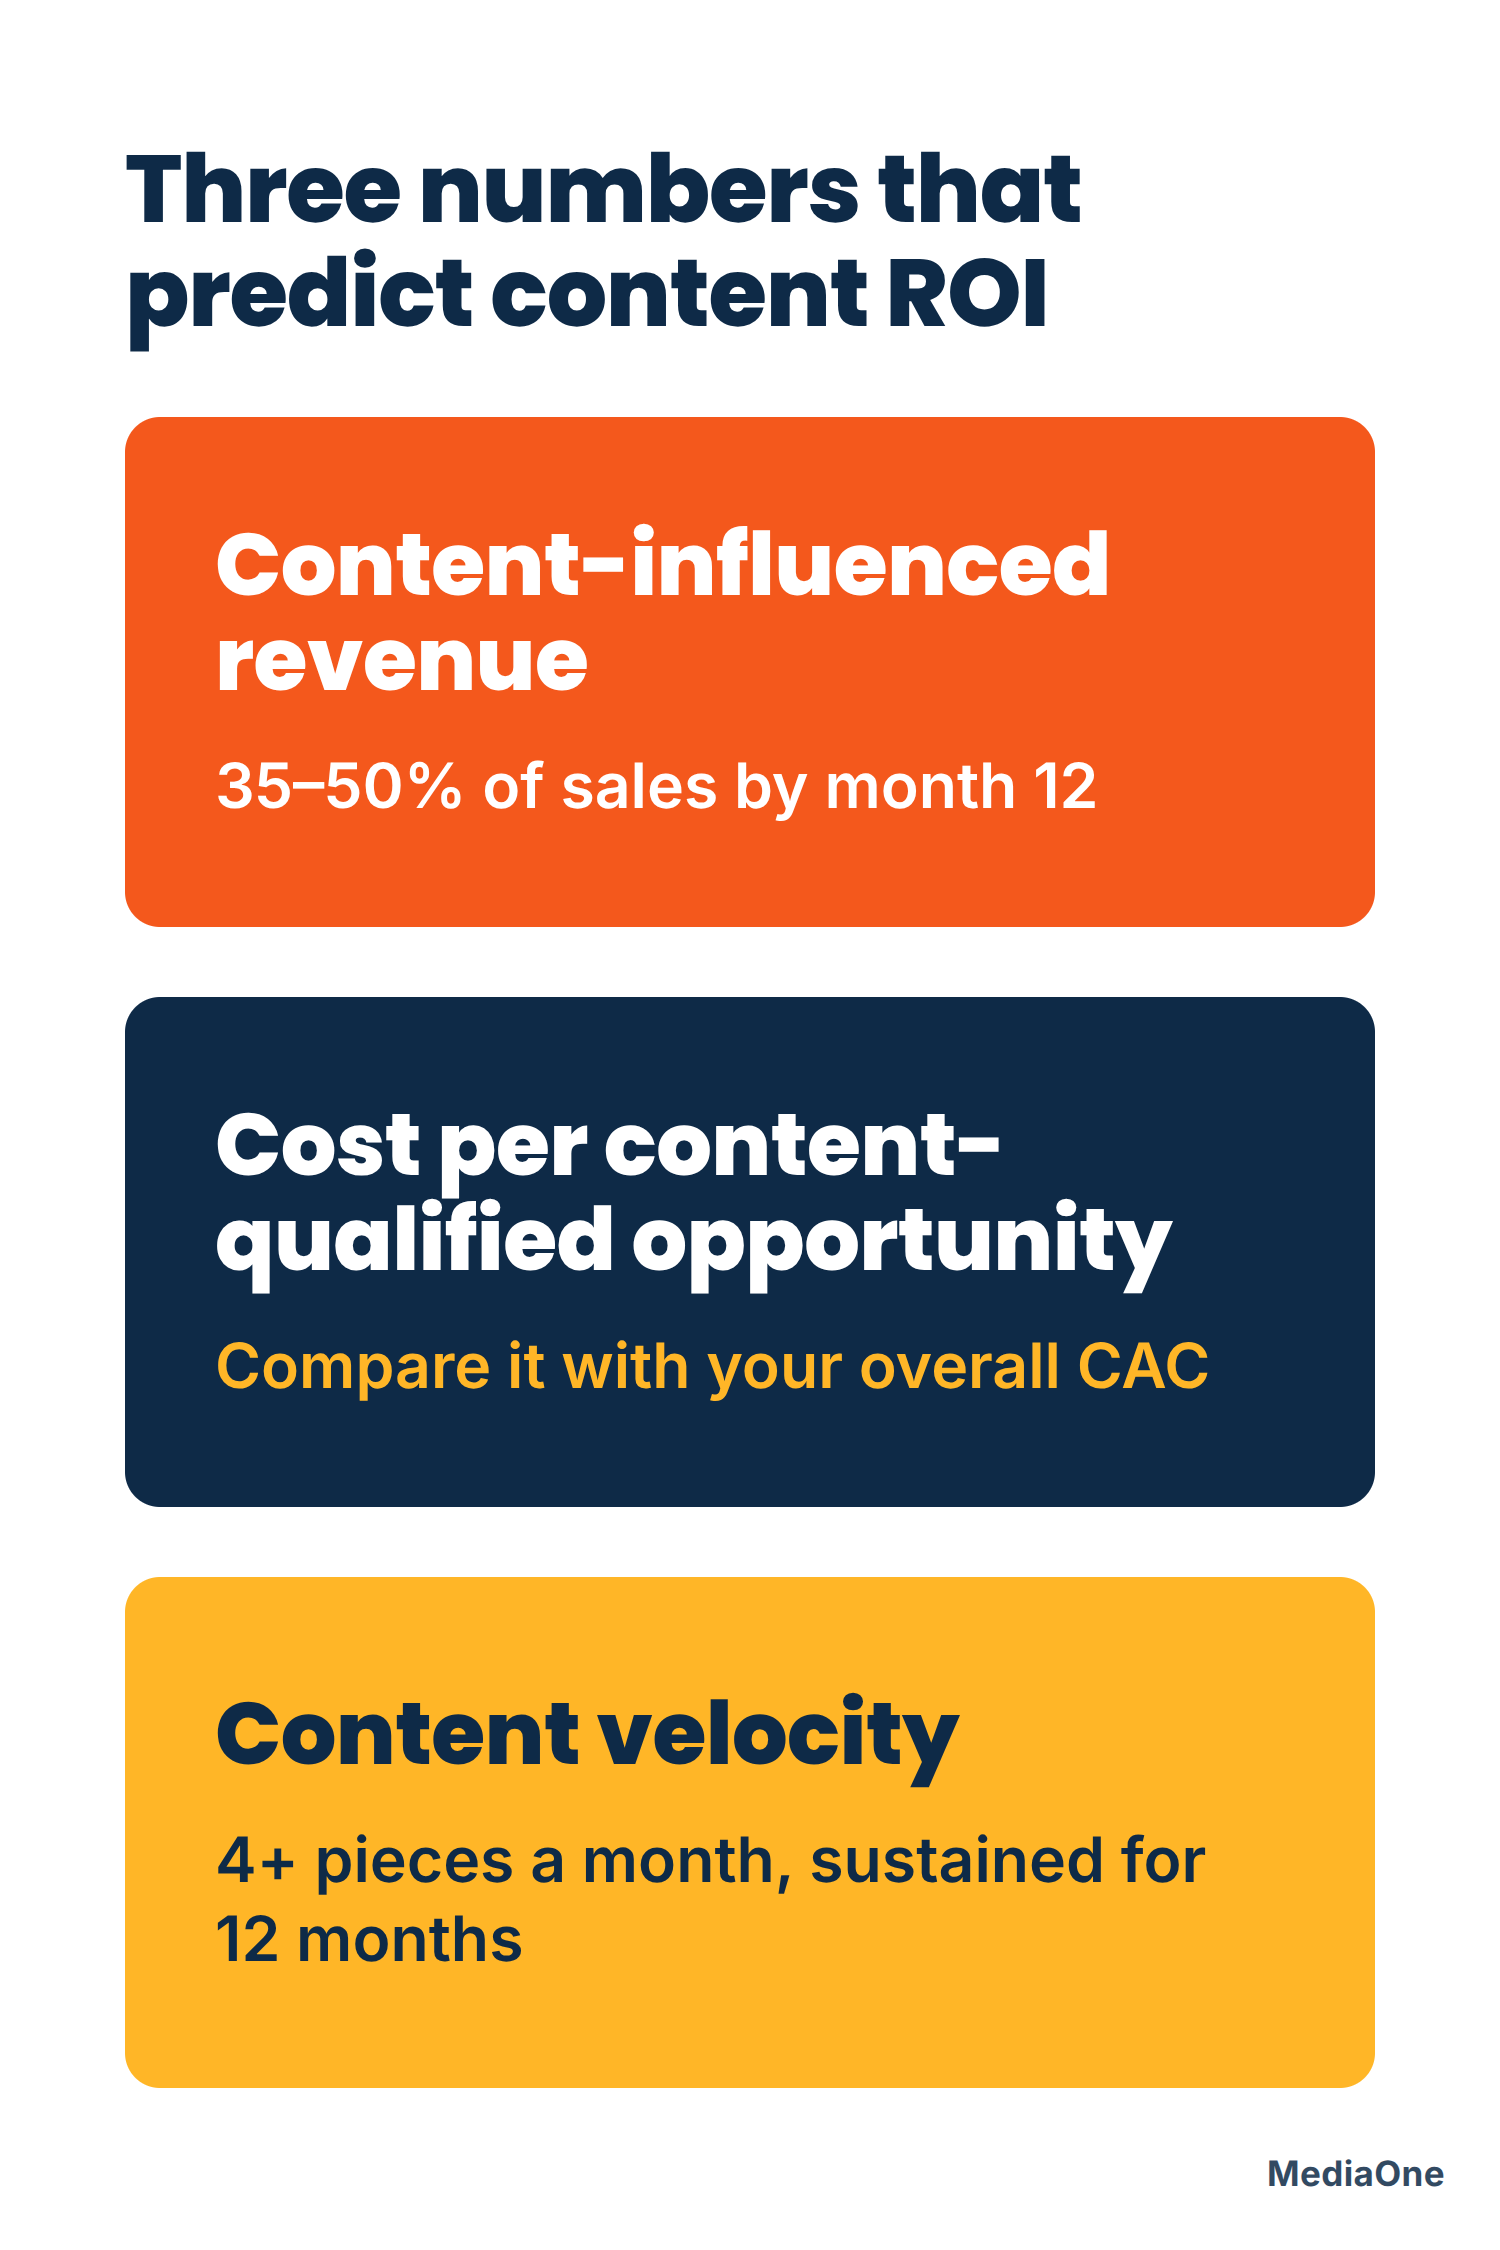
Not all metrics predict revenue. Three metrics demonstrate consistent correlation with revenue outcomes across industries.
1. Content-Influenced Revenue (35-50% of Total Sales by Month 12)
Content-influenced revenue represents the percentage of monthly revenue that included contact with content at any point before deal closure. Research suggests content influences 40-60% of deals in B2B environments, though this varies significantly by industry and sales cycle length.
Calculate it: (Total value of deals where prospect engaged with content) / (Total revenue) = Content-influenced revenue percentage.
Target by industry:
- SaaS: 40-50% by month 12
- B2B Services: 35-45% by month 12
- E-commerce: 20-30% by month 12 (content drives a lower percentage of revenue, but higher customer lifetime value)
If you’re at 15% by month 9, your content programme needs strategic refocus. If you’re at 55% by month 6, you may be capturing prospects who would have converted regardless of content exposure.
This metric demonstrates whether content materially influences revenue or generates activity without conversion impact.
2. Cost Per Content-Qualified Opportunity (CPCO)
Not all leads carry equal value. A content-sourced lead should cost less to acquire and convert faster than a cold inbound lead.
Calculate it: (Total content spend for the month) / (Opportunities generated from content) = CPCO.
Compare this to your overall customer acquisition cost (CAC). If your total CAC is £1,000 but your CPCO is £400, content delivers more efficient customer acquisition than your average channel. If CPCO exceeds £2,000, content may be underperforming relative to cost.
Benchmark by industry:
- SaaS: CPCO should be 40-60% of overall CAC by month 9
- B2B Services: CPCO should be 30-50% of overall CAC by month 9
- E-commerce: CPCO should be 20-40% of overall CAC by month 9
This metric indicates whether content operates cost-effectively relative to other acquisition channels, independent of absolute performance benchmarks.
3. Content Velocity and Consistency (4+ Pieces Monthly, Sustained for 12 Months)
Content programmes succeed through consistency rather than viral moments. Organisations publishing four reliable pieces per month for 12 consecutive months consistently outperform those publishing two pieces monthly or batching twelve pieces in a single month.
Track two dimensions:
- Publishing consistency: Are you maintaining your target cadence every month? Missing a single month often reduces momentum for 6 weeks.
- Engagement consistency: Are recent articles performing comparably to older content? Declining engagement suggests content requires a refresh or strategic refocus.
If month-over-month engagement declines, refresh or refocus your content strategy. If publishing remains inconsistent (two articles one month, six the next), sales cycles may be too long to benefit from publication clustering.
This metric indicates whether your organisation maintains the discipline required to realise content ROI. Many organisations lack sufficient consistency to see measurable returns.
Building a Content ROI Dashboard (Tools and Setup)
Measurement infrastructure is foundational to content ROI realisation. A content ROI dashboard requires 4-6 hours to establish and delivers clarity value monthly.
Essential Dashboard Metrics
Build a single dashboard using Google Sheets, Tableau, or Looker Data Studio with the following metrics:
| Metric | Current Month | Month-over-Month | 12-Month Trend | Target | Status |
|---|---|---|---|---|---|
| Articles published | 4+ | 0% | 48 per year | 48 | On track |
| Total traffic to content | 12,400 | +8% | 125,000 | 150,000 | Tracking |
| Content leads generated | 87 | +12% | 850 | 1,000 | On track |
| Content-sourced opportunities | 18 | +5% | 160 | 180 | Tracking |
| Content-influenced revenue | £42,000 | +18% | £340,000 | £400,000 | On track |
| Content-attributed revenue | £28,000 | +15% | £220,000 | £250,000 | On track |
| Cost per content-qualified opportunity | £289 | -4% | £294 | £300 | On track |
| Content-influenced revenue as percentage of total | 28% | +2% | 26% | 40% | Behind |
| Refresh rate (top 20% updated) | 40% | +5% | 35% | 40% | On track |
This single page provides immediate visibility into content programme health and alignment.
Automation and Integration
- Google Analytics 4 and Google Sheets integration: Use the GA4 API or a connector such as Supermetrics to pull monthly traffic and conversion data automatically. This eliminates approximately two hours of manual reporting each month.
- HubSpot or Salesforce integration: Use native Zapier integrations or custom webhooks to log lead and opportunity data automatically, segmented by content source.
- UTM parameter governance: Ensure every distributed content piece includes a UTM parameter. Document your UTM naming convention in a shared resource to maintain consistency. Inconsistent UTM tagging breaks attribution accuracy.
- Custom CRM fields: Add “content_engagement” and “first_content_touched” fields to your CRM. Log every content interaction preceding conversion. This requires approximately 10 minutes per prospect for proper setup but delivers complete journey visibility.
Monthly Review Cadence
Review your dashboard on the first business day of each month:
- Week 1: Confirm whether you met your publishing target and assess traffic trends. Identify underperforming articles (traffic decline exceeding 20% month-over-month). Flag these for content refresh.
- Week 2: Review lead generation and opportunity pipeline. Segment by content type and funnel stage. Which content moves prospects through the pipeline most efficiently?
- Week 3: Calculate CPCO and content-influenced revenue. Compare against targets. If you’re behind, diagnose the root cause: content quality, distribution reach, or attribution model inaccuracy?
- Week 4: Update your 12-month projection. Are you tracking toward your annual target? If not, identify required changes for the next quarter.
This rhythm prevents missed signals and maintains content strategy alignment with revenue objectives.
How to Improve Content ROI Without Increasing Budget
Many organisations can improve ROI by 30-50% without publishing new content. These approaches deliver demonstrable improvement.
Audit and Refresh Your Top 20%
Identify your top 20% of content by traffic and engagement. Conduct a freshness audit: are examples current? Does data originate from 2024 or earlier? Are screenshots current to your product interface?
Refresh 30-40% of this top 20% annually. Update data, incorporate new examples, refresh screenshots, and add recent case studies or testimonials. This typically requires 2-4 hours per article and costs £50-100 (approximately SGD 85-170) if outsourced.
Result: traffic typically increases 15-30% after refresh. Conversion rates can improve 5-10%. No additional budget required.
Repurpose Top-Performing Content
A blog post generating 50 leads can become a five-minute video (distributed via LinkedIn or YouTube). It can become a slide deck (distributed through SlideShare or your website). It can become an email sequence (distributed to your subscriber list). It can become a webinar topic (potentially co-hosted with a complementary company).
Each repurposing requires 4-6 hours of effort and reaches different audience segments. A single article often generates 2-3 times its original revenue through strategic repurposing.
Fix Your Attribution and CRM Tagging
Most organisations systematically lose attribution visibility because their CRM does not record content source for prospects. Invest eight hours configuring your CRM to capture “content_source” accurately for every lead.
Result: your content-influenced revenue metric will increase materially (reflecting improved measurement rather than improved content). Once you establish accurate attribution, budget defence becomes significantly easier.
Amplify Your Best Performers
Identify your top five articles by traffic and influenced revenue. Double their distribution budget for the next quarter.
- Paid social: £200 monthly per article = £1,000 monthly total
- LinkedIn advertising: £150 monthly per article = £750 monthly total
- Influencer outreach: £100 monthly per article = £500 monthly total
- Internal email campaigns: no cost
Total investment: £2,250 monthly (or less if you exclude paid channels). This represents a 10-20% increase in overall content spend but frequently delivers 40-60% more leads from your highest-performing assets.
Consolidate and Eliminate Underperformers
Review your bottom 20% of content by traffic and engagement. If an article receives fewer than 200 monthly visits and has been published for six or more months, consider archiving or deleting it.
Why: Search engines treat thin, low-traffic content as a ranking liability. Removing poor performers improves your domain’s overall authority. Consolidate learnings into stronger, better-ranked content instead.
Add a High-Intent Landing Page
Create a single landing page dedicated to your most common conversion action (demo request, free trial signup, contact form). Direct your bottom-of-funnel content (comparison guides, pricing pages, case studies) to this page rather than your generic homepage.
Conversion rates typically increase 20-40%. Setup requires approximately four hours. Cost ranges from £0-500 depending on template selection.
Content ROI by Industry (Benchmarks and Realistic Expectations)
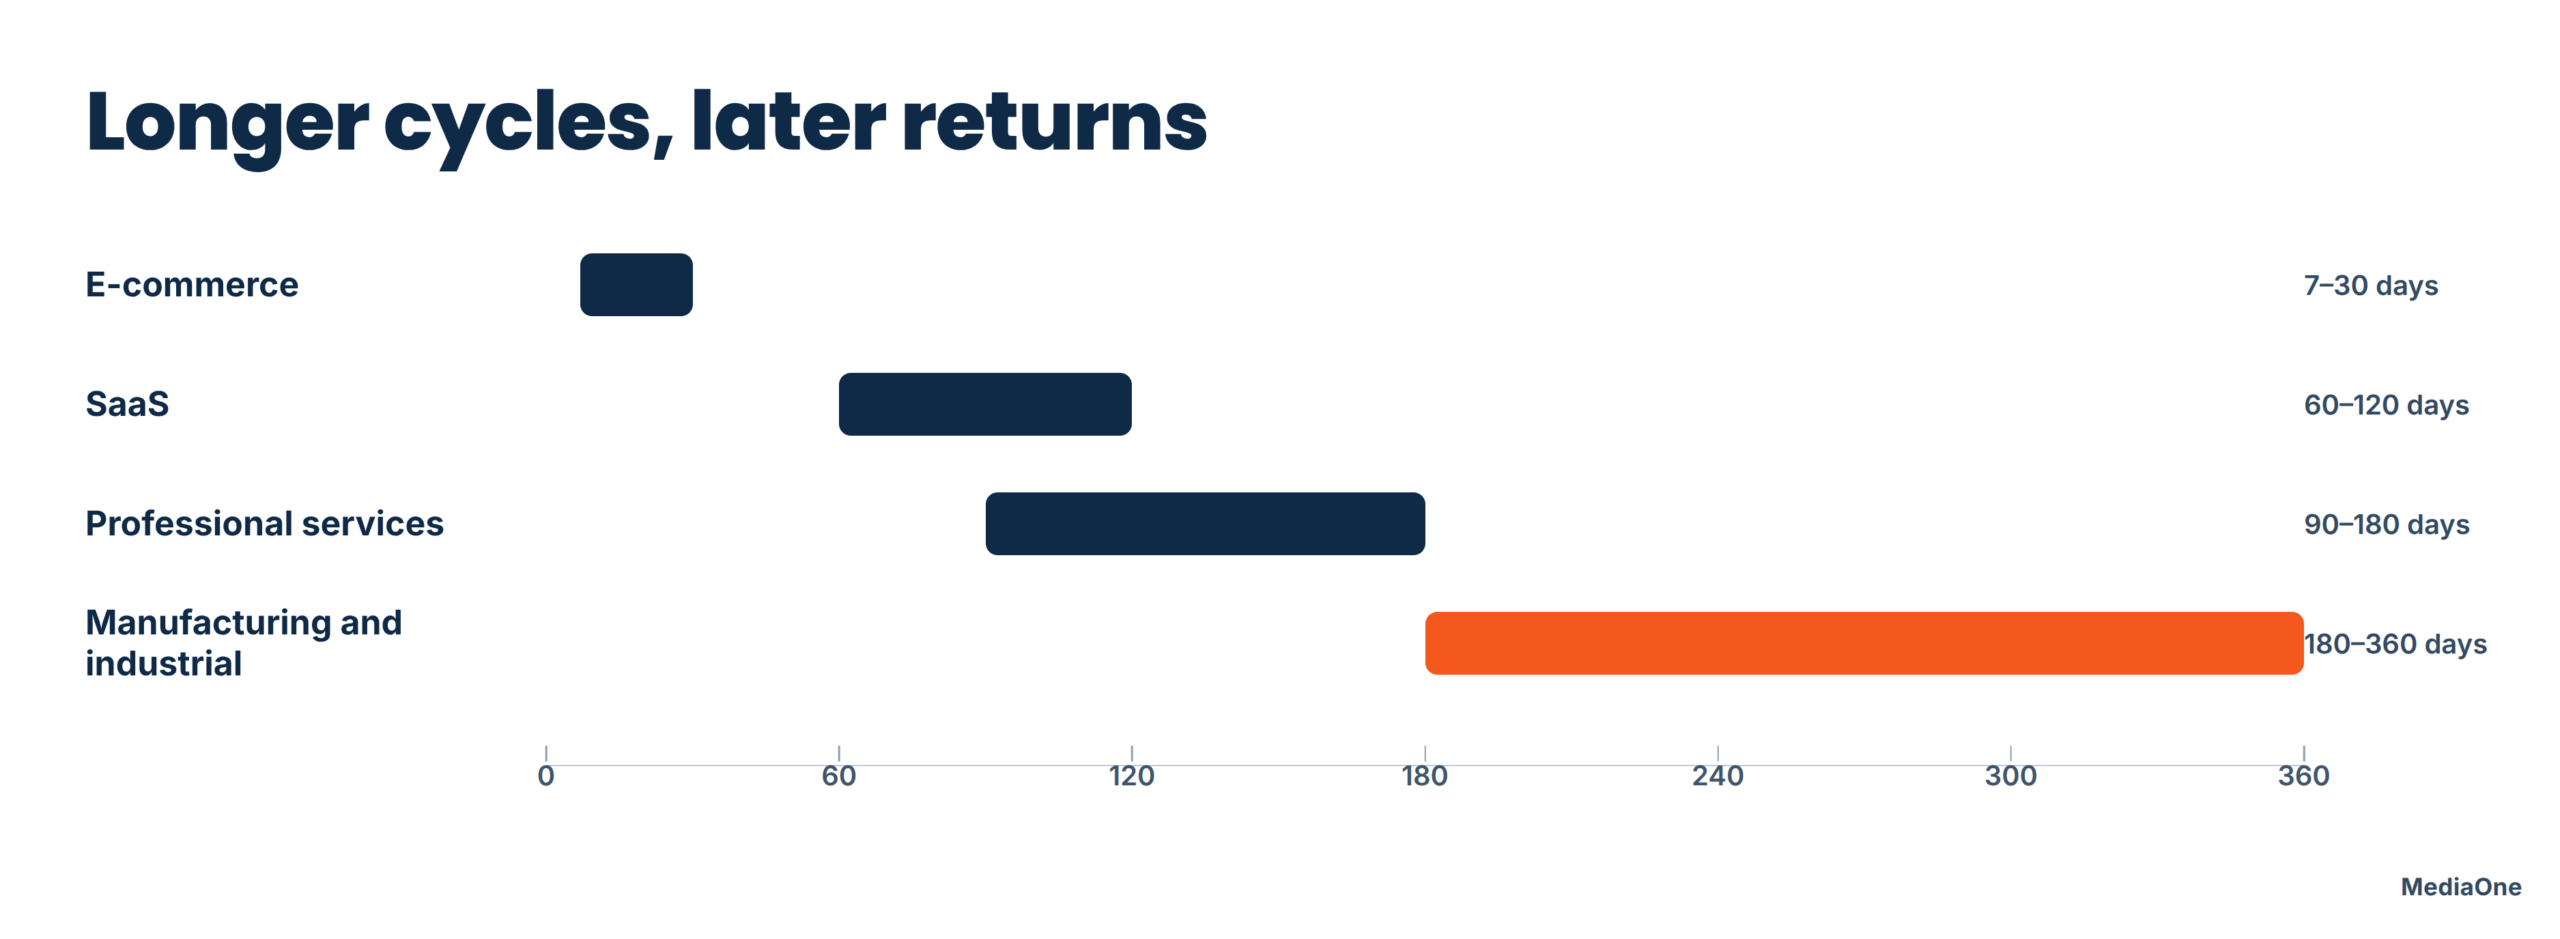
ROI varies significantly by industry due to differences in sales cycles, buyer behaviour, and conversion mechanics. Establish realistic expectations aligned with your sector.
SaaS
Sales cycle: 60-120 days
Expected 12-month ROI: Typically 150-400% based on reported case studies
Content-influenced revenue target: 40-50% of total sales
Self-serve trials create high-volume, low-friction conversion pathways. Content drives trial adoption; trials drive conversions. This creates shorter feedback loops. Multi-product upsells extend customer lifetime value, increasing ROI in year 2 and beyond.
Key metrics to monitor: free trial signups from content, trial-to-customer conversion rate, monthly recurring revenue per content-sourced customer.
Professional Services (Consulting, Legal, Accounting)
Sales cycle: 90-180 days
Expected 12-month ROI: Typically 100-250% based on reported case studies
Content-influenced revenue target: 35-45% of total sales
Longer sales cycles slow revenue recognition. However, content builds credibility with high-value prospects. A single £50,000+ engagement sourced through thought leadership content justifies months of content investment. Higher deal values offset slower conversion timelines.
Key metrics to monitor: inbound inquiry rate, opportunity close rate from content-sourced leads, average deal value comparison between content-sourced and other channels.
E-commerce
Sales cycle: 7-30 days
Expected 12-month ROI: Often negative in year 1; typically 150%+ in year 2
Content-influenced revenue target: 15-30% of total sales
High-volume, low-margin sales models mean content ROI accumulates slowly. A £20 product requires hundreds of conversions to justify content spend. Customer lifetime value (repeat purchases, email list growth, brand loyalty) is where content demonstrates strongest performance. Content-sourced customers frequently exhibit 2-3 times higher lifetime value than paid-traffic customers.
Key metrics to monitor: repeat purchase rate by channel, email subscriber growth from content, average order value and cart value progression, customer acquisition cost by channel.
B2B Manufacturing and Industrial
Sales cycle: 180-360 days
Expected 12-month ROI: Often negative in year 1; typically 80-180% by year 2
Content-influenced revenue target: 25-40% of total sales
Extremely long sales cycles and small, specialised buyer pools mean content’s primary benefit is compounding trust and lead nurturing within a defined audience. ROI appears slowly but compounds over multiple years. Expect year 1 to show elevated costs; years 2-3 typically show strong returns.
Key metrics to monitor: inbound lead pipeline velocity (prospect progression speed from initial contact to proposal), deal stage progression speed (do content-engaged leads move through stages faster), customer acquisition cost stability year-over-year.
Benchmark Summary
| Industry | Sales Cycle | Year 1 ROI | Year 2+ ROI | Content-Influenced % |
|---|---|---|---|---|
| SaaS | 60-120 days | 150-400% | 250-500% | 40-50% |
| Professional services | 90-180 days | 100-250% | 200-400% | 35-45% |
| E-commerce | 7-30 days | Often -50% to 0% | 150-300% | 15-30% |
| Manufacturing/Industrial | 180-360 days | Often -50% to +50% | 80-250% | 25-40% |
If your industry demonstrates negative year 1 ROI, this pattern is normal. Plan execution across years 2 and 3. Discontinue the programme at month 9 only if performance significantly underperforms your industry benchmark, not because year 1 appears negative.
Achieving these results requires accurate attribution tracking infrastructure and disciplined measurement discipline across your entire organisation.
Scenario Analysis: Five Real-World Content ROI Examples
Theory is useful. Examples are memorable. Here are five scenarios that show how the framework works in practice.
Scenario 1: SaaS Platform (12-Month Positive ROI)
Company profile: B2B SaaS accounting software. £5,000 annual contract value (approximately SGD 8,500). 60-day sales cycle. Historical customer acquisition cost (CAC): £1,500 across all channels.
Content programme: Four articles per month. Focus on decision-stage content (pricing comparisons, ROI calculators, customer case studies). Distribution budget: £1,500 per month (paid social, LinkedIn ads). Total monthly spend: £4,500 (content production £3,000 plus distribution £1,500).
Month 6 snapshot:
- 24 articles published
- Organic traffic to blog: 22,000 visitors
- Content-sourced leads: 110 (4.2% conversion rate from first-time visitors)
- Content-sourced opportunities: 12 (10.9% of leads)
- Cost per content-qualified opportunity (CPCO): £1,875 (£27,000 spend divided by 12 opportunities)
- Content-influenced revenue: £0 (no deals closed yet)
- Year-to-date spend: £27,000
- Year-to-date ROI: -100%
Organisations at this stage often find themselves defending budget rather than growing it. Marketing leaders face questions about whether the investment is generating results.
Month 12 snapshot:
- 48 articles published
- Organic traffic to blog: 58,000 visitors
- Content-sourced leads: 310 (4.8% conversion rate)
- Content-sourced opportunities: 48 (15.5% of leads)
- Content-sourced customers: 24 (50% close rate)
- Content-influenced revenue: £120,000 (24 customers multiplied by £5,000 annual contract value)
- Cost per content-influenced customer: £2,000 (£48,000 total annual spend divided by 24 customers)
- CPCO: £1,000 (£48,000 divided by 48 opportunities)
- Content-influenced revenue as percentage of total: 35% (of a £340,000 annual revenue pool)
- Total annual ROI: 150% (£120,000 revenue divided by £48,000 cost, multiplied by 100)
Key insight: The programme showed minimal progress at month 6. By month 12, it generates one-third of annual revenue and achieves better efficiency (CPCO of £1,000) than the company’s previous average CAC (£1,500). Next step for year 2: increase distribution budget to £2,000 per month to expand reach.
Scenario 2: Professional Services Firm (Slower but Stronger)
Company profile: Management consulting. Average engagement value: £80,000 (approximately SGD 136,000). 120-day sales cycle. Historical CAC: £4,000 (partner events, conferences, outbound engagement). Historical close rate: 8%.
Content programme: Two thought-leadership articles per month (published on Medium and LinkedIn, cross-posted to company website). No paid distribution budget. Focus: building credibility with C-suite decision-makers. Monthly spend: £1,200 (freelance thought leader at £600 per article).
Month 9 snapshot:
- 18 articles published
- Content-driven website traffic: 8,400 visitors
- Inbound inquiry rate: 22 leads (ungated, high-intent self-identifies)
- Content-sourced opportunities in pipeline: 4 (18% conversion from inquiry)
- Content-influenced revenue year-to-date: £0 (longest deal is 90 days in; closes in month 10)
- Year-to-date spend: £10,800
- Year-to-date ROI: -100%
Month 18 snapshot:
- 36 articles published
- Accumulated inbound inquiries: 64
- Content-sourced deals closed: 3 (£80,000 each, totalling £240,000)
- Content-sourced deals in pipeline: 5 (£80,000 each potential value)
- CPCO (for closed deals): £7,200 (£21,600 spend divided by 3 deals)
- Content-influenced revenue: £240,000
- Total spend: £21,600
- ROI at month 18: 1,011% (£240,000 divided by £21,600)
Key insight: Professional services cycles move more slowly than SaaS, but the payoff is substantially larger. A single content-sourced customer (one £80,000 engagement) justifies months of low-cost content spend. The company already has five more deals in the pipeline closing by month 24, positioning year 2 for 350% or higher ROI.
Scenario 3: E-commerce (Year 1 Negative, Year 2 Positive)
Company profile: Online athletic apparel retailer. Average order value: £65 (approximately SGD 110). Customer lifetime value (LTV): £320 (five purchases over two years). Historical CAC: £40 (Google Shopping, Facebook ads). 7-day sales cycle.
Content programme, Year 1: Eight blog articles per month. Focus: training guides, product care, fitness tips. Goal: build email subscriber list. Monthly spend: £3,000 (content production £2,000 plus paid distribution £1,000).
Year 1 snapshot:
- 96 articles published
- Blog traffic: 185,000 visitors
- Email captures from gated content: 2,400
- Email-driven sales (Year 1): £28,000 (estimated 16 customers from email list)
- Direct purchase from blog post: 8 customers, £520 revenue
- Total Year 1 content-influenced revenue: £28,520
- Total Year 1 spend: £36,000
- Year 1 ROI: -21%
E-commerce margins are tight and customer acquisition is commoditised. Year 1 content ROI appears negative because you are building assets (email list, organic search authority, brand credibility) that deliver returns in year 2 onwards.
Year 2 snapshot:
- Blog traffic: 310,000 visitors (68% increase from compounding search engine optimisation authority)
- Email list: 4,200 subscribers (continues growing)
- Email-driven sales (Year 2): £89,000 (estimated 137 customers)
- Direct blog purchase: 24 customers, £1,560 revenue
- Repeat purchases from Year 1 content-acquired cohort: £14,400
- Total Year 2 content-influenced revenue: £104,960
- Total Year 2 spend: £36,000 (same production budget)
- Year 2 ROI: 192%
Key insight: E-commerce requires patience. Do not measure at month 12; measure at month 24. By then, the initial investment compounds through repeat customers (higher lifetime value than single-purchase acquisition cost), email list leverage, and organic search authority. Year 3 performance improves further.
Scenario 4: Fixing Attribution (Quick Win, No New Budget)
To follow.