
Customer retention rate is the share of your customers who stay with your business over a given period. Calculate it as ((customers at end of period – new customers added) / customers at start of period) x 100.
Many businesses track revenue and acquisition costs closely but never measure how many customers return. Keeping an existing customer is usually cheaper than winning a new one. An Econsultancy report found companies far more focused on acquisition than retention – 44% of companies prioritise acquisition versus 16% focused on retention. This guide explains how to measure retention, compare it with the right peers, and tie it to specific action. Reviewing customer feedback, the percentage of customers you keep each quarter, and your customer churn rate shows where your product or service falls short and helps you decide what to fix first – and if you want a partner to run the wider programme, MediaOne Marketing’s digital marketing services cover the acquisition and retention loop end to end.
Retention metrics are only useful if they are read the same way every time. Treat the figure as a diagnostic for your business, not a score to admire. Strong customer success teams use it to spot accounts at risk before they leave.
Key Takeaways
- Calculate it the same way every time. Fix your period and definition so the figure can be trended.
- Benchmark against your sector. Median B2B rates run from 44% to 89% depending on industry, with an overall average of about 72.5%.
- Treat retention as a diagnostic. Your customer retention rate shows where revenue leaks.
- Watch the trend, not only the level. A stable rate below benchmark needs a different fix than a falling one.
- Start if you don’t measure yet. Many businesses do not track retention, so a first baseline is the most valuable step.
- Act on the drivers. Onboarding, service response and pricing fairness move the number most.
What Customer Retention Rate Means
Customer retention rate is the percentage of customers who stay with your business over a given period. If you start a quarter with 200 customers and 180 still buy from you at the end, your retention for that quarter is 90%. It measures how well you keep people who have already chosen you, not how well you attract new ones. Tracking it helps you spot customer churn early, before it shows up in revenue, and it is one of the clearest ways to improve your customer experience and loyalty over time.
Whether you sell a product or service, this measure shows how well you keep the people who already buy from you. Calculate customer retention by counting how many customers you kept over the period and dividing by how many you started with.
The figure only means something when you define it the same way every time. Treat it as a measurement you repeat on a fixed schedule, not a one-off score.
Why Retention Compounds
Each good customer you keep adds revenue without a new acquisition cost, so retained revenue is usually cheaper than replacement revenue. Satisfied customers also refer others, and a stable base makes forecasting easier. In businesses where customers buy repeatedly, a small gain in retention can outweigh a large gain in new sales. Better service and a stronger product or service raise the rate because they give existing customers a reason to stay.
Retention Metrics: Churn, CLTV and NPS
Churn Rate and Retention Rate
Churn rate is the share of customers lost in a period, and it reconciles with retention: an 85% retention rate means 15% churn. Confusing the two leads teams to aim at the wrong target. Agree on one primary metric, state it in every report, and reconcile both at the start of each review.
Customer Lifetime Value
Customer lifetime value (CLTV) estimates what a retained customer is worth over time. Each lost customer takes their remaining lifetime margin with them, so a small rise in customer retention can add up to a large rise in value. For the full method, work through our CLV calculation guide.
Worked CLTV example (hypothetical). A business earns S$5,000 a year from an average client, keeps 40% of margin and retains that client for three years. CLTV is S$5,000 x 40% x 3, which equals S$6,000.
Net Promoter Score as a Signal
Net Promoter Score (NPS) asks customers how likely they are to recommend you, and it gives an early read on loyalty. To run it well, survey customers shortly after a key milestone, such as onboarding or a completed project, rather than at random, so the feedback reflects a real experience. Collect enough responses to see patterns, since a handful of answers can swing the score. Then segment respondents into promoters (scores of 9 and 10), passives (7 and 8) and detractors (0 to 6). Follow up with detractors first to learn what is driving them away, and ask promoters what they value so you can protect it and improve your customer relationships.
Calculating Customer Retention Rate: Formula, Mistakes and Related Metrics
The Formula
Use this formula:
Retention rate = ((customers at end of period – new customers added during period) / customers at start of period) x 100
This formula covers logo retention only. It excludes expansion revenue, so a customer who spends more still counts as one retained customer. Track revenue churn separately if you need to see the value lost alongside the customers.
Worked example for a Singapore consultancy billing S$5,000 per client a year (hypothetical illustration):
- Customers at start of quarter: 200.
- New customers won during the quarter: 30.
- Customers at end of quarter: 215.
- Subtract the 30 new customers from 215, leaving 185 retained customers.
- Divide 185 by 200 and multiply by 100. The retention rate is 92.5%, so 15 customers were lost.
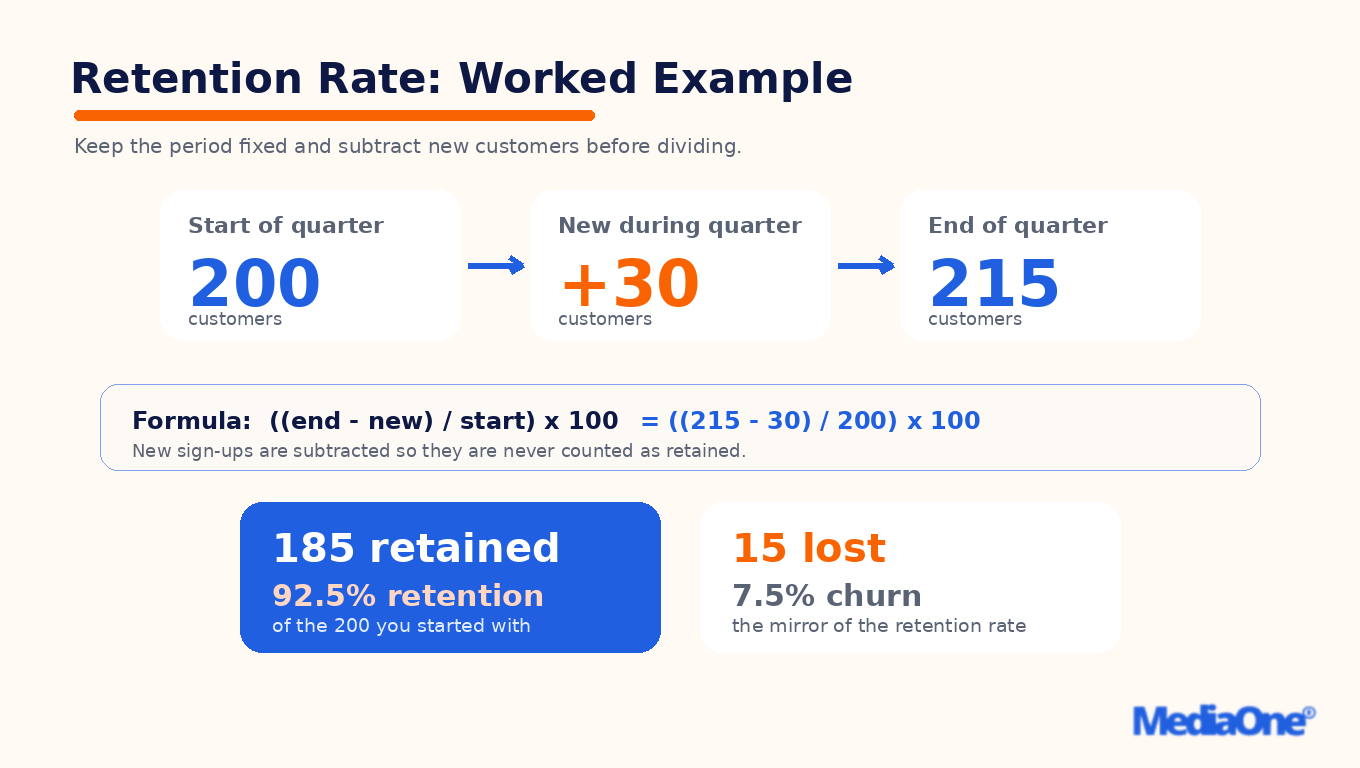
Figure 2: Customer retention rate worked example: 200 start, 30 new, 215 end, 185 retained
Keep the period fixed. Pick the cycle that matches how your customers actually buy. A professional services business billing annually may calculate quarterly, while a subscription company may need monthly figures. Compare each period’s retention figures against the same underlying data definitions so the trend stays reliable.
Common Calculation Mistakes
- Counting new customers as retained. New sign-ups inflate the numerator. Subtracting them, as the formula does, prevents this.
- Mixing periods. Comparing a monthly churn figure with a quarterly retention figure produces a misleading trend.
- Ignoring partial-period churn. A customer who leaves mid-cycle still counts as lost. Excluding them makes retention look healthier than it is.
Related Metrics and Indicators
Retention rarely stands alone. These related measures give it context:
|
Metric |
Formula |
What it tells you |
|
Customer churn rate |
100 minus retention rate |
Share of customers lost in the period |
|
Net revenue retention |
(Starting revenue + expansion – contraction – lost revenue) / starting revenue x 100 |
Whether existing customers grow or shrink your revenue |
|
Customer lifetime value (CLTV) |
Average revenue per customer x gross margin x average customer lifespan |
What a retained customer is worth over time |
Net revenue retention counts money, while logo retention counts customers. A company can keep 80% of its customers yet still grow revenue if the remaining clients expand, so read the two together. Managing these numbers day to day usually means putting a system behind them – our guide to CRM for SMEs covers the tooling side.
Three indicators show where customer retention rate is heading:
- Cohort tracking. Group customers by joining month and follow each group. A sharp drop within 90 days points to onboarding failure.
- Repeat purchase rate. The share of customers who buy a second time, often the earliest signal of a relationship forming or fading.
- Engagement signals. Logins, support tickets, meeting attendance or product usage. Falling engagement usually comes before a cancellation, so track it to improve your customer relationships before they leave.
Track these alongside your retention rate. The retention figure shows the outcome; cohorts and engagement show the cause.
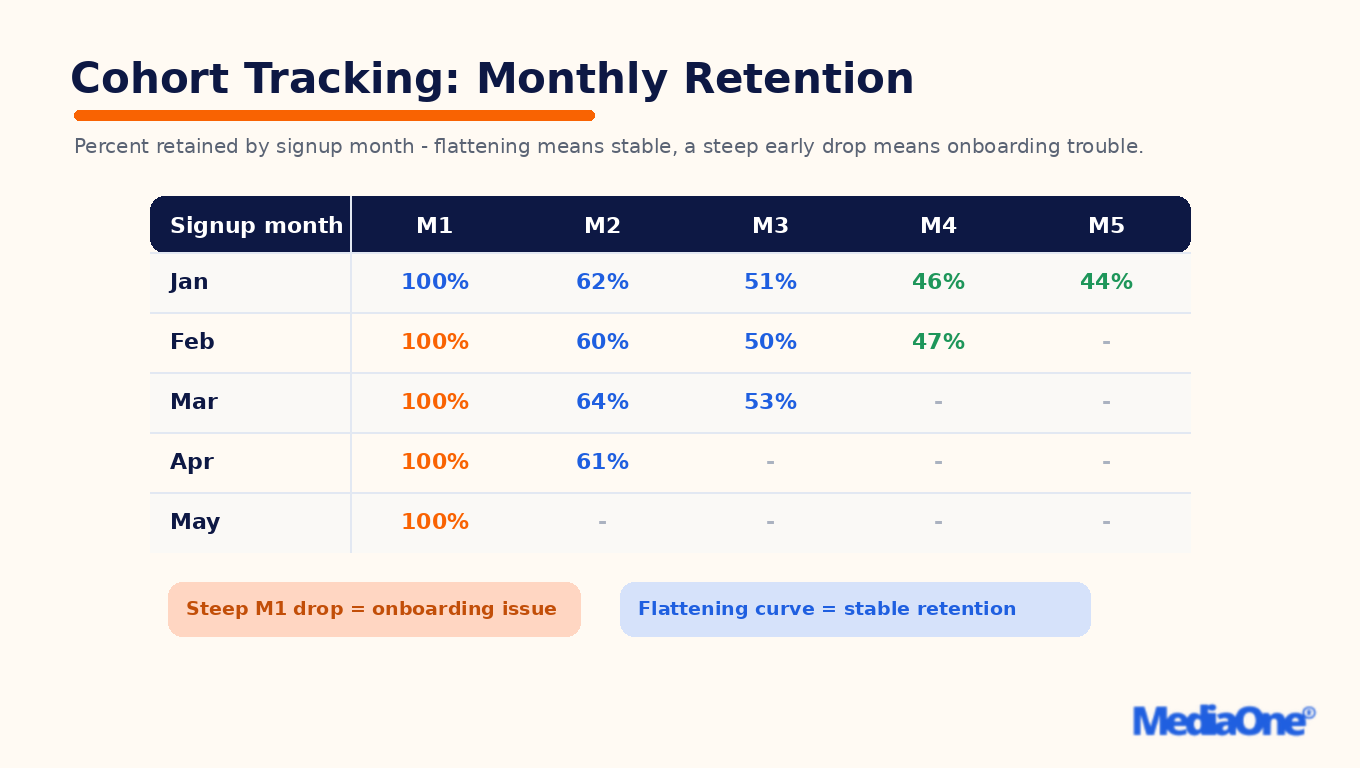
Figure 3: Cohort tracking: monthly retention by signup month shows onboarding issues first
Benchmarking Customer Retention by Industry
A single average can mislead you. CustomerGauge‘s benchmarking of B2B companies puts the overall average customer retention rate at about 72.5%, but the spread is wide: median rates run from 44% to 89% depending on industry, because sectors have very different churn profiles. Your own customer experience shapes where your business falls within that spread, and the strength of your relationships with existing customers often moves the number more than any industry average. Working to improve your customer experience, and treating customer success as a retention function rather than a support function, often moves the number more than any industry average.
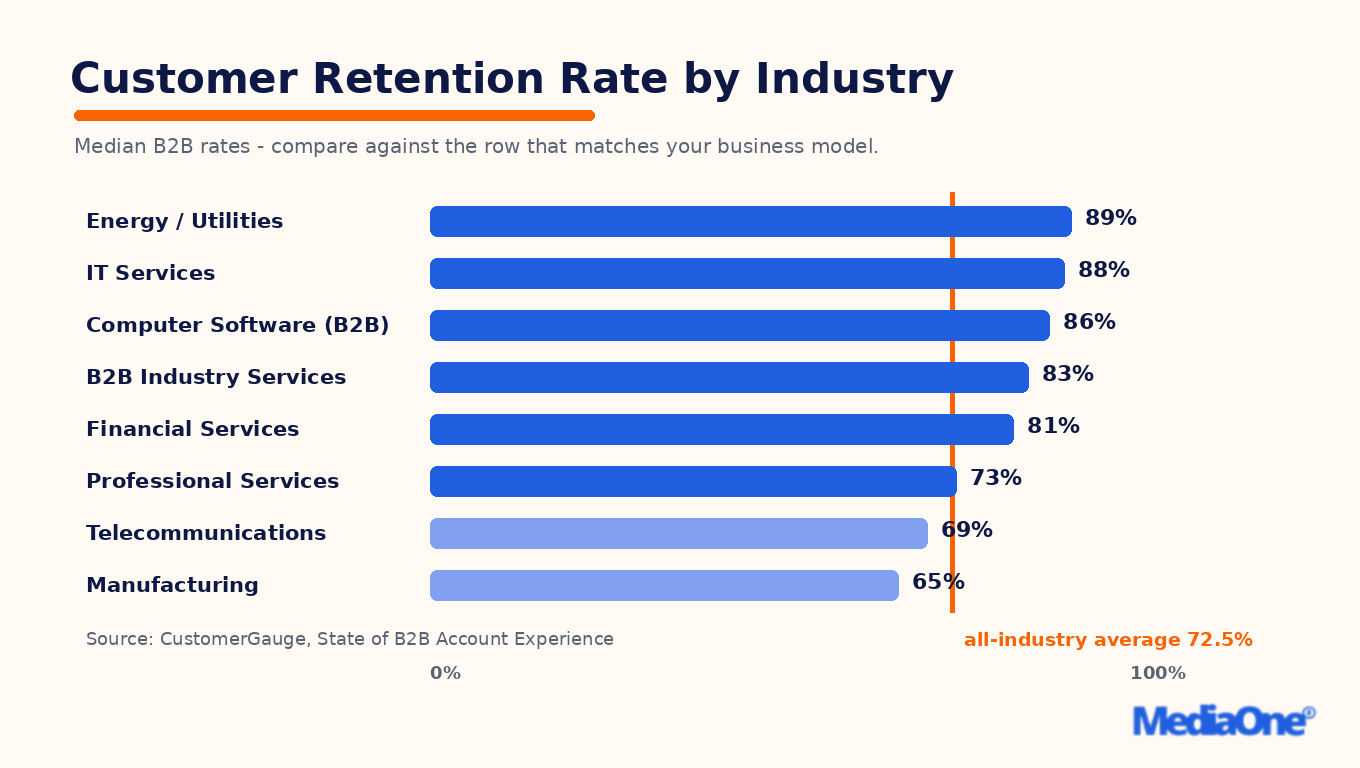
Figure 4: Median customer retention rate by industry, with the 72.5% average marked
The sector figures below show how wide the spread is. They come from CustomerGauge’s State of B2B Account Experience report, which covers 11 B2B industries and reflects its own sample and methodology, so treat them as a reference band, not a pass mark.
|
Industry |
Customer retention rate |
Churn rate |
|
Energy/Utilities |
89% |
11% |
|
IT Services |
88% |
12% |
|
Computer Software |
86% |
14% |
|
B2B Industry Services |
83% |
17% |
|
Financial Services |
81% |
19% |
|
Professional Services |
73% |
27% |
|
Telecommunications |
69% |
31% |
|
Manufacturing |
65% |
35% |
Many businesses do not measure this at all. Econsultancy’s research summary puts companies’ focus on acquisition at 44%, versus 16% on retention. If that describes you, your own consistently calculated customer retention rate, tracked over a fixed period, is the first benchmark you need, alongside the metrics you already report for each company product line. Tracking revenue churn alongside logo churn shows whether lost customers are also taking revenue with them.
What a Good Rate Looks Like
A good customer retention rate sits at or above the band for your sector and moves in the right direction. First, identify which industry row your business competes in. A Singapore audit or consulting firm belongs in Professional Services, not the broad cross-industry average.
Then read your number against three questions:
- Is it inside, above or below your sector band? Compare against the row that matches your model.
- Is it stable, rising or falling? A drop from 82% to 75% over four periods is a more urgent signal than a steady 70% in a sector averaging 73%.
- Does your calculation period match the benchmark’s? Monthly and annual rates are not interchangeable. Subscription firms often measure monthly, which produces lower-looking figures.
If your rate is below the band, the gap shows where to look, and customer feedback can help you find the cause – review channels you already control, starting with your Google Business Profile reviews, which our guide to Google Business Profile management covers. If it is above, the question becomes whether you are protecting what already works.
Retention by Contract Type
Retention also varies by how customers buy. Contract customers, subscription customers and one-off buyers each behave differently, so compare your rate against the model that matches yours. Subscription and contract models show retention over time, while transactional businesses rely on repeat purchases. Measure each segment separately before setting a target.
Factors That Move the Number
A customer retention rate rarely moves because of one dramatic failure. It moves because of everyday experiences that reassure a customer or push them toward a competitor. Five factors do most of the work for any business:
- Onboarding quality. The first 30 to 90 days decide whether a customer reaches the point where leaving would feel like a loss.
- Service response. How quickly a problem is acknowledged often matters more than how quickly it is solved. This shapes customer satisfaction directly.
- Pricing fairness. Customers accept higher prices when the value is visible. They resent surprise renewal increases, which can erode revenue retention over time.
- Switching costs. Data, integrations and training make leaving harder. These hold customers only while they still want to stay. Strong customer success work gives them a reason to stay beyond lock-in.
- Product fit. A customer whose needs have shifted will leave regardless of service quality. Check whether your product still solves the problem the customer bought it for. Tracking which customers stop using a feature can show where that mismatch begins, and help you act before they leave, which is reflected in healthier retention rates.
Strategies to Improve Customer Retention
Start with the factor that loses your business the most revenue, then work through these tactics by effort. Where a tactic needs tooling, our guide to online marketing tools in Singapore compares the options by category and price.
- Build an early-life onboarding sequence. Define one first win customers should reach within two weeks, and track the percentage of customers who reach it. Below 60%, the sequence needs work. Owner: onboarding lead. Trigger: a new account signs up.
- Schedule proactive check-ins. Contact accounts at day 30, day 90 and before each renewal, before they ask. This helps you spot problems early. Owner: account manager. Trigger: the calendar date, or 60 days before renewal. Treat any account that misses two check-ins in a row as a churn risk.
- Use loyalty mechanics sparingly. Points, tiers or extended support work when they reward behaviour you want repeated, such as renewal or referrals. Discounts alone train customers to wait for the next one. Tie each reward to customer lifetime value rather than one-off purchases, so the experience your customers have over time is what drives the reward.
- Run win-back campaigns on a fixed schedule. Contact lapsed customers at 30, 60 and 90 days with a specific reason to return. Owner: marketing lead. Trigger: a cohort’s customer retention rate falls more than 5 points below its prior period.
Measure each tactic against the retention rate of the cohort it targets, not the whole base. Customer churn data and customer satisfaction scores show whether a change is working, and whether your approach is helping you improve your customer relationships over time.
Why Retention Matters for Singapore SMEs
Singapore’s crowded services market makes a lost customer hard to replace, and acquisition costs often exceed what a single account earns. A deliberate customer retention strategy protects margin that would otherwise go on finding a new buyer. Tracking retention rates and the underlying customer data shows whether the experience you provide is actually working – it should sit alongside the broader marketing strategies for SME growth, not compete with them.
For subscription-based B2B firms, monthly churn of a few percent compounds into a large annual loss. Measure monthly for early warning, and confirm the trend annually before investing.
Turn Your Customer Retention Rate into a Decision
Track your customer retention rate consistently, using the same formula and a fixed period. Benchmark it against your own industry rather than the all-industry average, which blends very different churn profiles. Then act on its drivers, such as onboarding, service response or pricing value.
A practical starting point is a retention audit. Calculate your rate for each of the last four quarters, alongside the number of customers you served, and compare it with your sector band. If you would rather have the wider acquisition-and-retention loop run by a team, review MediaOne Marketing’s digital marketing services and hold the programme to the standard this guide sets: one formula, one benchmark, one owner per fix.
Frequently Asked Questions
What is a good customer retention rate?
There is no single target, as it depends on your sector. CustomerGauge’s median B2B figures run from 65% in manufacturing to 89% in energy and utilities, with professional services at 73% and financial services at 81%. Treat your sector band as the real benchmark, and check whether your rate has moved over time.
How do you calculate customer retention rate?
Use ((customers at end of period – new customers added during period) / customers at start of period) x 100. Example: start with 200 customers, add 30, end with 215. That is ((215 – 30) / 200) x 100 = 92.5% retention, with 7.5% churn. Keep the period and the definition of an active customer fixed so the trend stays comparable.
What is the difference between customer retention rate and churn rate?
They measure the same thing from opposite sides. Retention rate is the share of customers you keep, and churn rate is the share you lose. The two add up to 100%, so a 73% retention rate means a 27% churn rate.
Why is customer retention rate important?
Retained customers usually cost less to serve than new ones, and they are more likely to buy again and refer others. Small improvements compound into meaningful revenue without extra acquisition spend.
What is the average customer retention rate across industries?
CustomerGauge’s cross-industry benchmark for B2B companies is about 72.5%, with median rates ranging from 44% to 89% across 11 industries. The average blends very different churn profiles, so use it only as a rough reference.
How can a small business improve customer retention?
Start with onboarding, since many customers decide whether to stay in their first few weeks. Add proactive check-ins, respond quickly to service issues, and track retention by cohort. Run win-back offers for lapsed customers.