
Click-through rate is the share of people who saw an ad, listing or email and clicked it. In marketing, a high CTR can still hide a problem further down the funnel.

This guide shows how to calculate click-through rate, compare it against a channel benchmark, and read it alongside conversion rate.
Key Takeaways
- Click-through rate is a diagnostic, not a goal. Calculate it as (clicks ÷ impressions) × 100, then read it with the conversion rate and cost.
- Benchmark against your own channel. Google search ads average a 6.66% CTR, but industry gaps are wide.
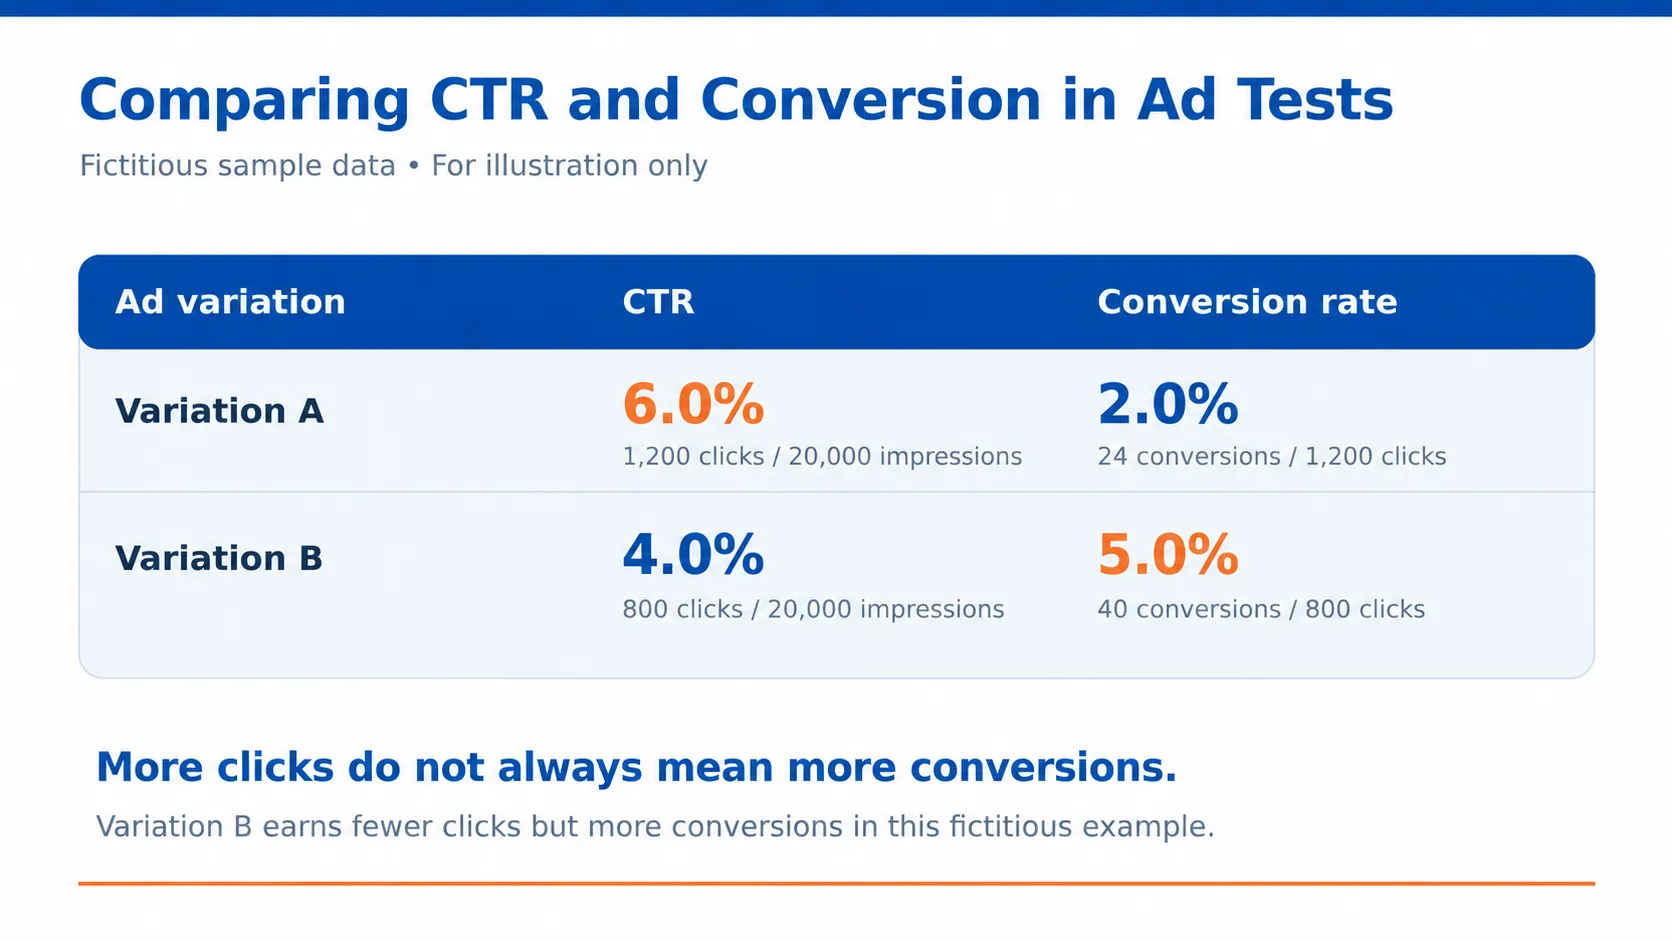
- Check conversion rate first. A 2% CTR that converts well can beat a 6% CTR driving non-buying clicks.
- Use the Diagnostic Ladder. Classify each campaign as strong or weak on CTR and conversion, then apply one specific fix.
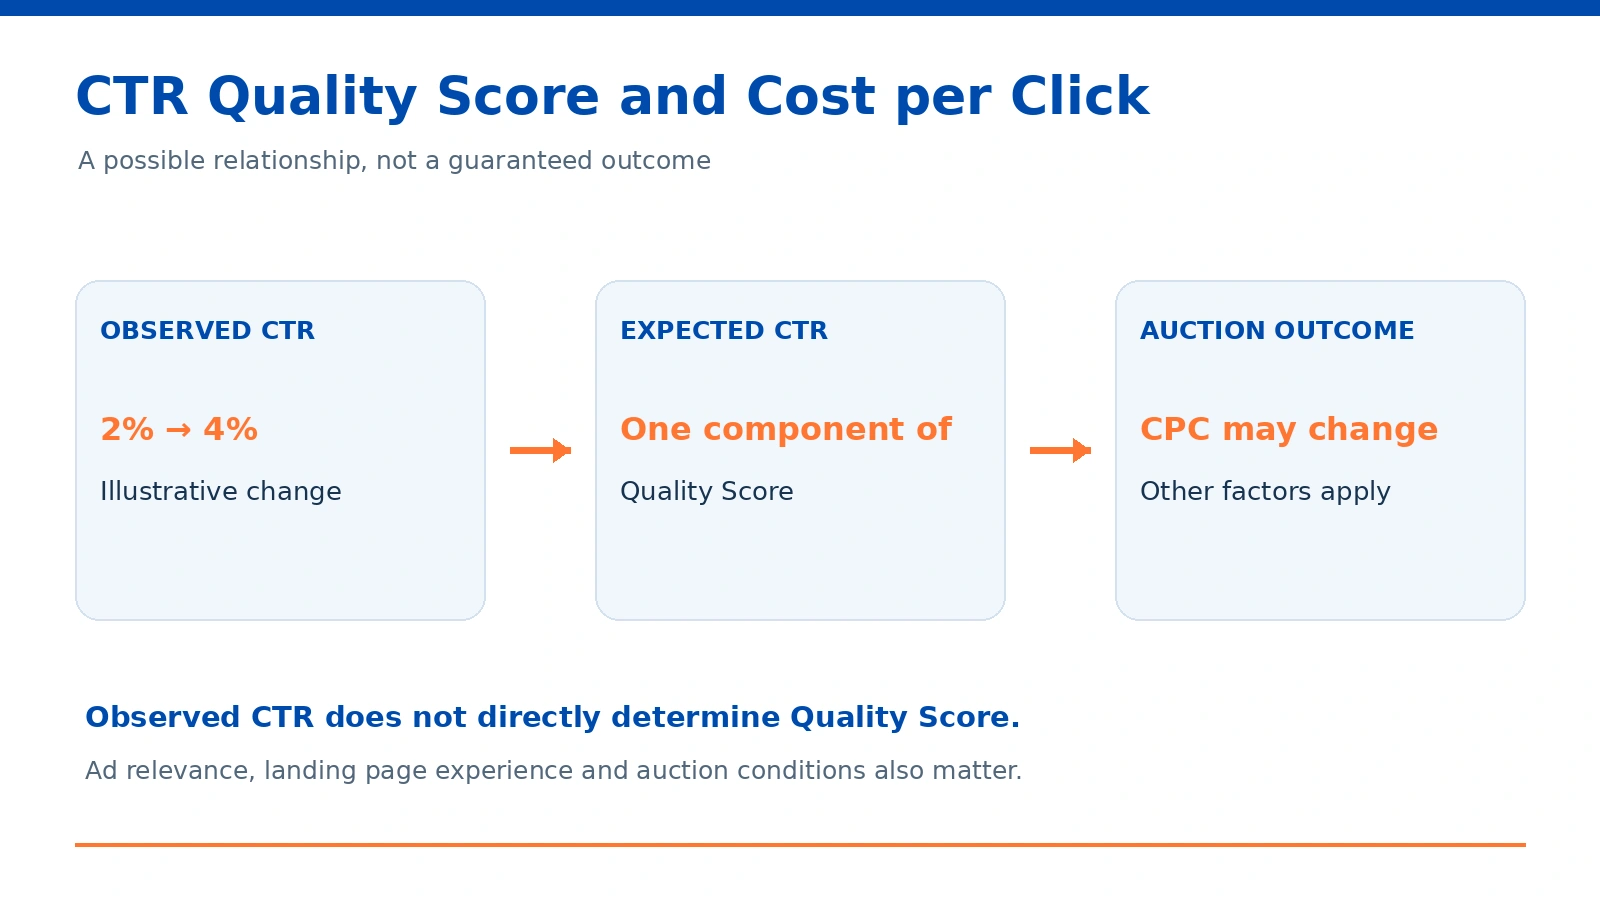
- Lift CTR to lower cost. Raising CTR from 2% to 4% can add roughly 1.5 points to the Quality Score, per a third-party estimate.
- Test keyword-containing URLs. One unverified third-party figure reports 45% higher CTR, worth testing on your own pages.
Why Click-Through Rate Matters More Than It Looks
Click-through rate is more useful as a diagnostic than a goal. Divide clicks by impressions and multiply by 100. Google Ads, Meta Ads Manager and most email platforms report it by default.
Click-Through Rate Defined in Plain Terms
CTR is the share of people who saw an ad, link or email and chose to click it. 400 clicks from 20,000 impressions gives a CTR of 2%.
How CTR Measures Marketing and Content Effectiveness
CTR isolates click earnings across marketing channels. Ad copy, headline, position and audience fit all influence it, but it says nothing about what happens after the click. Marketers use it to find creative that underperforms the channel’s average click-through rate and to compare performance across campaigns by the total number of clicks each earns per impression.
CTR vs. Conversion Rate: Two Metrics, Two Jobs
CTR shows whether users want to click. The conversion rate shows whether those clicks become customers. A high CTR with a low conversion rate often means the ad promises something the page does not deliver.
How to Calculate Click-Through Rate
Click-through rate is one of the few metrics you can calculate in seconds, but people often use it loosely. Apply the calculation consistently so comparisons hold. Getting the calculation right is important for any performance review, especially when comparing click-through rates across campaigns.
The CTR Formula, Step by Step
- Count the clicks the asset received over the period.
- Count the impressions (or, for email, the messages delivered).
- Divide clicks by impressions, then multiply by 100.
The formula is CTR = (Number of Clicks ÷ Number of Impressions) × 100, as set out by TrueProfit’s guide to click-through rate. Use the same period and filters for both numbers, so the result reflects true campaign performance.
Worked Examples for Ads, Organic Results and Email
A paid search ad with 20,000 impressions and 400 clicks yields a CTR of (400 ÷ 20,000) × 100 = 2%. An ad with 10,000 impressions and 500 clicks yields 5%, as Bosco used in the example.
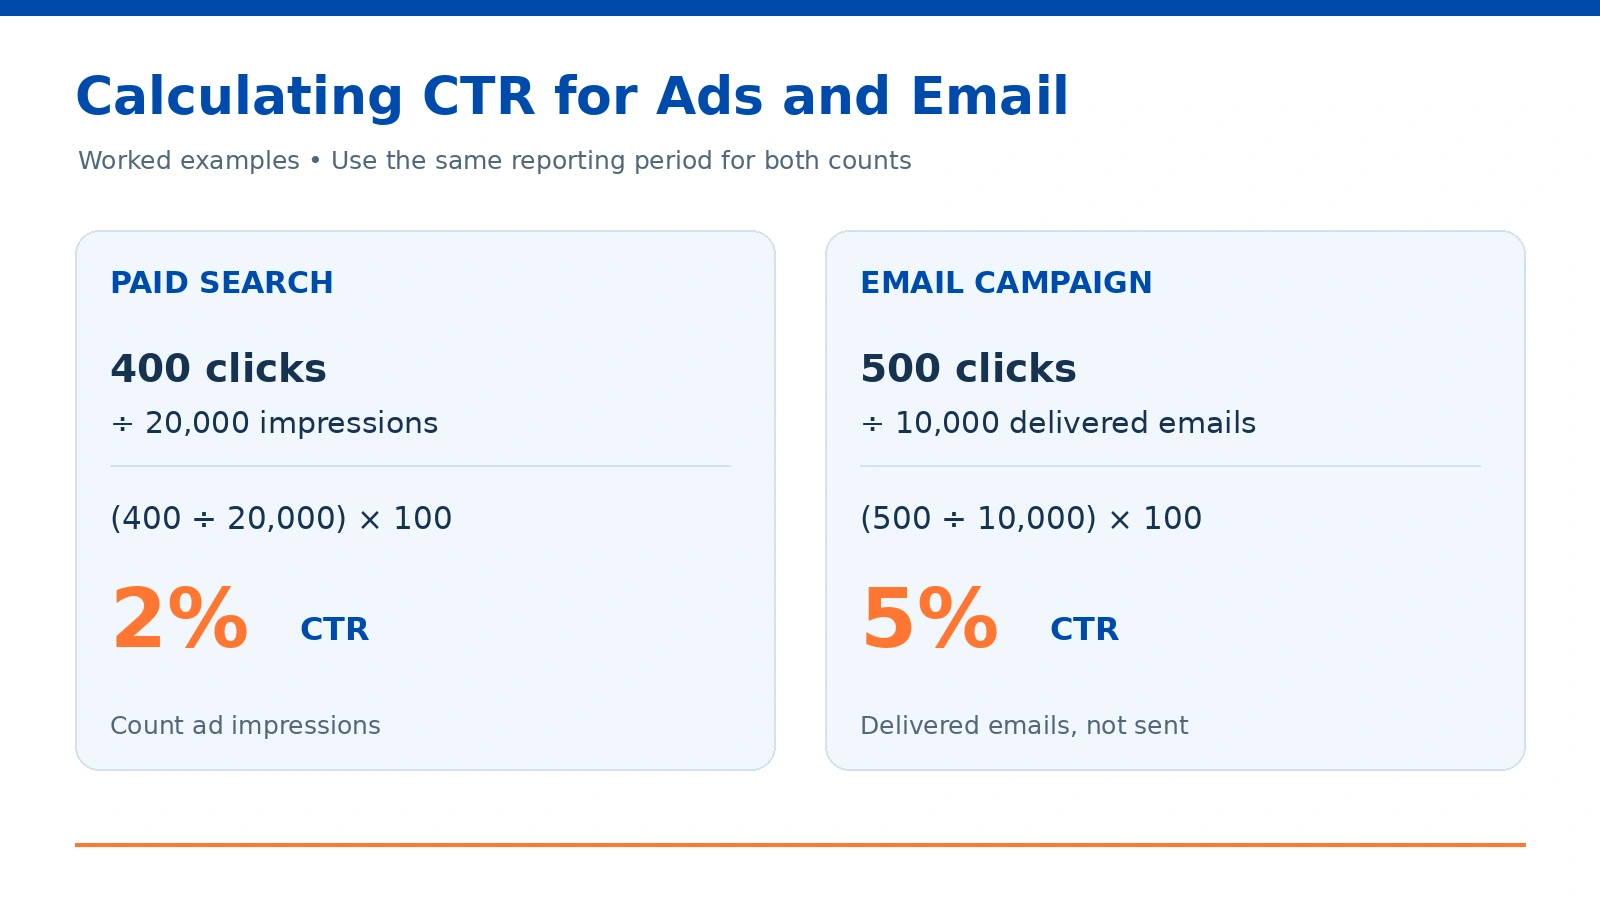
Email uses delivered messages as the denominator. Organic search lacks a full impression counter, so use Search Console clicks and impressions for a page or query. Display ads follow the same logic.
Common Calculation Mistakes to Avoid
- Dividing by sent rather than delivered emails. Bounces inflate the denominator and understate CTR.
- Mixing time windows. Clicks from one week divided by impressions from another gives a false number.
- Treating CTR as a conversion rate is misleading. CTR measures clicks, not purchases.
What Is a Good CTR? Benchmarks by Channel
A good click-through rate depends on the channel, ad format and industry, so there is no single target. Check the figures below against the latest benchmark report before relying on them. Measuring CTR helps you judge whether an ad is performing, and benchmarks are a useful starting point for any marketing review. Clicks are only part of the picture, and you should consider CTR alongside the content the ad sends users to.
Good CTR for Google Ads Search, Display and Shopping
Search ads earn the highest click-through rate because users have already shown intent. Google search ads show an average CTR of 6.66% across all industries (WordStream, 2025). Trueprofit’s CTR guide puts Shopping at about 0.9% and Display at about 0.46%, though it does not date these figures.
- Search: judge against your own baseline first, then against the figures above.
- Display: expect a low rate and judge it on conversion and cost.
- Shopping: compare product listings against each other, not against search.
Good CTR for Facebook, Instagram and Twitter Ads
Social feeds reward attention rather than intent, so click rates run lower. The median CTR for Facebook Ads in March 2023 was 1.49% across all industries. SEMfirms reports Twitter at 2%.
- Facebook: test creative and audience fit before changing the budget.
- Instagram: assess placement, since feed and story formats behave differently.
- Twitter: treat 2% as a reference point, not a guarantee.
Average CTR for Email Campaigns
The email click-through rate equals clicks divided by delivered emails. A 2 to 5% range is healthy, according to Trueprofit’s CTR guide, though the exact figure varies by sector. Include clear calls to action in each email so that readers know the next step, and make the linked content match what the subject line promised.
Why Industry Context Changes the Benchmark
Averages hide wide sector gaps. Dating and personal services sit well above average at about 3.40%. Your most reliable benchmark is your own history: track click-through rates by campaign type for three to six months, then compare new results against that baseline.
The Diagnostic Ladder: Four Quadrants and Their Fixes
Plot each campaign on two axes: CTR and conversion rate, each against your own baseline.
| Quadrant | What it looks like | Fix |
|---|---|---|
| Strong CTR, strong conversion | Clicks are relevant, and the page delivers | Scale the budget and protect the message |
| Strong CTR, weak conversion | The ad overpromises, or the page misses the offer | Align the landing page content with the ad headline and offer |
| Weak CTR, strong conversion | Few clicks, but those who come convert | Rewrite headlines, test position and widen reach |
| Weak CTR, weak conversion | Both steps fail | Fix targeting and keyword match before touching copy |
Set “strong” and “weak” using your own baseline from the last three to six months, not against an industry average.
CTR vs. Conversion Rate: A Comparison
Click-through rate and conversion rate answer different questions at different stages of the same content funnel.
| Aspect | Click-Through Rate (CTR) | Conversion Rate |
|---|---|---|
| What it measures | Share of impressions that earn a click | Share of clicks that complete a goal |
| Formula | (Clicks ÷ Impressions) × 100 | (Conversions ÷ Clicks) × 100 |
| Main driver | Ad copy, headline, position and audience fit | Landing page quality, offer and form experience |
| Warning sign | Low CTR suggests weak messaging or targeting | High CTR with low conversion suggests the ad overpromises |
Judge both together: CTR shows how well the message earns attention, while conversion rate shows whether that attention becomes business. Review the total number of impressions alongside both rates so small sample sizes do not distort your conclusions, since overall campaign performance depends on reading the two metrics as a pair.
How to Improve Your Click-Through Rate
Improve CTR one variable at a time so you can see which change caused the result. Click-through rate is an important metric for judging whether a headline, ad or listing is working.
Write Headlines and Ad Copy That Earn the Click
Lead with the specific benefit users want, and match the headline to the landing page offer. Include a clear call to action.
Use Keywords in URLs and Titles
One unverified third-party report says URLs with a keyword have a 45% higher click-through rate (SEMfirms). Test this on your own pages first.
Test Variations and Read the Results Correctly
Run one test at a time, and keep the sample large enough before deciding. Compare variants over the same period and baseline.
Use Quality Score Feedback to Lower CPC
Raising CTR from 2% to 4% can add roughly 1.5 points to the quality score, reducing cost per click, according to TrueProfit’s CTR guide. Judge the gain by your data.
Conclusion: Use CTR as a Diagnostic, Not a Scorecard
Use CTR to find where a campaign is weak, then use the Diagnostic Ladder to decide the fix. Read it with conversion rate and cost against your own baseline so you don’t mistake a high click-through rate for a good result.
What is a good click-through rate?
It depends on the channel and industry. Compare your results with your own byourfirst, then check the channel figures above against the latest report.
How do you calculate CTR?
Divide clicks by impressions and multiply by 100. For email, divide by delivered emails rather than sent emails.
Is a higher CTR always better?
No. A high CTR paired with low conversion can mean the ad overpromises, so read it alongside conversion rate and cost.
What is the difference between CTR and conversion rate?
CTR measures how many people who see an ad click it. Conversion rate measures how many of those clicks complete a goal.
What is the average CTR for Google Ads?
Google search ads show an average CTR of 6.66% across all industries, according to WordStream’s 2025 benchmark. Figures vary by format and sector.

How does CTR affect Quality Score?
A higher CTR can improve quality score, which can lower cost per click. Quality Score also depends on other factors, so judge the effect by your own cost data.
How to Improve Your Click-Through Rate
Start with the ad or listing that already gets seen, since a small CTR lift on a high-impression ad moves more clicks than a large lift on a rarely shown one. Comparing your rate against the average click-through rate for similar campaigns shows where a page or ad stands, and a good CTR depends on placement, industry and search intent. CTR is a ratio of clicks to impressions and is calculated by dividing clicks by impressions. Tracking CTR matters because it signals how well your ad or listing matches what searchers want, and a low CTR is often the first sign your listing content needs work.
Write Headlines and Ad Copy That Earn the Click
Lead with the specific benefit a searcher wants, echo the query’s own words, and keep the promise accurate. Add one clear call to action, such as “Get a quote” or “Compare plans.” The headline promise should match what the landing page delivers, since users who find that match are more likely to act.
Use Keywords in URLs and Titles
A keyword-containing URL is a simple variable to test. According to SEMfirms, URLs that include a keyword have a 45% higher click-through rate than URLs without one. This is an unverified third-party figure, so test keyword URLs on your pages before relying on it.
Test Variations and Read the Results Correctly
Change one variable at a time, run each version until it has enough impressions to be meaningful, and compare conversion rate alongside click-through rate. A version that wins on clicks but loses on conversions is a loss. Judge each test by its overall performance, not by clicks alone.
Use Quality Score Feedback to Lower CPC.
Click-through rate is a factor in Google Ads Quality Score. Trueprofit’s CTR guide suggests that raising CTR from 2% to 4% can lift Quality Score by about 1.5 points, a third-party estimate rather than a published Google figure. Google describes expected click-through rate as one component of Quality Score, as set out in Google’s Ads Help Quality Score article. Check Quality Score after each change to see whether it moves in the right direction.
Conclusion: Use CTR as a Diagnostic, Not a Scorecard
A click-through rate shows whether an ad, listing or email earned attention, not whether that attention was worth paying for. Apply the Diagnostic Ladder above, then act on one of four classifications.
| Classification | CTR | Conversion rate | Action |
|---|---|---|---|
| Strong | Above channel benchmark | Above your average | Scale the campaign and its budget |
| Misleading | Above benchmark | Below your average | Align the ad copy with the landing page |
| Weak hook | Below benchmark | Above your average | Rewrite the headline to earn more clicks |
| Weak | Below benchmark | Below your average | Pause or rebuild the ad and its offer |
Build benchmarks from your history, since industry averages blend very different results. Compare each campaign against its past performance in the Google Ads and Meta Ads Manager dashboards. Treat the most important metric as the one tied to revenue, not the raw click count. For a broader view of paid results across your marketing channels, see Media One Marketing.
What is a good click-through rate?
It depends on the channel and industry. According to Trueprofit’s CTR guide, Google Search ads average about 3.8%, Facebook about 1.63%, and LinkedIn about 0.74%. Treat these as a starting point, not a verdict.
How do you calculate CTR?
CTR is calculated by dividing clicks by impressions, then multiplying by 100: CTR = (Clicks ÷ Impressions) × 100. An ad shown 20,000 times that earns 400 clicks has a click-through rate of 2%.
Is a higher CTR always better?
No. A high CTR inflated by vague copy brings in people who leave without converting. Check CTR alongside conversion rate and cost per acquisition.
What is the difference between CTR and conversion rate?
CTR measures how many people who see an ad click it. Conversion rate measures how many clicks complete the goal, such as a purchase or sign-up. A high CTR with a weak conversion rate usually signals a mismatch between the ad promise and the landing page. Clear calls to action on the landing page help close that gap.
What is the average CTR for Google Ads?
Google search ads average 6.66% CTR across all industries, according to WordStream’s 2025 data. Display ads average around 0.46%, so compare results against the format you run.
How does CTR affect Quality Score?
Google uses expected click-through rate as one input to Quality Score, so a stronger rate can help lower cost per click. Trueprofit estimates that raising CTR from 2% to 4% lifts Quality Score by about 1.5 points, based on third-party estimates. Check Quality Score in the Google Ads dashboard.