
SEO KPIs show whether search is moving your business forward. Rankings and traffic alone tell you little. Five to eight core KPIs suit most teams, each answering one business question and tracked in Google Search Console and Google Analytics.
Key Takeaways
- Track outcomes first: organic conversions, leads and revenue from search justify SEO spend.
- Visibility runs 0 to 100%: a growing site might sit at 30-40%; 100% is unrealistic.
- Impressions count links shown: Google counts one when a user sees your site’s link on a results page.
- Expect clicks to lag: nearly 60% of Google searches in 2024 ended without a click.
- Keep health metrics current: Interaction to Next Paint (INP) replaced First Input Delay (FID) as a Core Web Vital in March 2024.
- Pass three tests before adding a KPI: it must move with business value, be actionable within a quarter, and be measurable in Google Search Console or Google Analytics.
What SEO KPIs Are and Why Tracking Them Matters
SEO KPIs definition
SEO KPIs are measurable indicators that show whether search optimisation delivers results for the business. A KPI is only useful when tied to a goal and when its number changes the next decision. Rankings, impressions, clicks, sessions and conversions can all qualify.
Search visibility is one example. Traffic Think Tank describes it as a percentage from 0 to 100%, showing how much of your target keyword set you own.
The importance of tracking SEO KPIs
Without agreed KPIs, reporting drifts toward whichever number looks best that month. Keep a short list of five to eight KPIs, reviewed on a fixed cadence with named owners and targets. You can then check every website decision against the same measures, and keep marketing and strategy performance visible to the whole team.
Why a rank report alone misleads you
A rank report shows position, not clicks or enquiries. Search Engine Land reports that nearly 60% of Google searches in 2024 ended without a click, so a strong position can still send little traffic. Pair keyword rankings with content metrics, analytics and performance data, and track user engagement alongside them.
Worked example: a page holds position 4, impressions rise, but clicks fall. Check first whether a featured answer now sits above the result. If it does, rewrite the title so it answers the question directly, rather than chasing a higher ranking, since the user experience on the page matters more than the position alone.
Decision rule: if rankings hold for three consecutive months and clicks fall more than 20%, check the results page before changing the content.
The Core SEO KPIs: Visibility, Traffic and Engagement
Keyword rankings and search visibility
Search visibility is a score from 0 to 100%. A score of 0 means your website does not rank on Google for any keyword. Each tracked keyword adds weight, so the figure shows how much of your target market can find your pages, not how high one page sits. Track it across your core keyword set, since it directly measures whether your SEO performance is improving and whether your SEO success is building over time. Use SEO tools and a clear SEO strategy to monitor this score across your important keyword set.
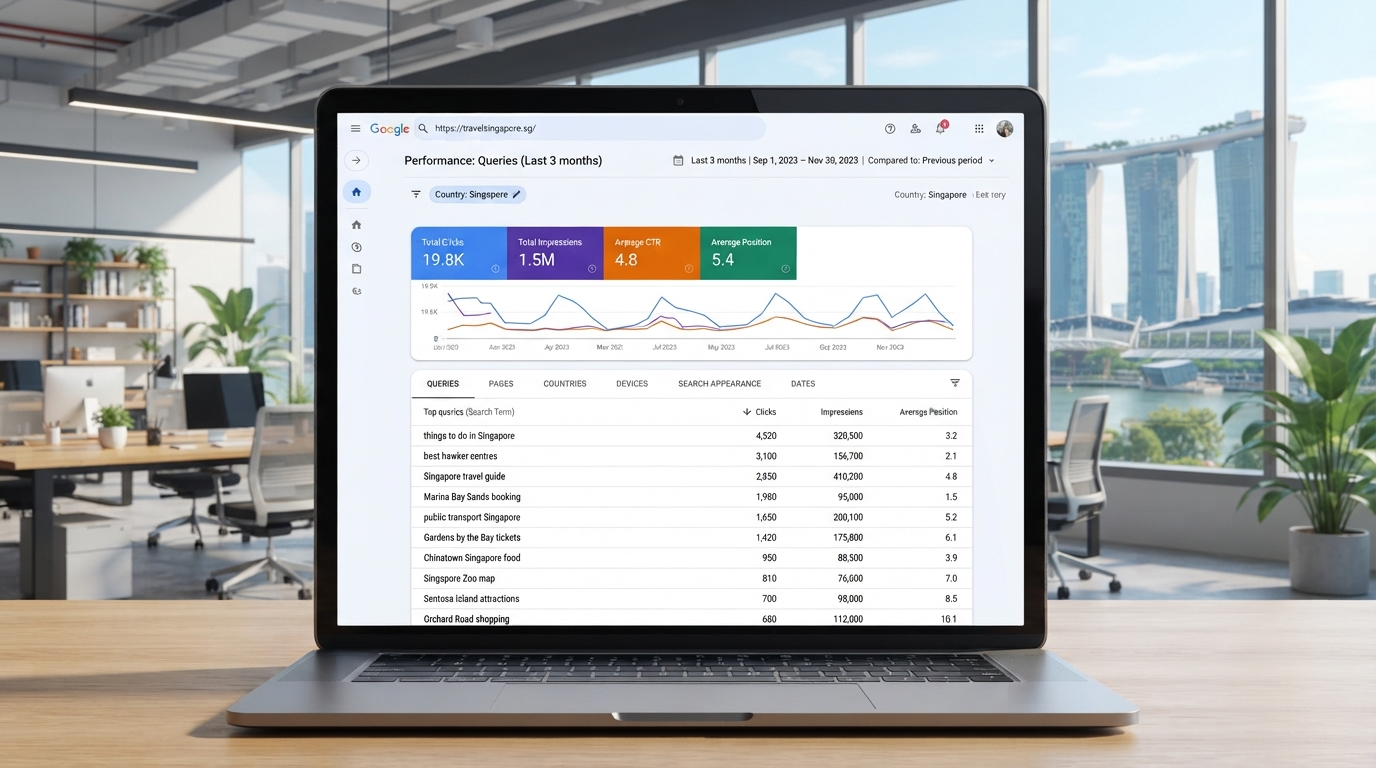
Traffic Think Tank suggests 30-40% visibility may suit a growing website. Treat that as an indicative benchmark from a single source, not a rule. Reaching 100% is unrealistic even for established sites.
For a Singapore business, benchmark against local competitors rather than global leaders. Search behaviour and competitor density differ from larger markets, so a modest score against US brands may be strong locally. Record a baseline and judge progress by the quarterly trend.
Decision rule: if visibility falls for two quarters in a row, review the keywords you lost before adding new content.
Impressions and click-through rate
An impression counts each time a URL from your site is displayed in search results, excluding paid search ads. It shows the page was seen, not that anyone read it.
Click-through rate (CTR) is clicks divided by impressions. Many impressions with a low CTR usually mean the title or description does not match what the searcher wanted, or that features above your result are taking the attention.
Around 60% of Google searches in 2024 ended without a click, according to Search Engine Land. When impressions hold but clicks fall, check whether the answer appears on the results page before concluding SEO has failed.
Worked example: a query gets 2,000 impressions and 40 clicks, a CTR of 2%. If similar pages get more clicks, rewrite the title to answer the query in its first few words.
Decision rule: if a page’s CTR stays below 2% for a full quarter, rewrite its title and meta description.
Organic traffic, branded vs non-branded traffic
Organic traffic is visits from unpaid search results. Total traffic can rise because more people already know your name, so split it into branded and non-branded traffic to see where growth comes from. Use the same split each period so the trend stays comparable, and track which queries drive engagement with your brand versus new discovery. Marketing teams can use this split to judge whether their results depend on existing awareness or on new demand. This is an important check on whether your website’s SEO strategy is reaching new audiences.
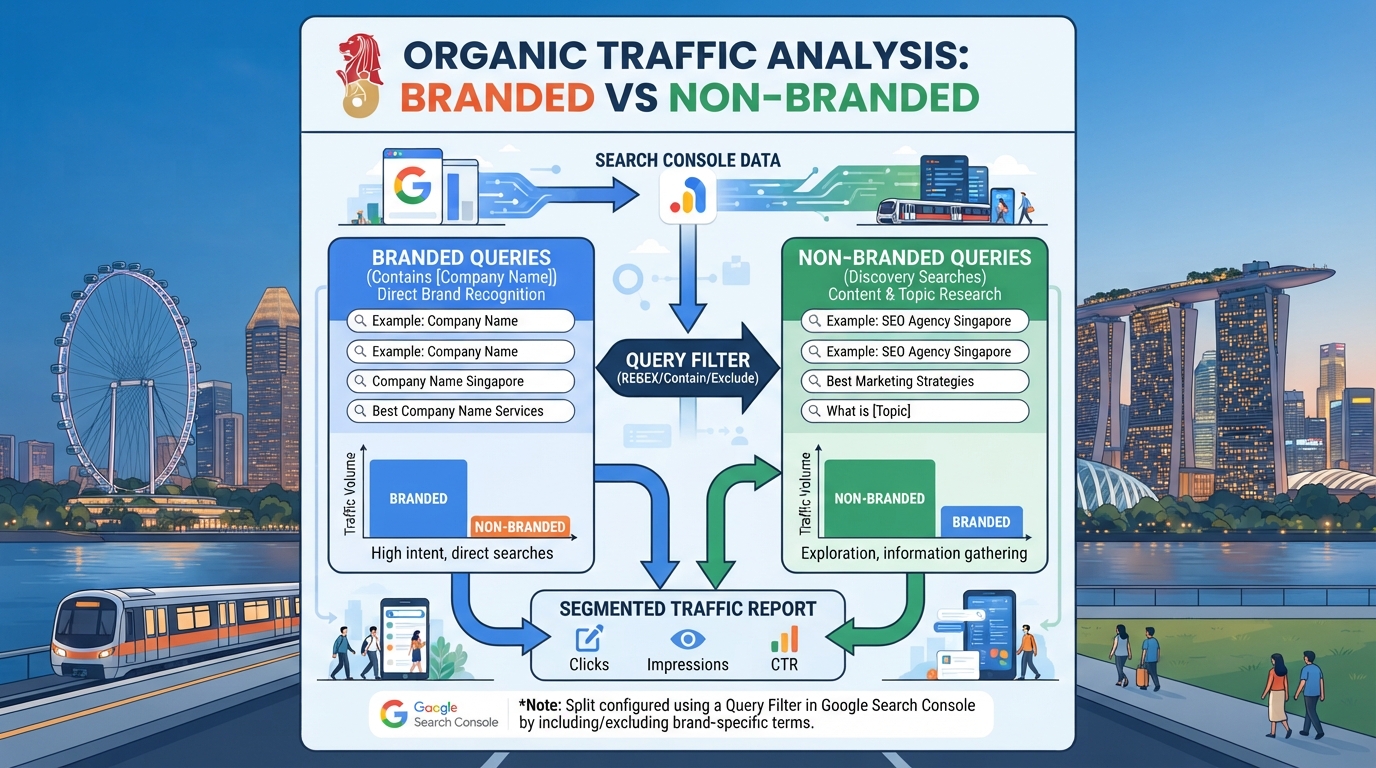
Branded traffic measures demand you have already created. Non-branded traffic measures new discovery.
Singapore worked example: record your branded query clicks and your non-branded query clicks per quarter in Search Console. Divide the non-branded figure by the total to get your non-branded share, and compare that share across two years. If the share falls while total traffic rises, your growth depends on existing awareness.
Decision rule: if non-branded share drops for two quarters, shift effort toward content that targets discovery queries.
Session duration, bounce rate and page load speed
Session duration and bounce rate show whether a page matches the intent behind the search. A long session on a page that answers the query indicates a positive outcome. A brief visit that ends on the first page suggests the content is off-target, which points to a weak user experience.
Core Web Vitals are the standard measure of page load speed. Three metrics matter:
- Largest Contentful Paint (LCP): how long the main content takes to appear. Aim for 2.5 seconds or less.
- Cumulative Layout Shift (CLS): how much content moves while loading. Aim for 0.1 or less.
- Interaction to Next Paint (INP): how quickly the page responds to a click or tap. Aim for 200 milliseconds or less.
Traffic Think Tank notes that INP replaced First Input Delay (FID) as a Core Web Vital in March 2024. Google’s Web Vitals guidance sets out these thresholds, and you should check them against your own measurements.
If INP is poor, reduce or defer the scripts blocking the main thread. If LCP is poor, compress the largest image or text block. If CLS is poor, set the width and height on images and avoid inserting content above existing content.
Measure these values in PageSpeed Insights or the Core Web Vitals report in Search Console, with tracking set up so the results are recorded over time. For a Singapore audience, test on mobile connections as well as desktop, since many local searches happen on phones. Faster pages also give your users a smoother experience, which supports stronger performance across the site.
Decision rule: if a high-traffic page fails any Core Web Vital for a full month, fix that page before publishing new content.
Conversion and Authority KPIs That Prove Business Value
Track the metrics that show whether search work produces revenue. Conversion and authority KPIs answer that question more directly than rankings or raw traffic, which often hide low-intent visits that never buy. Working professionals should judge SEO performance by business outcomes, not by how many search engines send visitors to the website.
Organic conversions
A conversion is any action your business has decided is worth money, such as an enquiry, booking, purchase or phone call. Organic conversions are those that began with an unpaid search result, linking search performance to revenue or leads. Users who arrive from keywords they already trust often convert at a higher rate than casual visitors.
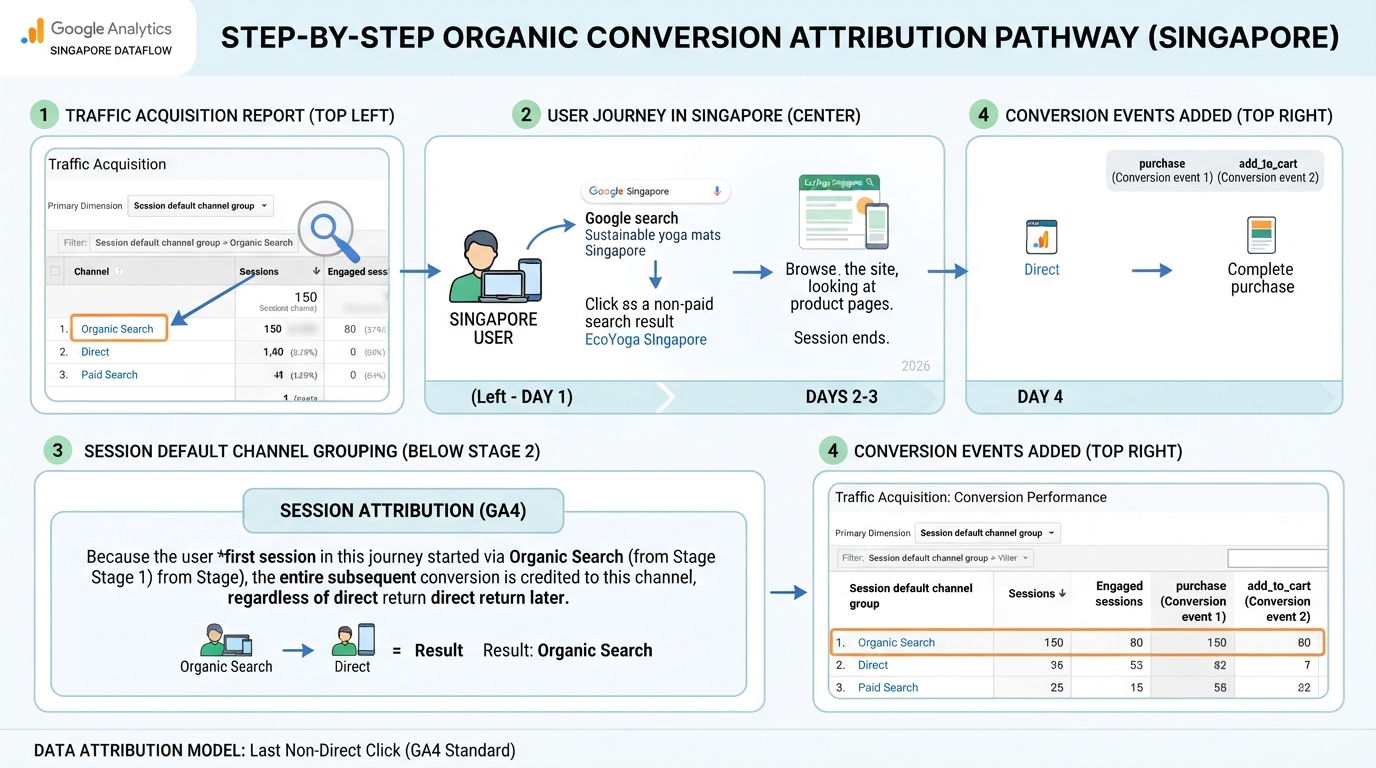
To attribute organic conversions in Google Analytics:
- Open the Traffic Acquisition report.
- Set the primary dimension to Session default channel group.
- Filter for Organic Search.
- Add your conversion events as columns.
- Check the attribution model first. Last-click credits the final touchpoint before a conversion, so a paid ad can receive credit for a visitor who first found you through organic search. Data-driven attribution, where available, distributes credit across touchpoints based on observed patterns, which can give a fairer view of organic influence.
Track qualified actions, such as quote requests, and treat newsletter sign-ups as a secondary signal. Judge each page by the conversions it drives, not by visit volume alone. Use these reports to see which user journeys produce revenue over time.
Decision rule: if organic conversions fall for two months while organic sessions hold steady, review landing page calls to action and forms before changing rankings.
Worked example: a page gets 400 organic sessions and 8 quote requests in a month, a 2% conversion rate. If quote requests drop to 3 with similar sessions, the page needs a conversion fix, not more content.
Backlinks and referring domains
A backlink is any link from another website to yours. Total backlink counts are easy to inflate, so referring domains, the unique websites linking to you, are the more useful signal for your SEO strategy. Ten links from ten independent, relevant sites usually indicate more authority than a thousand links from one source. Google Search Console’s Links report displays the linking domains, and search engines weigh those domains as a sign of trust.
Track referring domain growth monthly and note which pages attract them. Guides and data studies tend to earn durable links because they give users a reason to reference your content.
Decision rule: if a page with good rankings gains no referring domains over two quarters, add a unique data point or original example before building outreach.
Choosing which SEO KPIs to track
Most dashboards fail because they track everything. Score each candidate KPI from 1 (weak) to 3 (strong) on four questions:
- Business goal alignment: does this metric move when business value moves?
- Controllability: can your team change it within a quarter?
- Data reliability: can you measure it accurately in Google Search Console or Google Analytics?
- Decision value: if the number changes, does it tell you what to do next?
A KPI scoring 9 or above earns a place on the main dashboard. Anything lower belongs in a diagnostic appendix.
| KPI | Business goal alignment | Controllability | Data reliability | Decision value | Total | Keep on dashboard? |
|---|---|---|---|---|---|---|
| Organic conversions | 3 | 2 | 2 | 3 | 10 | Yes, as a primary outcome KPI |
| Non-branded organic traffic | 3 | 3 | 3 | 3 | 12 | Yes |
| Click-through rate | 2 | 3 | 3 | 3 | 11 | Yes |
| Search visibility | 2 | 3 | 2 | 2 | 9 | Yes, as a relative benchmark |
| Referring domains | 2 | 2 | 3 | 2 | 9 | Yes |
| Total backlinks | 1 | 1 | 2 | 1 | 5 | No, diagnostic only |
| Raw sitewide sessions | 1 | 2 | 3 | 1 | 7 | No, diagnostic only |
Organic conversions score lower on reliability because attribution models shift the totals, so report them alongside a stated model. Re-run this scoring yearly and whenever your business stage changes, and check how user engagement and time on page change after each adjustment.
Setting Up Measurement: Google Analytics, Search Console and Reporting
Most SEO dashboards fail because nobody decides which tools own which number. Google Search Console shows how your pages appear in search results. Google Analytics shows what users did after arriving. Connect both and assign each SEO KPI to one owner tool, so your team never quotes two different organic traffic figures. Consistent measurement keeps marketing reports trustworthy.
Which tool owns which metric?
| Tool | Metrics it owns | Question it answers |
|---|---|---|
| Google Search Console | Impressions, clicks, click-through rate, average position, queries | How do we appear in *search engines*? |
| Google Analytics | Organic sessions, engagement, conversions, branded versus non-branded traffic, bounce rate | What do users do after the click? |
Search Console is the source of truth for visibility KPIs. Google Analytics owns outcome KPIs. Page speed comes from Google’s field data, and backlink counts come from a dedicated link index.
Setup checklist
- Verify your website as a domain property in Search Console.
- Submit your XML sitemap and confirm your pages are indexed.
- Install Google Analytics on every page and confirm real-time data appears.
- Link Search Console to Google Analytics from the Admin settings.
- Set Organic Search as a default channel grouping and exclude paid search.
- Mark key actions, such as form submissions, purchases and calls, as conversion events.
- Record dated baseline values for every KPI in one shared sheet.
Sample monthly reporting cadence
- Week 1: Pull last month’s outcome KPIs from Google Analytics, including organic conversions and revenue.
- Week 2: Pull visibility KPIs from Search Console, comparing impressions, clicks and click-through rate with the prior month. Note the keyword rankings that moved most.
- Week 3: Review health KPIs and flag any page below your speed threshold.
- Week 4: Write a one-page summary stating the one decision the team will take next month, tied to performance against baseline.
Reviewing the same metrics on the same day each month makes trends visible and prevents reactions to single-day spikes. A Singapore team reporting in S$ should also record local-language and English-only query splits, and track seo success across both.
Conclusion and Summary
Track SEO KPIs tied to business outcomes, such as qualified organic conversions and branded demand, not rankings or raw traffic. Search Engine Land reports that 60.45% of Google searches in 2024 ended without a click. Read KPIs together: rising impressions with flat clicks signal a click-through problem.
Frequently Asked Questions
What are the most important SEO KPIs?
The most important SEO KPIs tie to business outcomes: organic conversions, leads, or revenue from organic search. Visibility metrics such as impressions, click-through rate and non-branded share explain why those outcomes move. Health metrics like page speed and referring domains show whether the website can keep performing.
How many SEO KPIs should I track?
Track a small set, usually five to eight, grouped into outcome, visibility and health tiers. Each KPI should have an owner, a target and a clear action if it moves the wrong way. If you cannot say what you would do differently, remove it.
What is a good search visibility score?
Search visibility is a percentage from 0 to 100%. Traffic Think Tank suggests 30-40% may suit a growing website, while 100% is unrealistic even for established sites. Treat these as indicative only, and set your baseline against local competitors.
Why do impressions matter if they don’t produce clicks?
Impressions show how often your URLs appeared in results, making them a top-of-funnel metric. Google’s definition counts an impression when a URL from your site is displayed in a user’s search results, excluding paid Google Ads impressions. When impressions rise, but clicks lag, zero-click search is often the cause, so watch click-through rate alongside impressions.
Which tool should I use to track SEO KPIs?
Use Google Search Console for visibility, impressions, clicks and click-through rate, and Google Analytics for organic sessions, engagement and conversions. Add a page speed tool for health metrics, and record definitions in writing.
How often should I review SEO KPIs?
Review KPIs monthly, with a quarterly strategy review. Treat a single month’s movement as a signal only when it persists across two or more reviews. Revisit the KPI set yearly, since platforms change their metrics.