

High ROAS doesn’t guarantee profit. Whether a campaign makes money depends on your gross margin, sales cycle, and customer value after the first purchase. A 4:1 ROAS can be a clear win for one business and a loss for another.

This guide explains how to calculate ROAS, how it differs from ROI and CPA, and how to find your break-even point. We argue that many Singapore advertisers over-optimise for ROAS and under-invest in margin data, so the sections below focus on the margin figures that determine whether a campaign pays off. Measured against your return on investment target, ROAS shows only part of the picture. We also cover benchmarks by business model, common mistakes that distort results, and ways to improve these numbers. Examples use Google Ads and Meta with S$ pricing.
Key Takeaways
- ROAS is revenue divided by ad spend. A 4:1 ratio means you earn S$4 for every S$1 spent.
- A high ROAS does not guarantee profit. Break-even ROAS is 1 ÷ gross margin, so a 25% margin needs 4:1 just to break even.
- Set campaign targets from your own margin, not a generic benchmark.
- Align your attribution window with your sales cycle, as B2B sales can take months.
- Reconcile platform-reported ROAS with recorded revenue before making budget decisions.
What ROAS Is and Why It Matters
Return on ad spend (ROAS) tells you how much revenue your advertising brings in for each S$1 spent. A ROAS of 3.0 means you earn S$3 for every S$1 spent, a 300% return. WordStream describes the metric this way.
ROAS appears as a ratio (4:1) or a percentage (400%). Both mean the same thing.
ROAS measures advertising efficiency, not profit. It counts revenue, not what you keep after product costs, staff and overheads. A marketing campaign can show a strong ROAS and still lose money, which is why this guide centres on margin. Marketing teams should pair ROAS with clean cost and margin data before judging a campaign.
The ROAS Calculation Formula
ROAS = revenue attributed to ads ÷ ad spend.
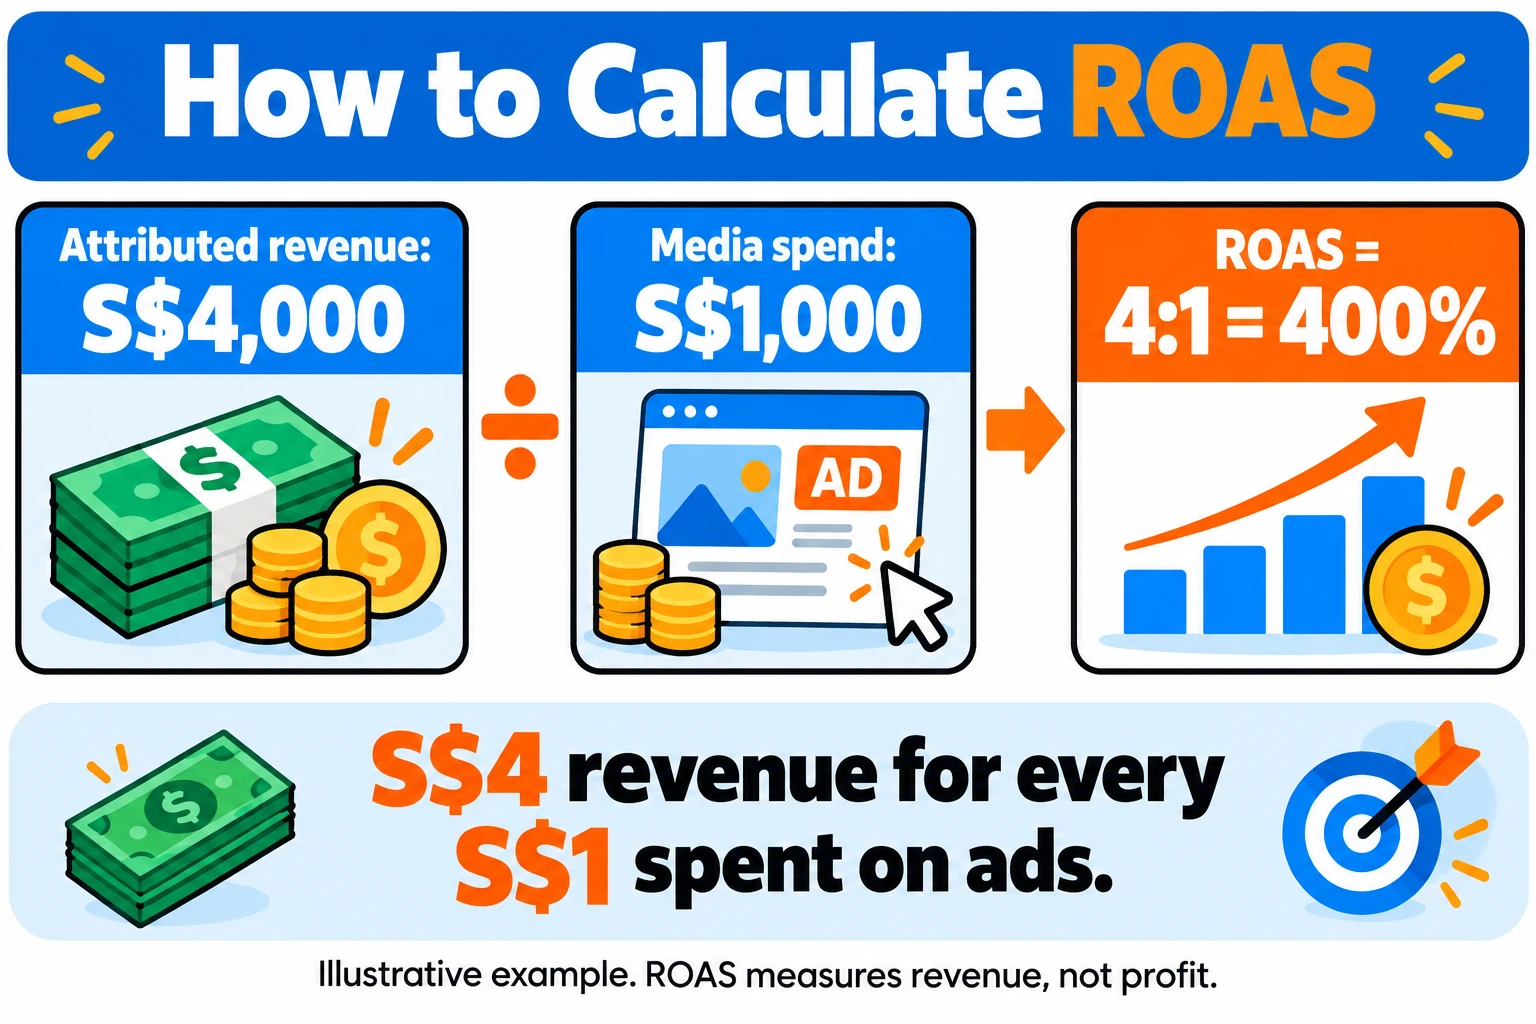
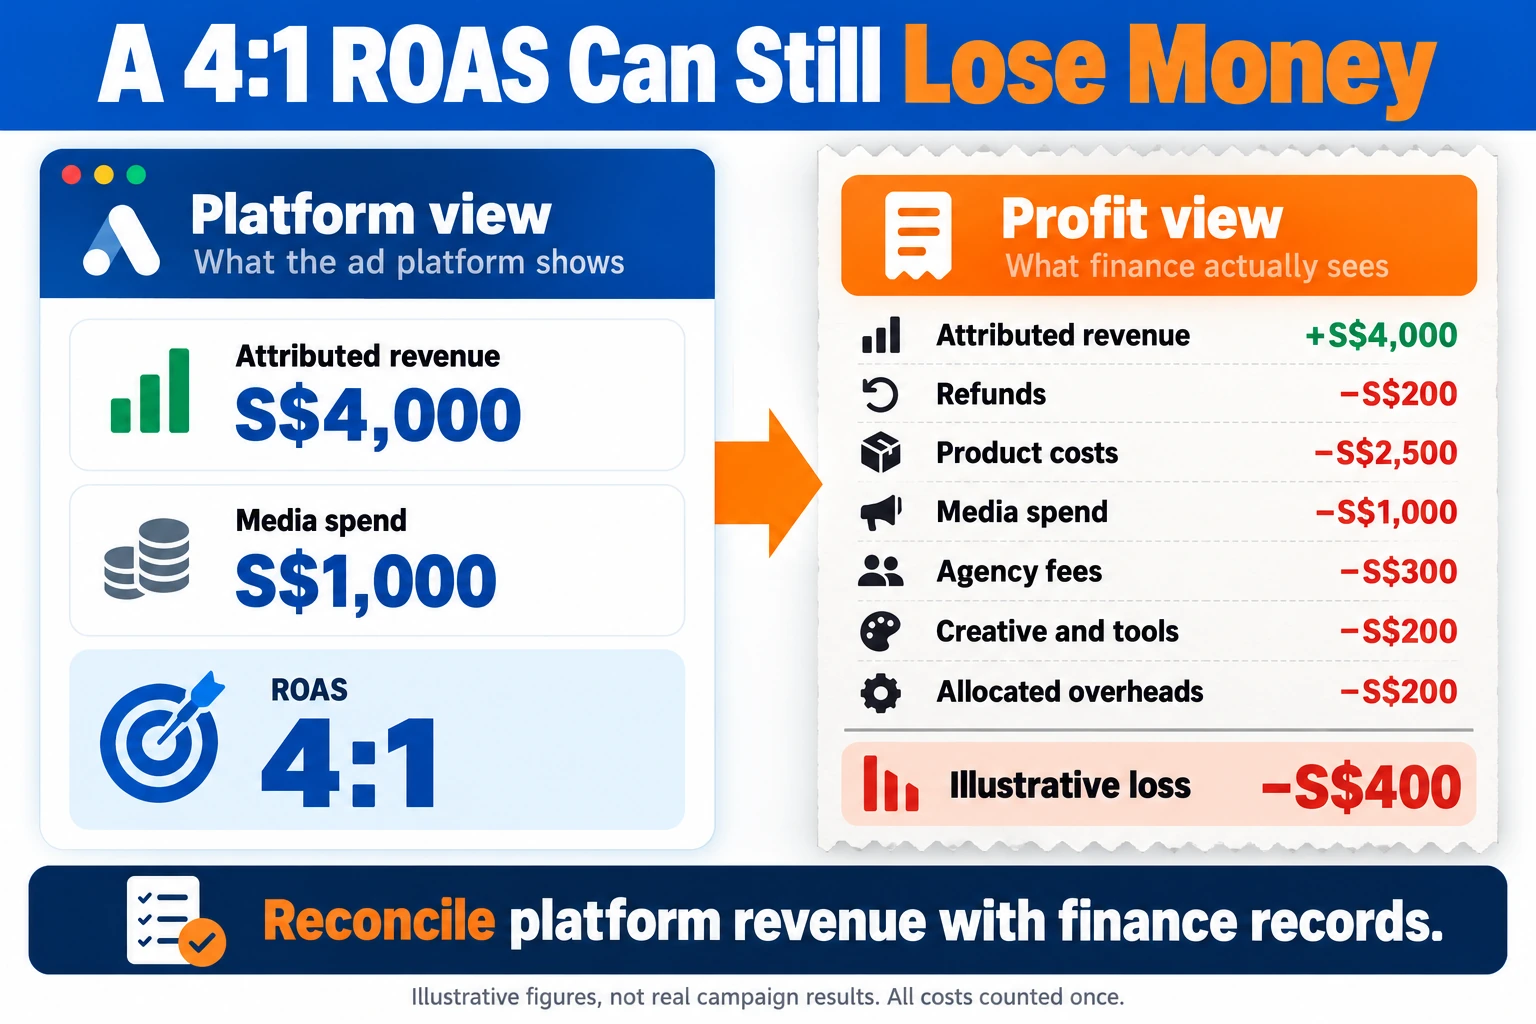
Spending S$1,000 on Meta ads that generate S$4,000 in sales gives a 4:1 ROAS, or 400%. Needle uses this same example. One ad group earning S$300 from S$100 spent has a ROAS of 3.0; another earning S$50 from the same spend has a ROAS of 0.5. Track this metric against your total revenue to see how ad spend contributes to overall growth. Let’s compare each ad group’s results side by side to spot the strongest performers.
This is a worked example in Singapore dollars. At a 25% gross margin on a S$100 product, break-even ROAS is 1 ÷ 0.25 = 4:1. A 4:1 result recovers the S$1,000 spent but makes no profit. On a product with a 50% margin, the same result yields S$2,000 gross profit, so the campaign is profitable.
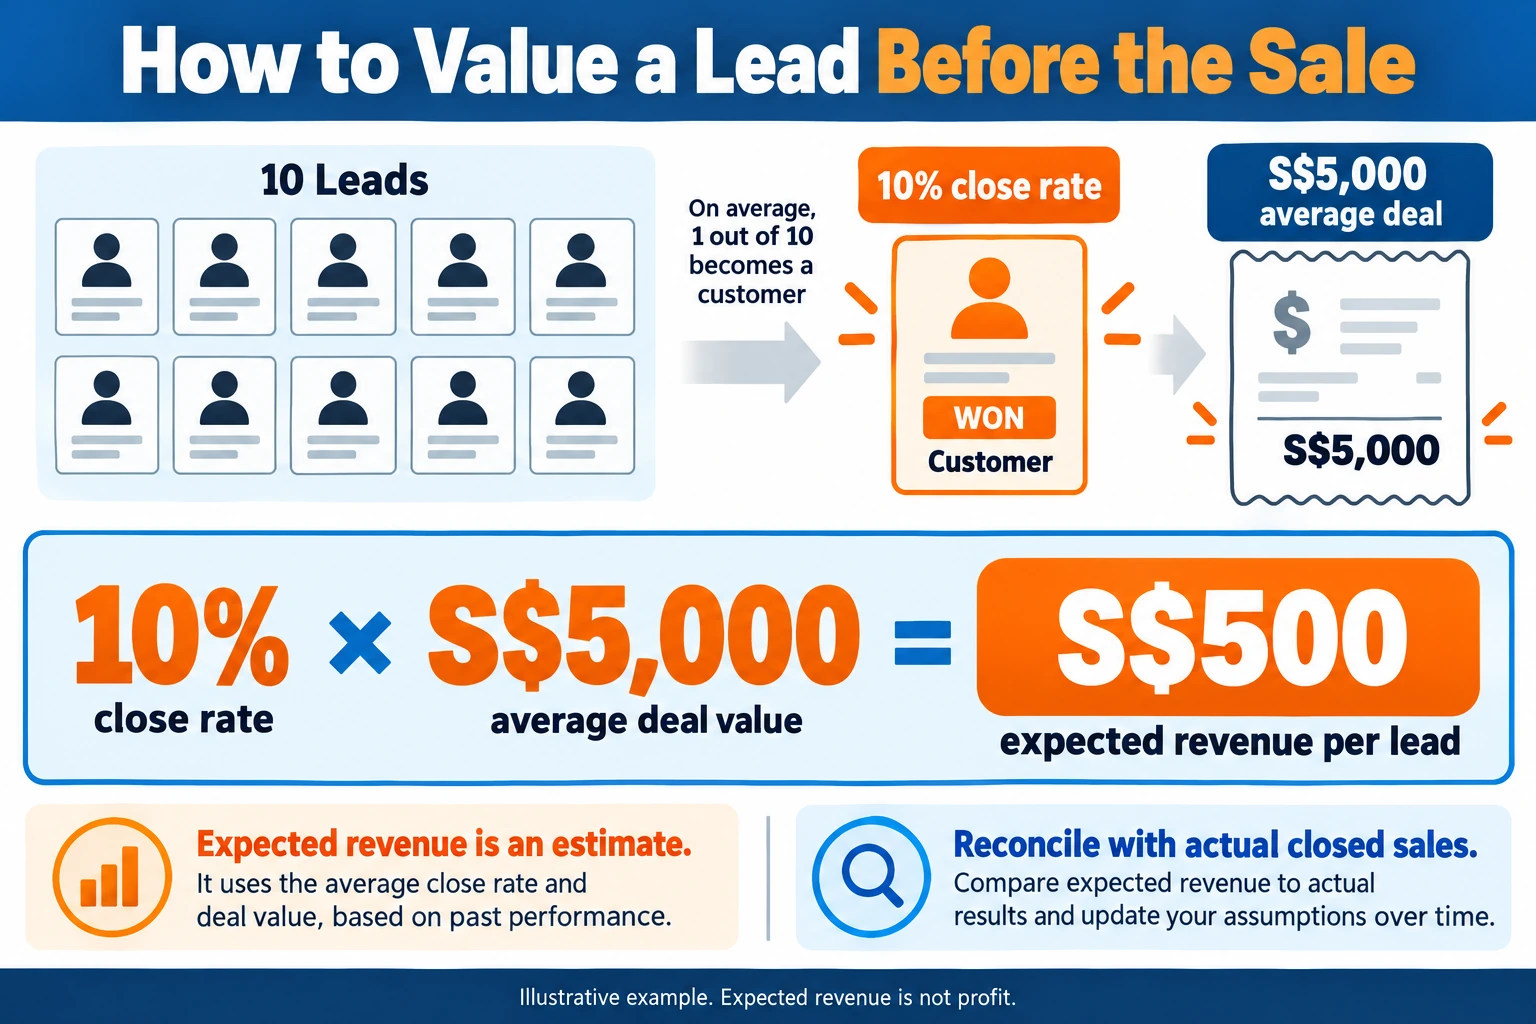
Lead generation has no immediate sale. Value each lead by expected closed revenue: if you close 10% of leads worth S$5,000 each, a lead carries S$500 of expected revenue, which becomes your revenue input. Track each lead’s conversions to refine this estimate over time.
Typical Singapore ROAS by margin. As a worked estimate rather than a sourced benchmark, a business with a 25% margin needs about 4:1 to break even, and a 50% margin business needs about 2:1. Set your target above your own break-even figure, and treat any published range as context only, since costs per click for categories such as retail, professional services and education vary and should be checked against your platform data.
ROAS vs. ROI and ROAS vs. CPA
| Metric | What it measures | Inputs | Best used when |
|---|---|---|---|
| ROAS | Ad revenue relative to ad spend | Attributed revenue, ad spend | Comparing campaigns or channels on efficiency |
| ROI | Total return after all costs | Net profit, total investment | Judging whether the business as a whole is profitable |
| CPA | Cost to acquire one customer or lead | Total spend, conversions | Controlling acquisition cost per customer |
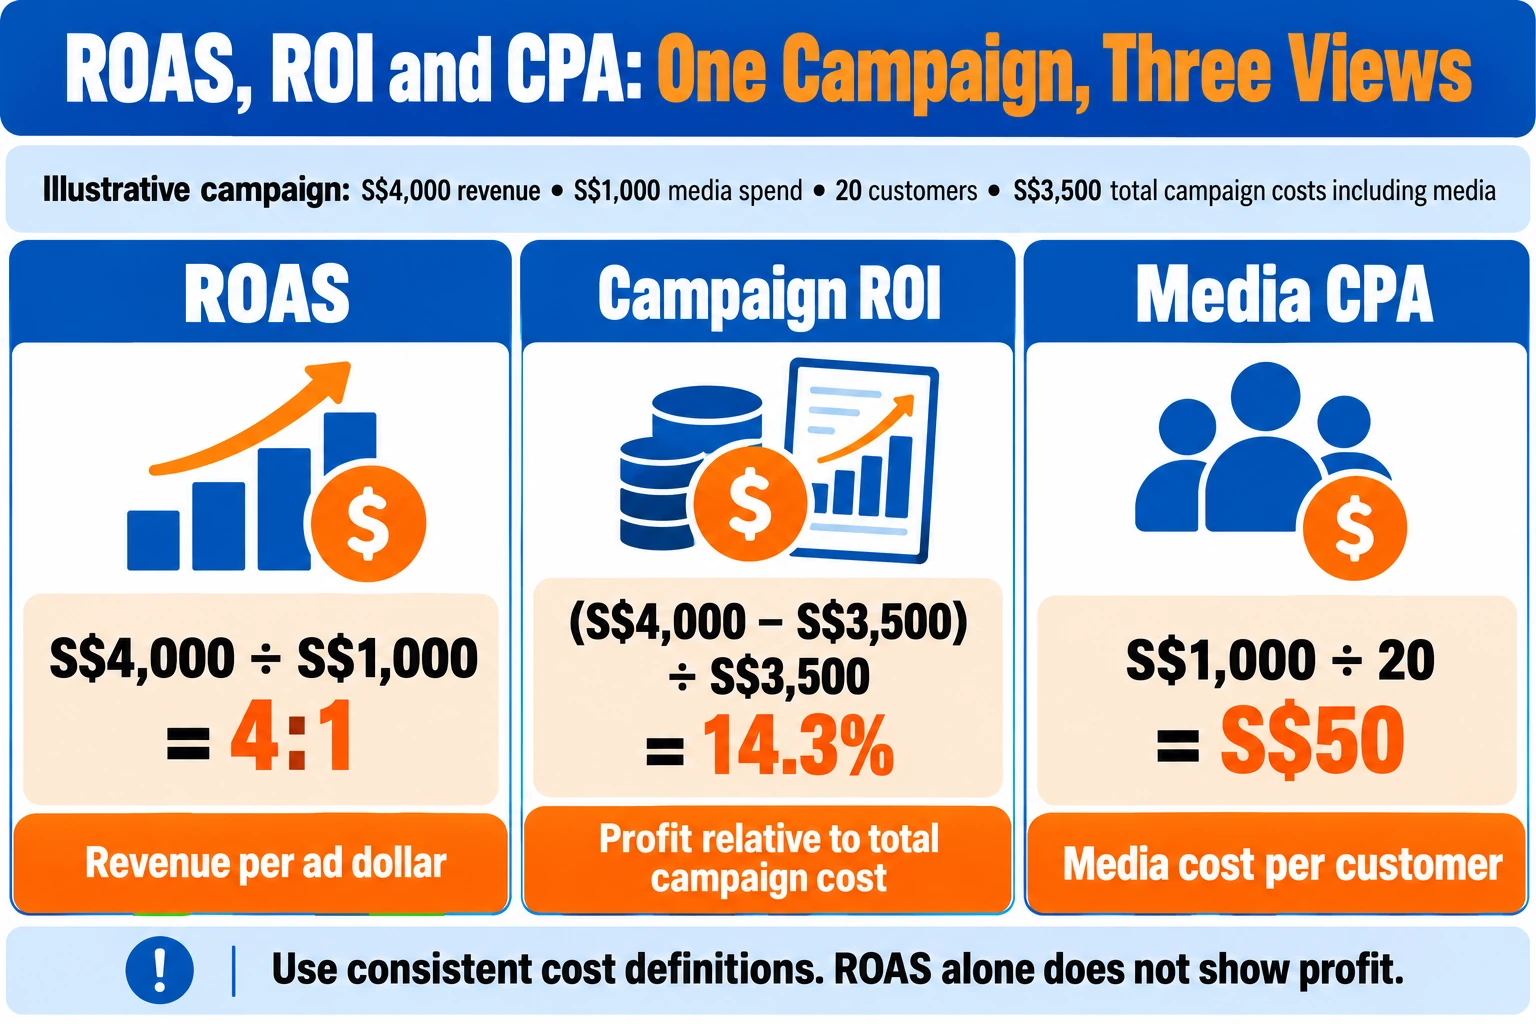
ROAS (return on ad spend) ignores margin and overhead, while return on investment (ROI) accounts for total return, which finance teams value most. ROAS helps you compare ad efficiency, but it does not show overall profitability.
A lower CPA can still mean weaker revenue. If cheaper conversions bring in low-value orders, ROAS can fall even as CPA improves, so check both before judging a campaign. A customer’s lifetime value shows whether those cheaper conversions are worth keeping, so track it alongside both metrics to spot this pattern early.
Break-Even ROAS: The Profitability Floor
Headline ROAS says little about profit on its own. The floor beneath it matters more, and it tells working professionals whether a campaign truly pays.
Break-even ROAS is 1 divided by the gross margin. At a 25% margin, 1 ÷ 0.25 = 4, so a campaign needs at least 4:1 ROAS just to cover product cost. Anything below that loses money before overheads.
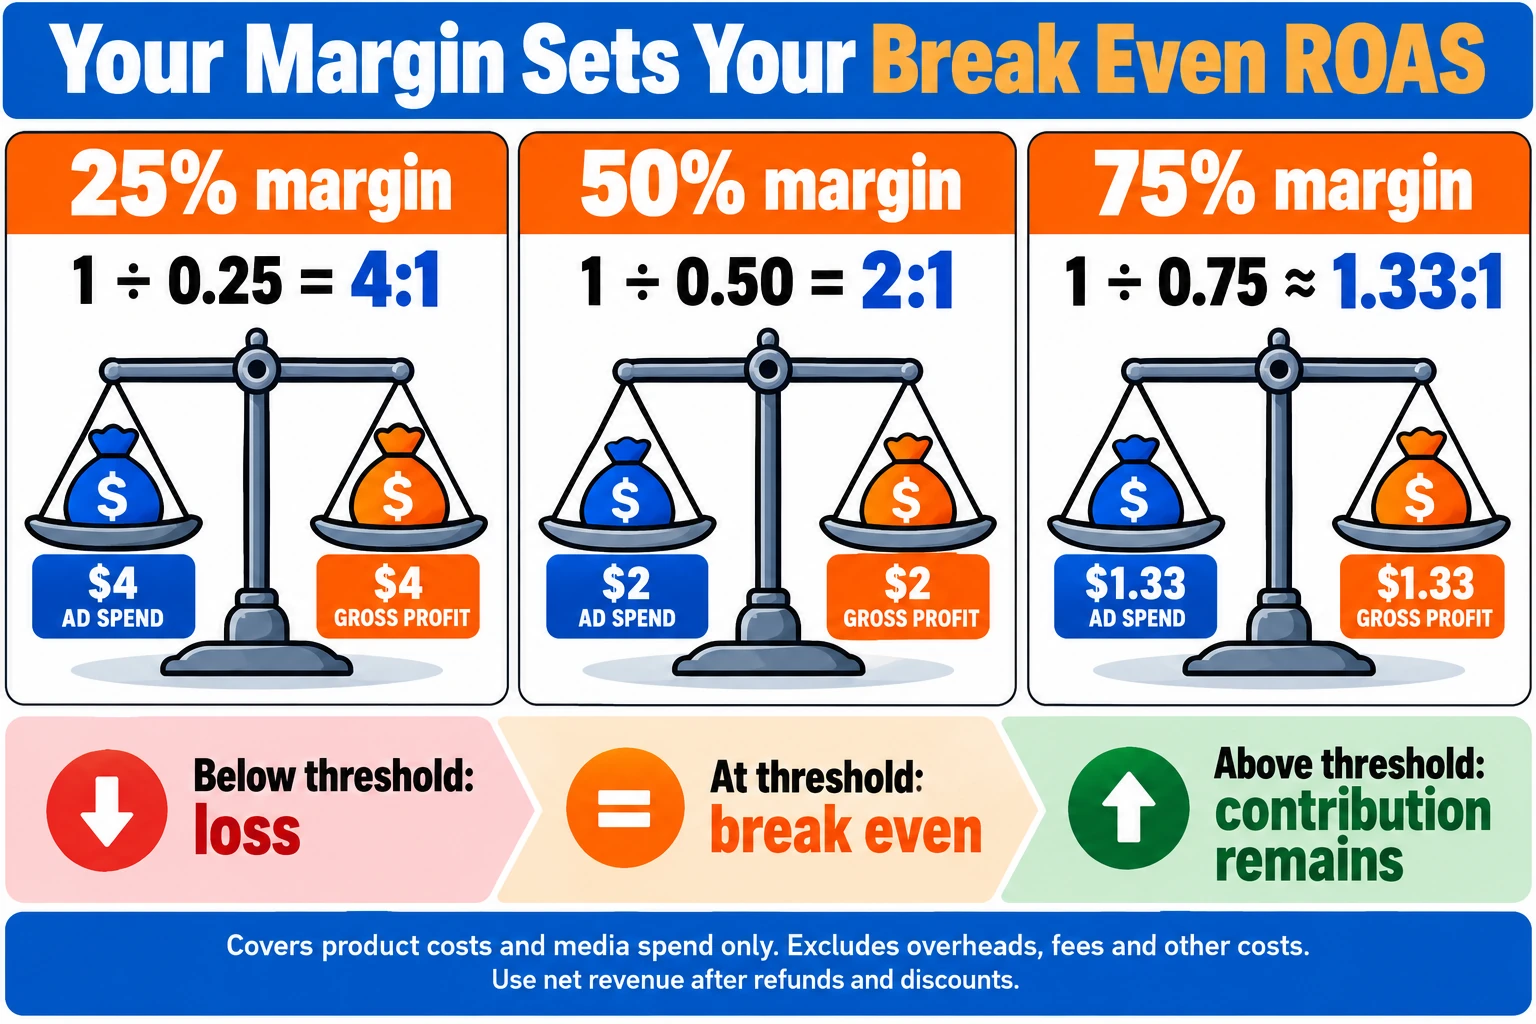
The same ratio means different things across businesses. A 2:1 ROAS is a clear loss at a 25% margin but healthy for a SaaS company with a 70% margin, where break-even sits at about 1.43:1. Break-even assumes the margin is gross margin after product or delivery cost, that the revenue figure excludes refunds and discounts, and that overheads are ignored, so let’s compare actual ROAS to your own break-even figure with those assumptions stated, not a generic benchmark.
Common ROAS Calculation Mistakes
- Counting gross revenue. Subtract refunds, returns and discounts before dividing.
- Relying on last-click attribution. It credits the final click and undervalues the ads that started the purchase.
- Judging too early. B2B or high-ticket sales can take months, so short attribution windows make good campaigns look weak.
- Leaving costs out. Agency fees and creative production belong in the cost base.
- Mixing attribution windows. Platform ROAS figures are only comparable when windows match, so check which window each platform’s advertising report uses before comparing them.
Total Ad Cost Accounting
Build the cost base from four lines: media spend, agency fees, creative production and tooling.
Divide revenue by this full figure to get true ROAS. It will be lower than the platform number, which also raises your break-even target. Keep revenue and total cost on the same basis each month, and reconcile platform-reported revenue with finance records before acting.
Benchmarks vary by platform. Search ads capture people already looking to buy, so their ratios often run higher than broad social campaigns that create demand. Attribution matters, too: a platform that credits itself with every touchpoint reports a higher figure. Compare only campaigns measured the same way.
Treat any benchmark as a directional reference, not a target. The useful question is whether your ratio clears your own break-even point.
Digital advertising accounts for 69% of total global ad spend in 2026, according to SaleHoo’s global advertising outlook, so small gains in ratio add up quickly.
ROAS Targets by Business Model
Margin sets the floor. Frozen Crow’s ROAS guide shows how the acceptable ratio moves with margin:
| Business model | Gross margin | Break-even ROAS | Target ROAS |
|---|---|---|---|
| SaaS | 70% margin | About 1.43:1 | 3:1 to 4:1 |
| High-margin eCommerce | 40–50% | 2.5:1 | 4:1 to 6:1 |
| Low-margin eCommerce | 15–25% | 4:1 | 6:1 to 8:1 |
| Info products and courses | 60–90% | 1.1:1 | 3:1 to 5:1 |
The lower the margin, the higher the ratio you need for a campaign to pay. A 4:1 result is profitable for SaaS but only breaks even for a 25% margin store. Measuring revenue generated against lifetime value, rather than a single purchase, can shift a campaign’s acceptable ratio for each customer and can help a business judge whether a campaign is worth running.


Ways to Improve ROAS: Creative, Audience and Funnel

A low ROAS usually has one of three causes: the ad fails to earn attention, the audience is wrong, or the landing page loses people who had already clicked. Fixing the right one first saves budget, especially when you can see each campaign’s revenue and the metric that tracks it. Judging each change by the value of the customers it brings in keeps the focus on profit rather than clicks.
Creative. Test hooks (the first line or first three seconds), formats (static image, short video, carousel) and offers (a discount, a free trial, a bundle) one variable at a time, then keep the winner. A better click-through rate lowers cost per click, which lifts ROAS. If a hook lifts clicks by a fifth, the same budget reaches more potential buyers.
Audience. Broad targeting spreads spend across people who never buy. Narrow the audience to segments that have converted before, and exclude those that consistently return low revenue. In Google Ads, review placements and audiences monthly to see which ones bring in paying customers.
Funnel. Research from Portent, cited by Needle, found that a one-second delay can cut conversions by 4.42% per second. Check mobile page load speed first, then the checkout steps, since each extra step loses buyers.
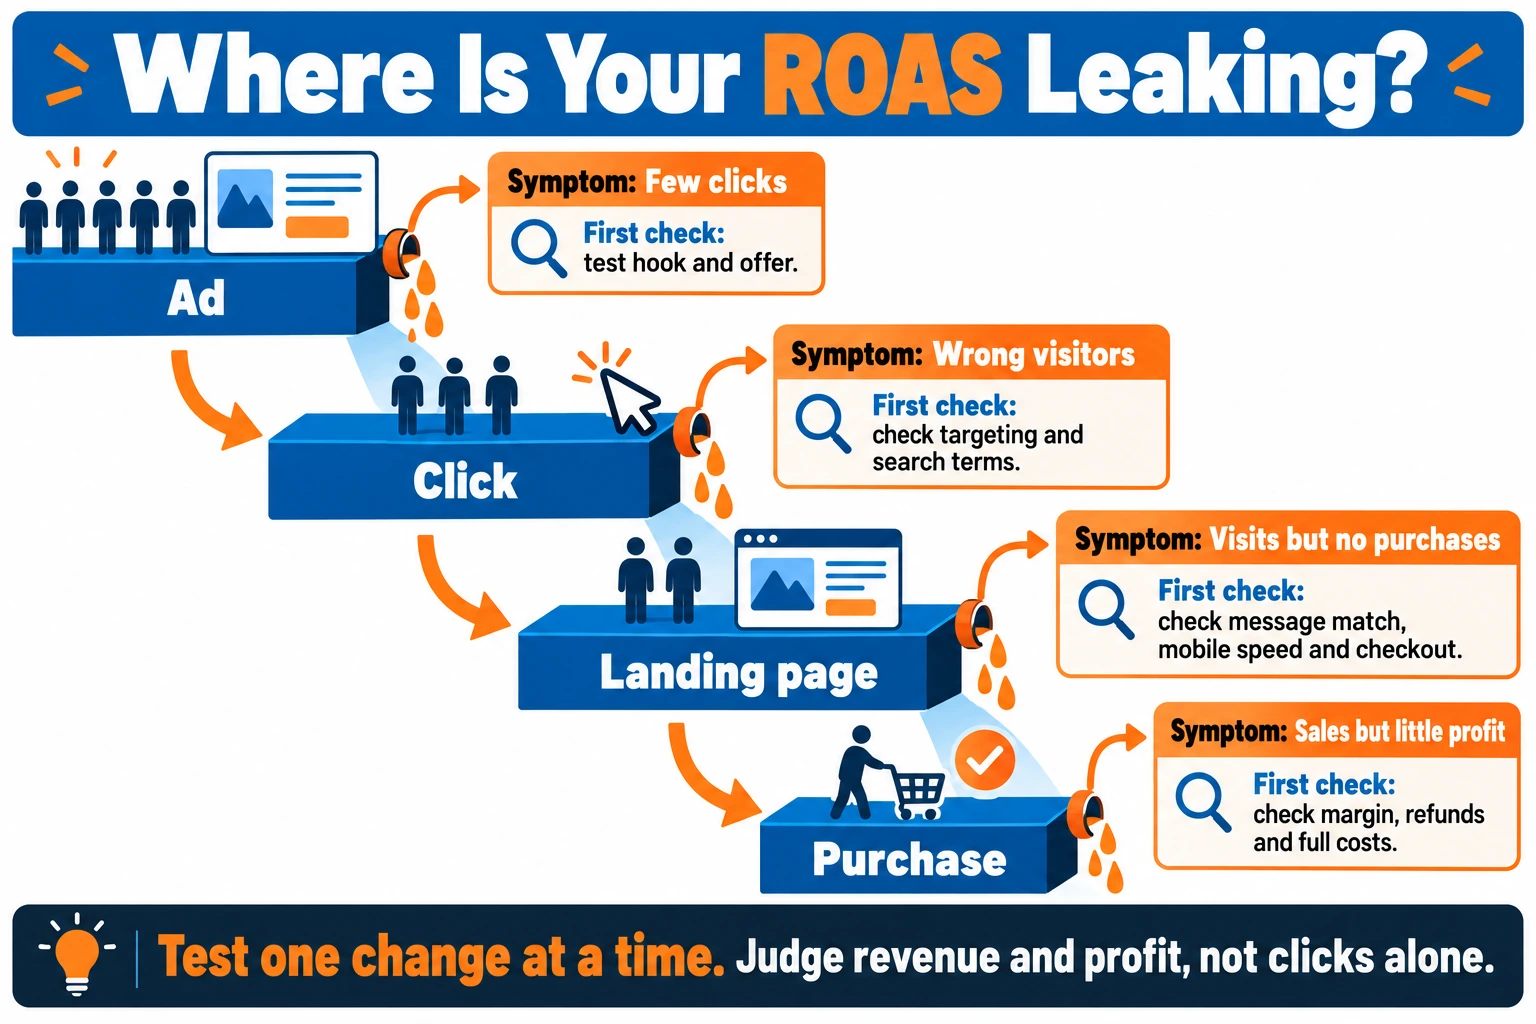
Diagnostic table
| Symptom | Likely cause | First fix |
|---|---|---|
| Low click-through rate | Weak hook or offer | Test a new opening line or offer |
| Clicks but few purchases | Audience or landing page mismatch | Match the ad message to the page |
| Many visits, slow pages | Page load time | Compress images and cut scripts |
| Cost per click rising | Narrow or overlapping audiences | Consolidate and exclude weak segments |
Optimising Google Ads Accounts for ROAS
Set a target ROAS bid from your break-even figure, not a round number that sounds ambitious. Group products or keywords with similar margins into one campaign so a single target fits. Google’s Target ROAS documentation explains how the bid is applied.
Review the account weekly:
- Confirm conversion tracking matches your sales records.
- Check ROAS by campaign, not just the account total.
- Flag any campaign below break-even for two consecutive weeks.
- Pause a campaign that stays below break-even for four consecutive weeks, and scale one that holds at or above your target ROAS for the same period, adjusting the budget in small steps.
- For budget-limited campaigns, decide whether to change the target or the budget, then see how each change affects total revenue and the return on each dollar spent.
Google Shopping Campaigns and ROAS
Shopping performance depends on the product feed. Titles, prices, availability and images decide which searches your products appear for, so clean the feed before adjusting bids. A well-optimised feed improves click and conversion quality, and every click should land on a product page that matches what they searched for.
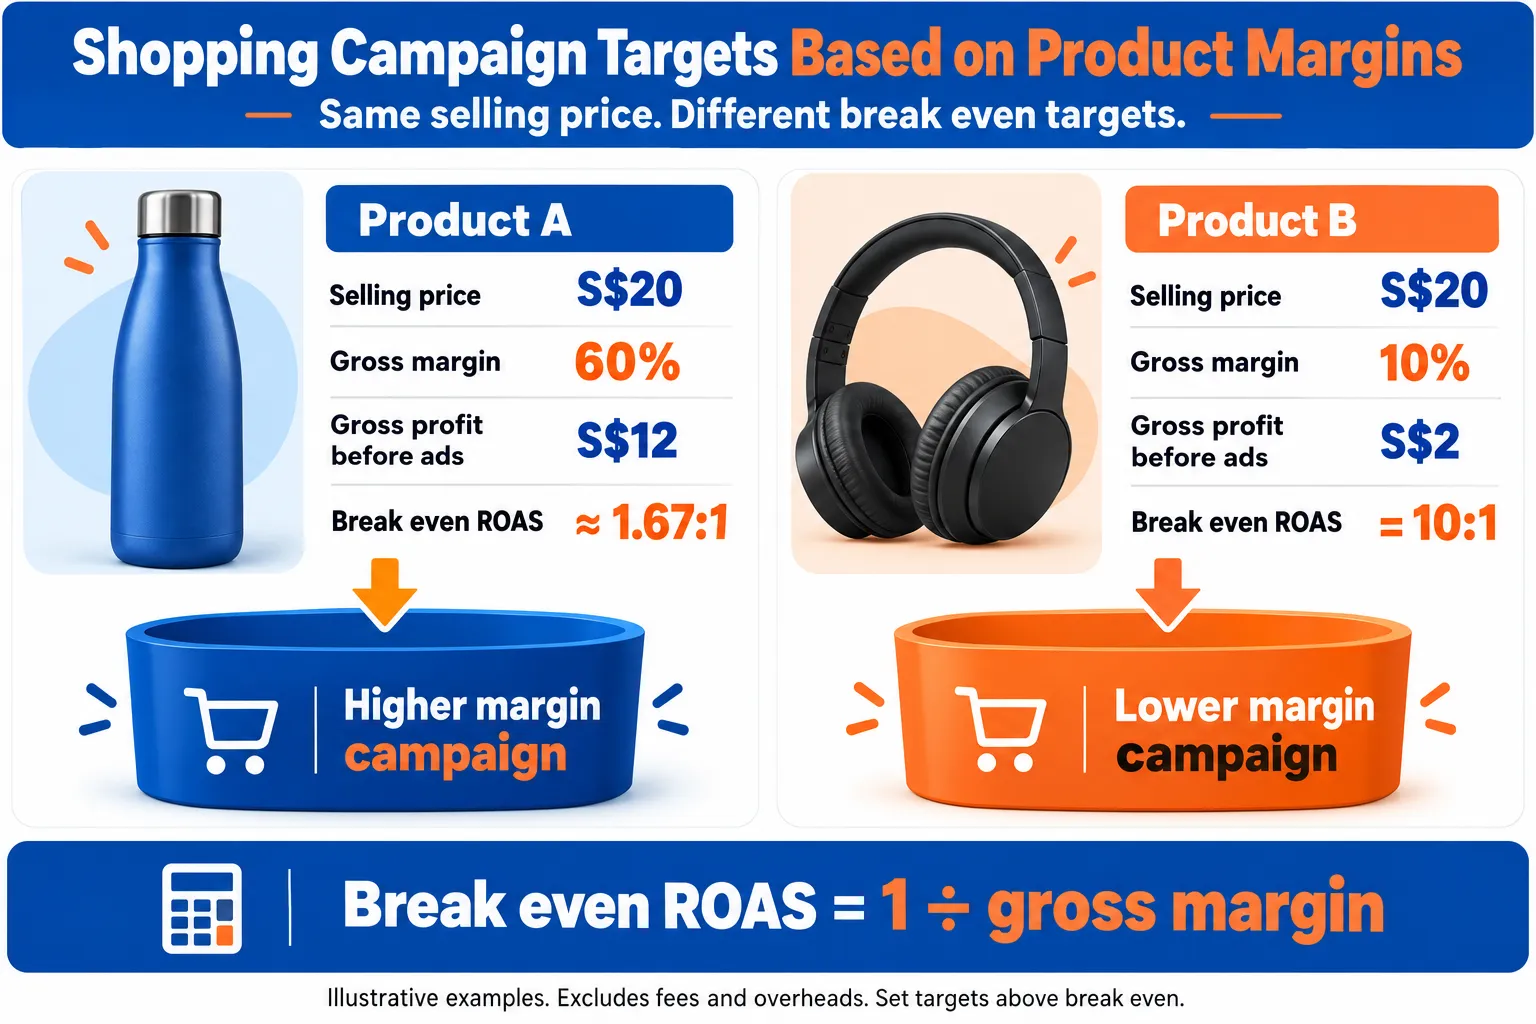
Segment products by margin. Take an S$20 item with a 60% margin and a comparable item with a 10% margin. The 60% item needs a much lower ROAS to break even, while the 10% item needs roughly 10:1 to cover its product cost. Let’s say you run both in the same campaign with one target. The low-margin item will look profitable on the dashboard while quietly losing money, so set separate targets for each margin band.
Negative Keywords Management
Negative keywords stop ads showing for searches that never convert. Review the search terms report weekly and add irrelevant terms that spend without sales. Keep the list in a shared document, and set your threshold based on your cost per acquisition. A useful rule: if a search term has spent more than your target cost per acquisition without a single conversion, add it as a negative keyword.
Google Ads Quality Score
Quality Score is a diagnostic rating from 1 to 10 that Google assigns to each keyword. It is based on expected click-through rate, ad relevance, and landing page experience. Google’s Quality Score help page sets out how each is judged.
- Expected click-through rate. Write ad text that matches the search term. Higher expected CTR lowers cost per click.
- Ad relevance. Keep each ad group tightly themed around one set of keywords.
- Landing page experience. Send visitors to a page that delivers what the ad promises, loads quickly, and works on mobile.
Together, these lower the cost of each click, which lifts ROAS (return on ad spend) without changing your offer. Tracking these metrics over time shows which changes improve performance and which just move the numbers around.
Conclusion and Next Steps
ROAS only becomes useful when read against your margin. Break-even ROAS equals 1 divided by gross margin. A 25% margin needs 4:1 just to cover product cost, before rent, staff or ad fees. Put that way, the dollar figure you pay for each sale tells a clearer picture than the ratio alone, and it drives profitable conversions.
To set a target from your own numbers:
- Work out gross margin per product group.
- Calculate break-even ROAS as 1 ÷ margin.
- Add a buffer for overheads, then set a target above break-even.
- Compare each campaign’s actual ROAS against that target weekly.
- Pause a campaign that stays below break-even for two consecutive review periods, and scale one that holds above target with stable cost per acquisition.
- Review long sales cycles over a longer window before cutting them.
If you run Google Ads or Meta campaigns and are unsure where your break-even sits, MediaOne can review your ROAS setup and show which campaigns make money and which only look good on the dashboard.
Frequently Asked Questions
What is a good ROAS?
There is no universal good ROAS. The right target depends on your gross margin, because a return that is profitable for one business can lose money for another. A SaaS company with a 75% margin can be profitable at 3:1, while a low-margin eCommerce store with a 20% margin needs roughly 5:1 just to cover product costs. First, calculate your break-even point, then set your target above it.
How do I calculate ROAS?
Divide the revenue your ads generated by what you spent. If you spend S$1,000 on Meta ads and they produce S$4,000 in sales, your ROAS is 4:1, or 400%. Deduct refunds and discounts from revenue before dividing.
What is the difference between ROAS and ROI?
ROAS measures the revenue an ad brings in for each S$1 spent. ROI measures the profit left after all costs, including product costs, staff and overheads. A campaign can show a strong ROAS and still deliver a poor ROI if margins are thin.
What is break-even ROAS?
Break-even ROAS is the lowest ratio at which a campaign covers its own costs. Calculate it as 1 ÷ gross margin. With a 25% margin, break-even is 4:1, so a campaign returning S$3 for every S$1 spent loses money on product margin alone.
Why is my ROAS high but my profit low?
ROAS measures revenue against ad spend, so it can hide costs that sit elsewhere. Common causes include low gross margin, refunds, agency fees, and creative production costs left out of ad spend. Compare ROAS with your break-even figure and reconcile platform numbers with your finance records.
How do negative keywords affect ROAS?
Negative keywords stop Google Ads from showing for searches that rarely convert, so you spend on queries that do. Excluding irrelevant terms lowers ad cost without reducing sales from good traffic, which raises ROAS. Review your search terms report regularly and add exclusions for terms that bring clicks but no revenue.