
Both matter. But without an ICP, you end up chasing the wrong people at the wrong companies. A prospect may want your solution, but their company may lack budget, authority, or fit to sustain a long-term relationship.
The Difference Between ICP and Buyer Personas
Personas describe people. ICPs describe organisations. A single ICP can contain multiple buyer personas.
Consider a mid-market SaaS platform selling sales engagement software. Their ICP might be “Series B-C SaaS companies, USD 10–40M annual recurring revenue, 50–250 employees, with distributed sales teams in North America or Europe.”
Within that ICP exist three distinct buyer personas:
- VP of Sales: cares about pipeline predictability and rep productivity metrics; buys based on ROI and team adoption risk
- Sales Development Manager: cares about ease of use, integration with Salesforce, and time-to-first-outreach; worries about learning curve and feature complexity
- Sales Operations Manager: cares about data accuracy, reporting, and API reliability; worries about data governance and compliance
All three work at the same target company (the ICP). Each persona has different pain points, objections, and decision criteria. Your messaging, content, and sales process must address all three to move a deal forward.
Why This Matters Now
A well-defined ICP directly impacts your bottom line. When you align your prospecting, messaging, and sales process to a clearly defined customer type, you reduce wasted effort and accelerate deal velocity.
Consider the alternative: a lead generation agency without an ICP wastes resources chasing poor-fit prospects. Your sales team spends time on accounts that cannot afford you or do not need what you offer. You miss accounts that would actually pay, renew, and refer because noise distracts you.
A sharp ICP solves these issues by filtering out noise. Your sales team stops asking, “Should we pursue this lead?” and starts asking, “Does this lead fit our ICP?” The answer becomes binary, removing guesswork and politics from pipeline decisions.
Core Attributes of an Ideal Customer Profile
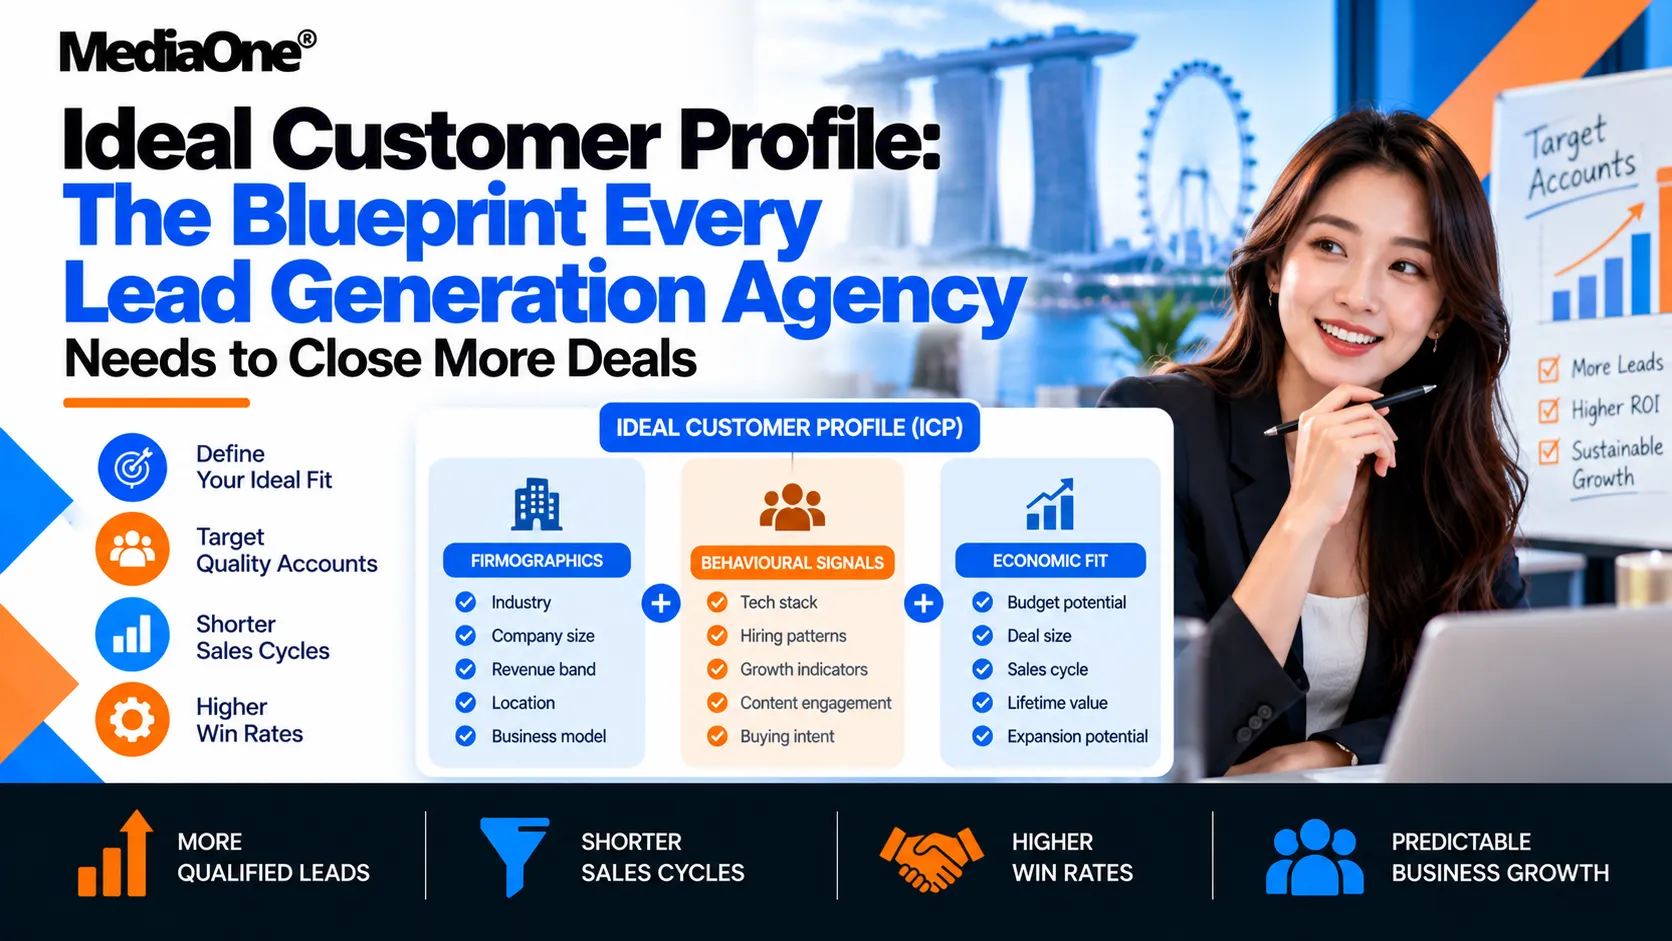
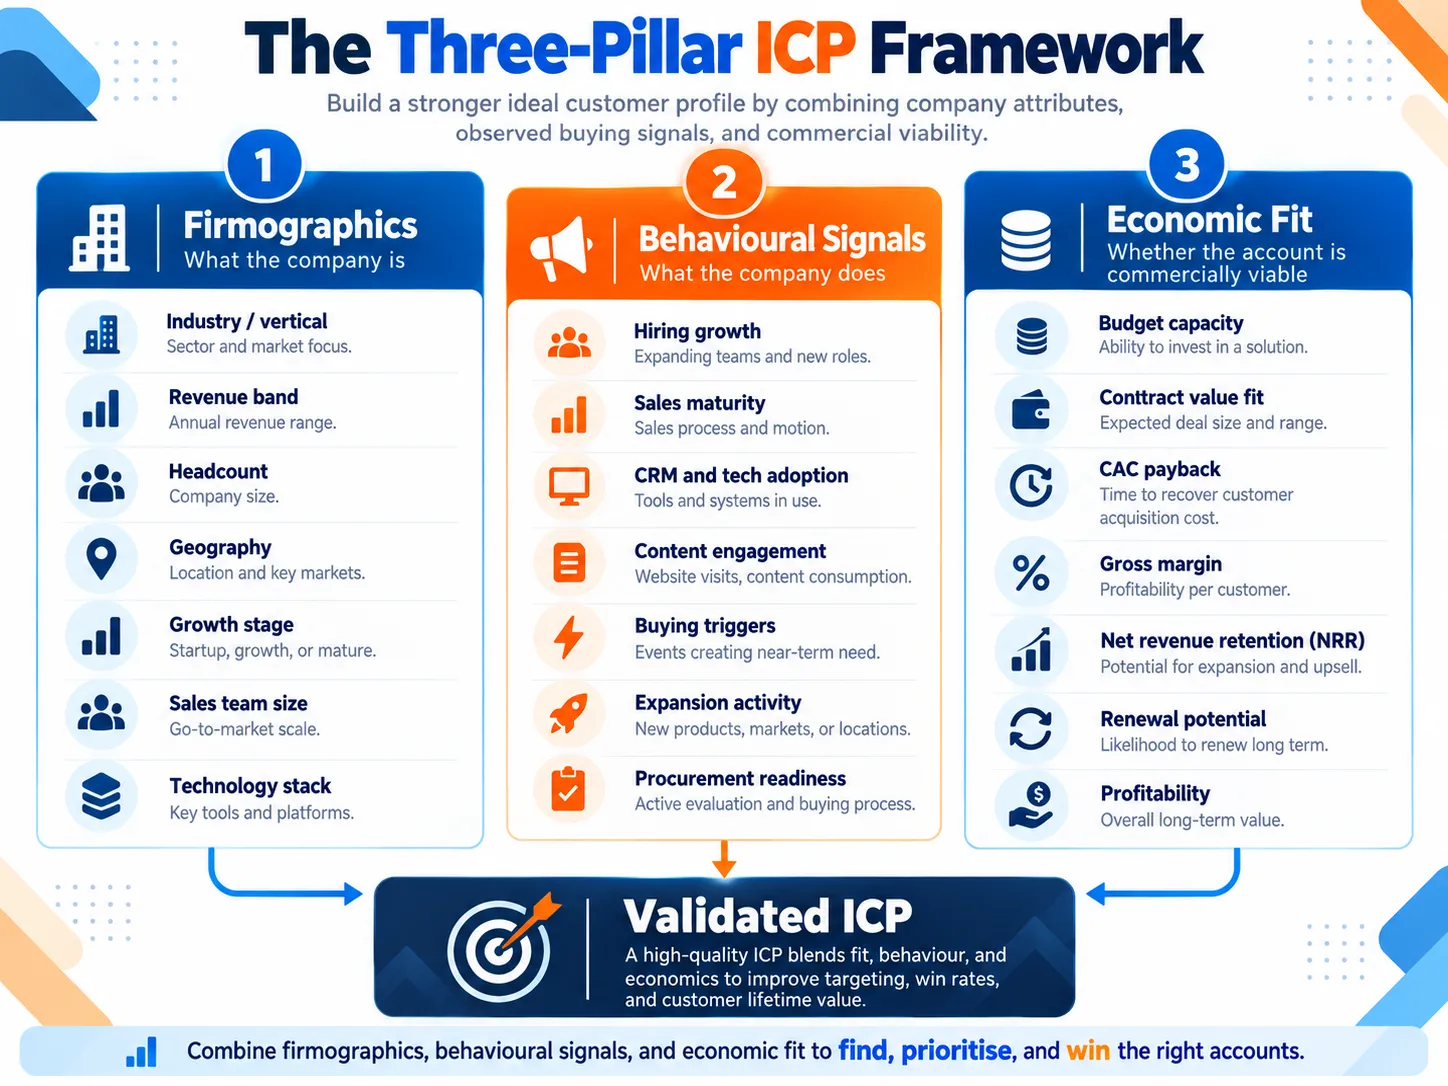
An ICP rests on three pillars: firmographics (what companies are), behavioural signals (what they do), and economic fit (whether they can afford and value your solution).
Company Firmographics
Firmographics are the objective, measurable facts about target companies. Define these first.
Industry or vertical: Which sectors have you won most and retained longest? A lead generation agency might focus on B2B SaaS, professional services, or recruiting. Each vertical has different sales processes, decision-making timelines, and pain points.
Company size (headcount or revenue): Do you serve micro-agencies (under 10 staff) or enterprises (over 500)? There is a threshold below which your service costs more than the prospect saves. A £5,000 per month retainer does not fit a £1M-revenue startup; they cannot afford it. But it is a steal for a £25M company.
Geographic region: Localise for your market. If your lead generation agency operates in Singapore or across Asia-Pacific, you might target Asia-Pacific expansion plays (companies with Asia-Pacific offices building regional teams) or global-ready firms (those with multi-region sales operations).
Revenue and funding stage: Early-stage startups behave differently from profitable small and medium enterprises. A Series B SaaS company with £3M in the bank will spend on growth; a bootstrapped consultancy at £5M revenue will scrutinise ROI rigorously. Both may be good customers, but they require different value propositions and contract structures.
Growth trajectory: Are they scaling fast (cash-rich, willing to invest in new tools) or stabilising (cost-conscious, demanding faster payback)? Growth-stage companies often renew faster and expand dollar volume. Stable companies may have lower customer expansion rates but longer lifetime value.
Behavioural and Operational Signals
The best ICPs are not defined by what companies are, but by what they do.
Sales maturity level: Does the company have a structured sales process, or are founders still closing deals? A lead generation agency assumes your prospect has a functioning sales organisation. If they do not, qualification fails early. Conversely, companies with established sales operations, a dedicated sales ops role, and a CRM are more likely to adopt external lead generation services.
Technology stack: Companies already paying for Salesforce, HubSpot, or LinkedIn Sales Navigator signal sophistication and openness to external solutions. They have committed to sales technology. A company with zero CRM might be too early-stage or too price-sensitive to be ICP-fit.
Hiring spree indicators: Rapid sales team growth signals imminent demand for lead generation. If a company hired five sales representatives last quarter, it’s urgently building a pipeline. This creates a buying trigger.
Content consumption patterns: Do they read industry blogs, attend conferences, subscribe to sales podcasts, or engage in peer networks? This signals openness to external solutions and sophistication. Companies that consume thought leadership are more likely to buy from consultative, insight-led providers.
Budget and procurement process: Do they use open procurement (anyone can expense tools under a certain threshold) or strict gating (chief financial officer approval required)? Companies with streamlined procurement close faster.
Pain Points and Challenges Unique to Your ICP
Move beyond generic “needs more leads” to the specific bottleneck your service solves.
For mid-market SaaS: Sales teams spend 60 per cent of their week on administrative tasks, not prospecting. Lead quality suffers, quota attainment drops, and pipeline misses forecasts.
For professional services: A partner-led business model means individual partners own the pipeline. Consistency varies widely. One partner’s strong network sustains growth; another’s leaves the firm exposed. Scaling becomes a people problem, not a process problem.
For tech recruiting firms: Contract hiring teams lack an inbound pipeline. They are reliant on expensive job boards and slow referrals. Cost-per-placement climbs. Margins compress. Retained roles go unfilled.
Tie each pain point to a measurable consequence: lost revenue, team turnover, missed quota, or margin compression. This specificity makes your ICP recognise itself in your messaging. Generic pain points do not persuade; specific, quantified ones do.
Budget Capacity and Buying Power
Not all target companies can afford your service, even if they’re a fit.
Minimum viable contract value: If you are targeting $5,000 per month retainers, a $2M-revenue startup is too small. Their annual software budget might be $20,000 total. Your service would consume 30% of it. This level of cost absorption is not sustainable. By contrast, a $20M company can absorb a $5,000-per-month line item without flinching.
Who controls the budget: In some ICPs, the VP of Sales owns the demand-generation budget. In others, the VP of Marketing approves. In others, the chief financial officer controls the budget. Understanding who holds the purse accelerates deal closure. If your ICP requires three-level approval (Sales, Finance, Legal), your sales cycle will be longer.
Payback expectation: Enterprise buyers expect 12-month ROI and can wait for results. Growth-stage companies expect results in 60 to 90 days. They are impatient because they are burning cash. A lead generation agency’s ICP should reflect payback expectations. Chasing 60-day ROI deals when your average payback is 6 months creates misalignment and churn.
How to Build Your Ideal Customer Profile: A Six-Step Framework
Building an ICP is not abstract theorising. Start with data from your best customers, validate with your team, define thresholds, and operationalise across the organisation.
Step 1: Audit Your Best Customers
Analyse your top 10–15 retained clients. Open a spreadsheet and map these fields for each:
- Revenue band (e.g., SGD 14M–SGD 67M)
- Headcount
- Industry and vertical
- Use case and how they use your service
- Time-to-first-win (days from first conversation to contract)
- Contract length and renewal rate
- Net Revenue Retention (NRR), or how much existing customers spend extra each year
- How they found you (referral, cold outreach, content, partner, inbound)
- Customer satisfaction score (NPS, CSAT, or renewal likelihood)
You will notice patterns. High-NRR cohorts usually share three or four firmographic traits. Companies from certain industries renew faster. Companies above a certain revenue threshold churn less.

This spreadsheet becomes your truth base. Everything that follows is hypothesis testing against this data.
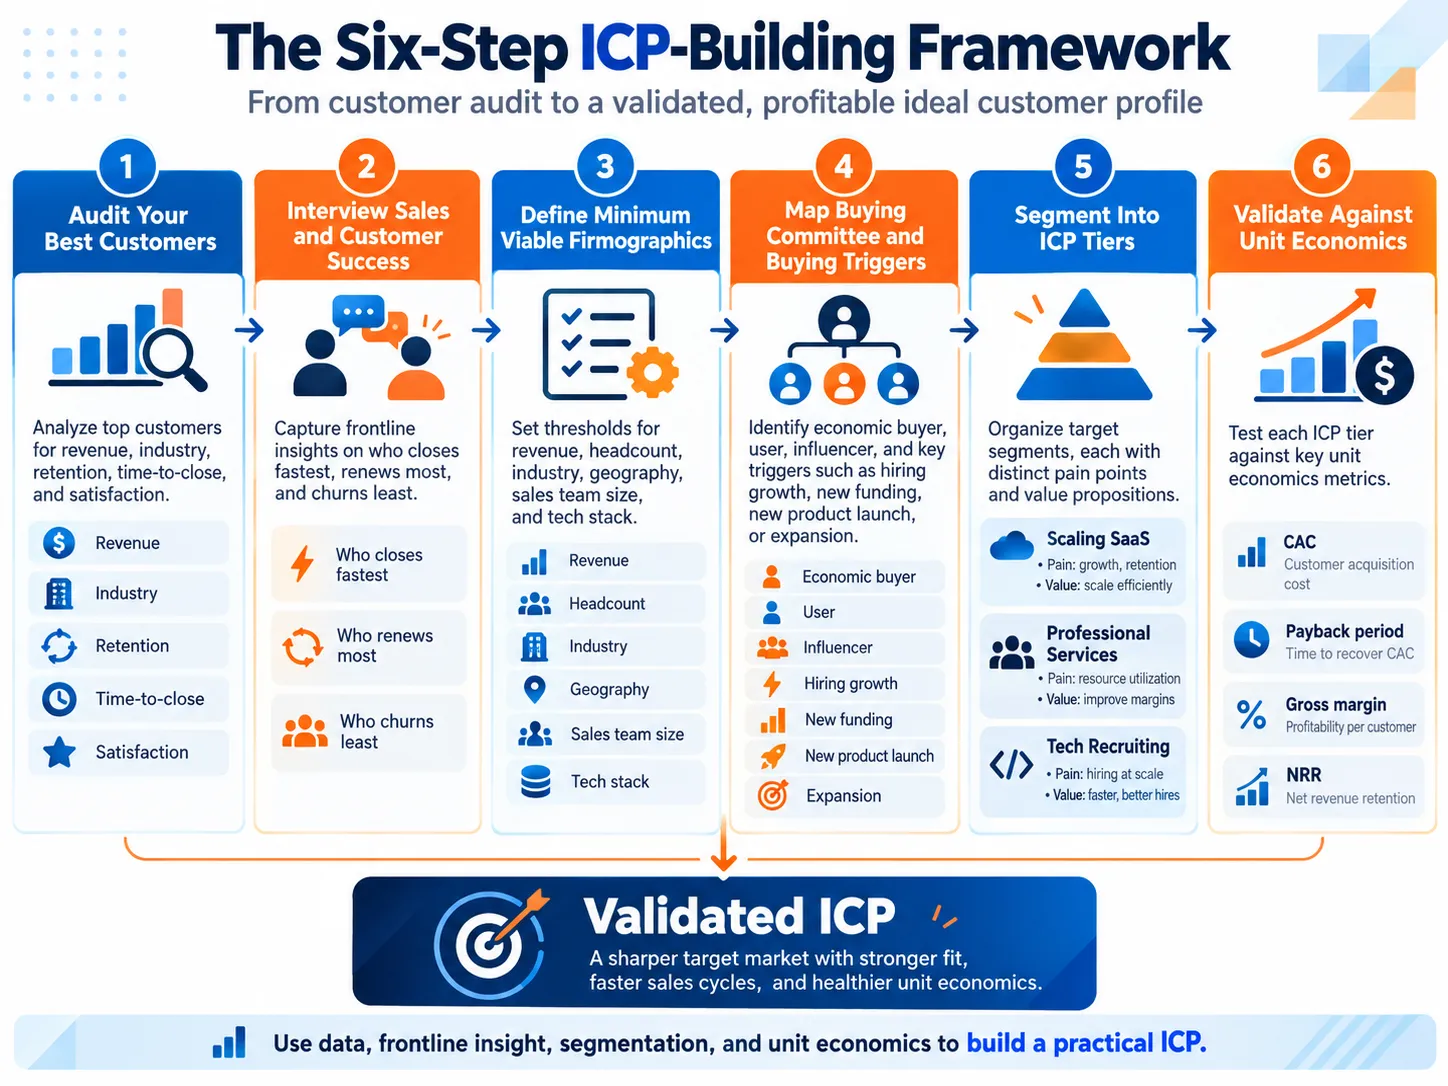
Step 2: Interview Sales and Customer Success Teams
Your team talks to customers and prospects weekly. They have pattern-recognition skills your spreadsheet lacks. Ask them:
- “Who do we close fastest with the least objection?”
- “Which customers rarely ask for discounts?”
- “Which industries or company sizes renew without hesitation?”
- “What is the smallest company we can profitably serve?”
- “What is the largest company that buys from us, and why do they?”
- “When we lose a deal, what was the most common reason?”
- “Which customers churn soonest, and what do they have in common?”
Document these answers in a shared document. You will hear consistent themes: “Mid-market SaaS with distributed sales teams”, or “B2B recruiting firms with private equity backing”, or “insurance brokers in growth mode”. These themes are gold. They are qualitative validations of your spreadsheet patterns.
Step 3: Define Your Minimum Viable Firmographics
Use your audit and team interviews to set a non-negotiable floor. Create a simple table:
| Attribute | Minimum Threshold | Sweet Spot | Stretch (Nice-to-Have) |
|---|---|---|---|
| Annual Revenue | SGD 4M | SGD 20M–SGD 107M | SGD 134M+ |
| Headcount | 50 | 100–400 | 400+ |
| Industry | B2B services or SaaS | SaaS, Professional Services, Recruiting | Fintech, InsurTech |
| Geography | APAC-based | APAC with US/EU plans | Global, multi-region |
| Sales Team Size | 5+ | 15–50 | 50+ |
| Tech Stack | Basic CRM | Salesforce + HubSpot + Navigator | Enterprise stack |
| Growth Stage | Established (3+ years) | Scaling (15%+ year-on-year) | Hyper-growth (50%+ year-on-year) |
This table helps your sales team filter inbound and outbound lists in seconds. If a prospect falls below the minimum, the unit economics do not work. This discipline prevents individual deals from distorting your strategy.
Step 4: Map Buying Committee and Buying Triggers
Identify who signs the contract and what event makes them buy now.
Buying committee:
- Economic buyer: Controls the budget, cares about return on investment and alignment with company strategy. Often Chief Financial Officer, VP of Finance, or (in mid-market) VP of Sales. Can kill a deal if unconvinced of ROI.
- User: Uses the service daily, cares about ease of use, integration, and outcomes. Often Sales Director, Head of Sales Development, or VP of Sales. Kills the deal if the solution does not solve their operational problem.
- Influencer: Evaluates tools, shapes perception, and may not decide alone. Often a marketing manager, sales operations, or enablement lead. Influences but does not control.
Buying triggers (events that create urgency):
- Sales team growing more than 20% year-on-year (need systems to scale)
- New product launch (demand generation needed)
- Q1 sales kickoff or annual planning cycle (budgeting window open)
- Loss of a major customer or referral channel (urgent pipeline need)
- New venture capital funding or acquisition (mandate to scale revenue)
- Competitor attack or market shift (urgency to defend or expand)
Your sales team should track these triggers and prioritise prospects that match them. A “perfect fit” company (right size, industry, pain) without a trigger may not buy for 12 months. A slightly smaller company with a trigger (e.g. just received funding, sales team doubled) may buy within 60 days.
Step 5: Segment Into ICP Tiers
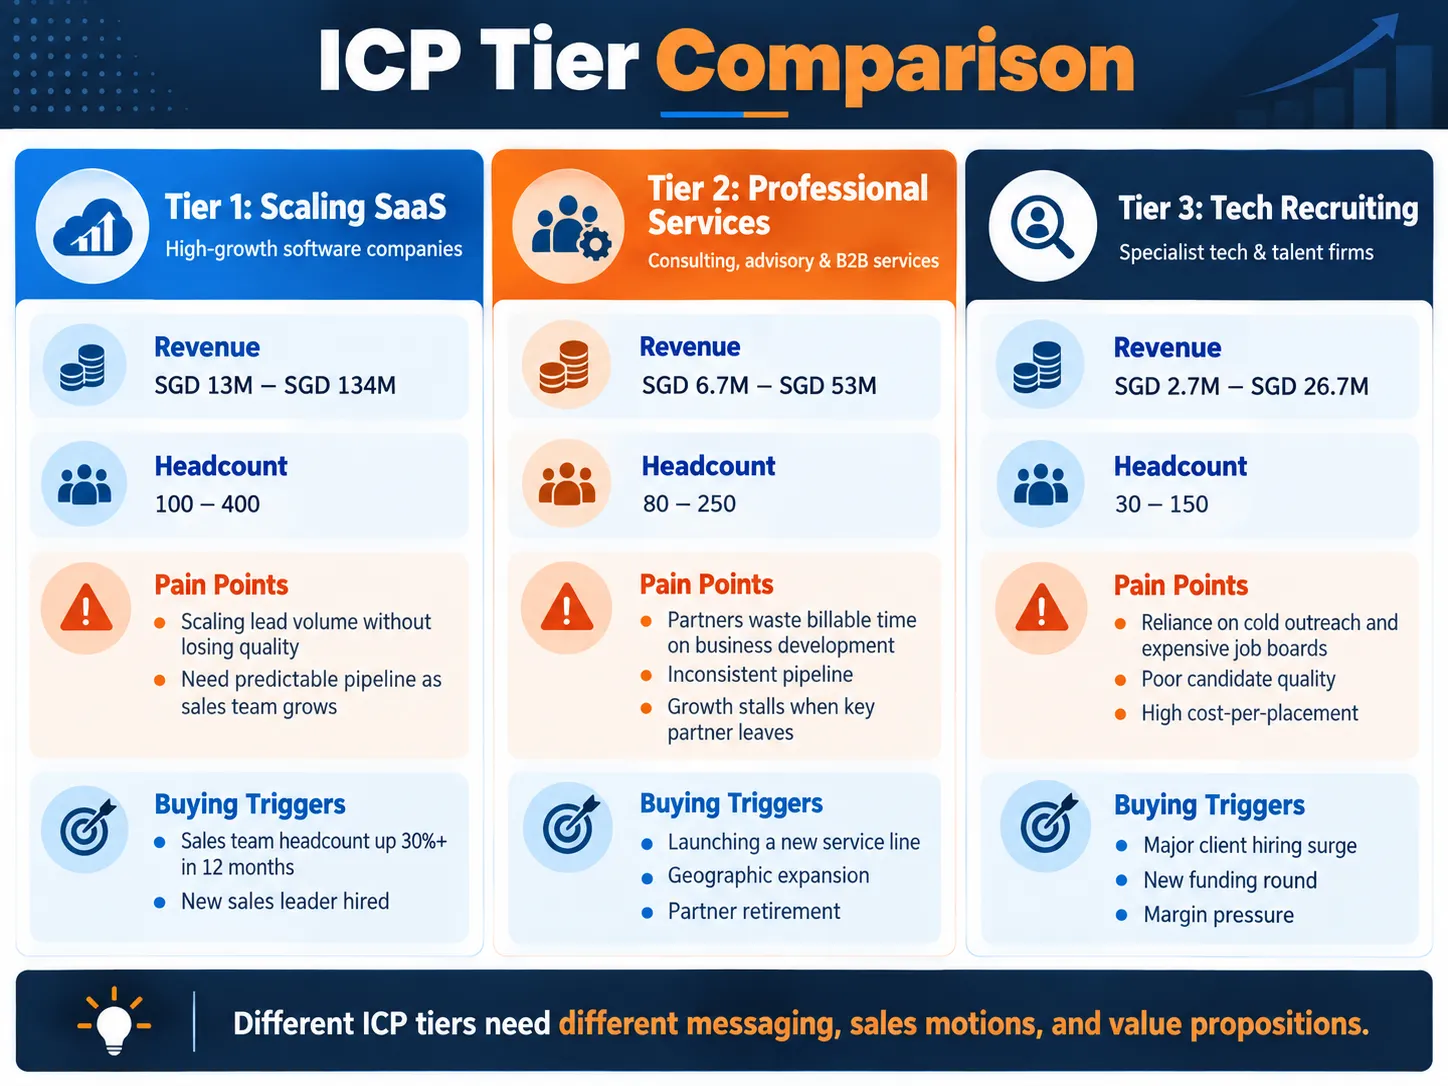
Most lead generation agencies serve multiple distinct markets. Rather than force one ICP, segment into 2–4 primary profiles. This lets you tailor messaging, pricing, and your sales approach for each segment.
ICP Tier 1: Scaling SaaS
- Revenue: SGD 13M–SGD 134M
- Sales stage: Series B–D, scaling sales team fast
- Headcount: 100–400
- Pain: Scaling lead volume without losing quality; need a predictable pipeline as the team grows
- Buying trigger: Sales team headcount up 30%+ in 12 months; new sales leader hired
- Contract value: SGD 8,000–SGD 20,000 per month
- Typical NRR: 115%+
- Payback expectation: 4–6 months
ICP Tier 2: Professional Services (Law, Consulting, Accounting)
- Revenue: SGD 6.7M–SGD 53M
- Sales stage: Profitable, established, growing via new practice areas
- Headcount: 80–250
- Pain: Partners waste billable time on business development; inconsistent pipeline; growth stalls when key partner leaves
- Buying trigger: Launching a new service line, geographic expansion, partner retirement
- Contract value: SGD 4,000–SGD 10,700 per month
- Typical NRR: 105%+
- Payback expectation: 6–9 months
ICP Tier 3: Tech Recruiting (Contingent)
- Revenue: SGD 2.7M–SGD 26.7M
- Sales stage: Early to mid-growth, venture capital-backed or bootstrapped
- Headcount: 30–150
- Pain: Reliance on cold outreach and expensive job boards; poor candidate quality; high cost-per-placement
- Buying trigger: Major hiring surge for clients; new funding round; margin pressure
- Contract value: SGD 5,300–SGD 16,000 per month
- Typical NRR: 100–110%
- Payback expectation: 90–120 days
For each ICP, create separate messaging, outbound campaigns, and account lists. Your sales team closes faster with focused positioning. Recruiting firm buyers ignore your SaaS case studies; SaaS customers cannot relate to recruiting pain points.
Step 6: Validate Against Unit Economics
Before finalising your ICP, run the maths:
Customer Acquisition Cost (CAC): How much do you spend to land one customer in this segment?
Payback period: How many months until that customer’s revenue covers their CAC? Aim for 12 months or less.
Gross margin: After delivery costs, what percentage of their contract value is profit?
Net Revenue Retention (NRR): Do customers in this ICP expand, renew, or churn? If NRR is below 90%, the profile may not be sustainable.
If an ICP scores well on firmographics but poorly on unit economics, revisit. Your ICP must be profitable by definition.
Create a simple validation table:
| ICP Tier | CAC (SGD) | Payback Period (Months) | Gross Margin (%) | NRR (%) | Unit Economics Status |
|---|---|---|---|---|---|
| Scaling SaaS | 12,000 | 8 | 75 | 115 | Strong |
| Professional Services | 8,000 | 10 | 70 | 105 | Strong |
| Tech Recruiting | 5,000 | 3 | 65 | 105 | Acceptable |
This table forces rigour. An ICP that looks attractive on paper but fails unit economics testing should be refined or abandoned. Profitability is non-negotiable.
Using Your ICP to Drive Lead Generation and Prospecting
Defining your ICP is half the battle. The other half is operationalising it so it drives daily behaviour.
Align Your Prospect List to Your ICP
Use B2B data platforms to filter prospect lists by your ICP:
- Revenue band: SGD 20M–SGD 107M
- Headcount: 100–400
- Industry: SaaS (flagged by industry classification or venture capital funding)
- Hiring signals: Sales headcount growth in the past 6 months
- Geography: APAC with headcount in the United Kingdom, the United States, or Europe
Platforms such as ZoomInfo, Apollo, and Clearbit all support these filters. The goal is to build a list where 70%+ are ICP matches.
Tag prospects in your CRM as “ICP Match”, “Near-ICP”, or “Off-ICP”. This labelling serves two purposes: (1) It trains your sales team on what fit looks like. (2) It lets you measure conversion funnel metrics by ICP match status. After 90 days, you will see that ICP Match prospects convert at 2–3x the rate of Off-ICP ones.
Tailor Messaging by ICP
Each ICP reads different content and responds to different value propositions. Generic messaging fails because it does not speak to specific pain.
- SaaS: “Close larger deals faster with a predictable, qualified pipeline. Scale your sales team with confidence.”
- Professional Services: “Stop leaving partner billable hours on the table. We build the pipeline; your team closes it.”
- Recruiting: “Cut cost-per-placement by 40% with active inbound candidate flow. Reduce your reliance on job boards.”
These are not slight variations. They are fundamentally different value stories. A SaaS buyer cares about predictability and scalability. A recruiting firm cares about cost-per-placement and time-to-fill. Your messaging must reflect these differences.


Measure ICP Fit in Your Sales Funnel
Track these metrics weekly by ICP segment:
Win rate by ICP: Which profile closes the highest? Invest there.
Deal velocity: How long from first touch to contract, per ICP? SaaS might close in 60 days; professional services in 120 days. If one ICP is lagging, diagnose why: is it a sales execution issue or a market issue?
Customer acquisition cost payback: How many months until an ICP customer pays for their acquisition cost? CAC is your monthly cost to close a customer divided by your average customer contract value. Payback is CAC divided by the monthly gross margin. Aim for 12 months or less. If professional services has an 18-month payback, it might be worth less investment than SaaS at 10 months.
NRR by ICP: Do certain profiles renew and expand more? Why? If SaaS has 115% NRR but recruiting has 100%, ask your customer success team: What do SaaS customers ask for in renewal conversations? How do they expand? Apply those insights to recruiting accounts.
Companies that track these metrics by ICP outpace those that do not by 3–5x in revenue growth rate.
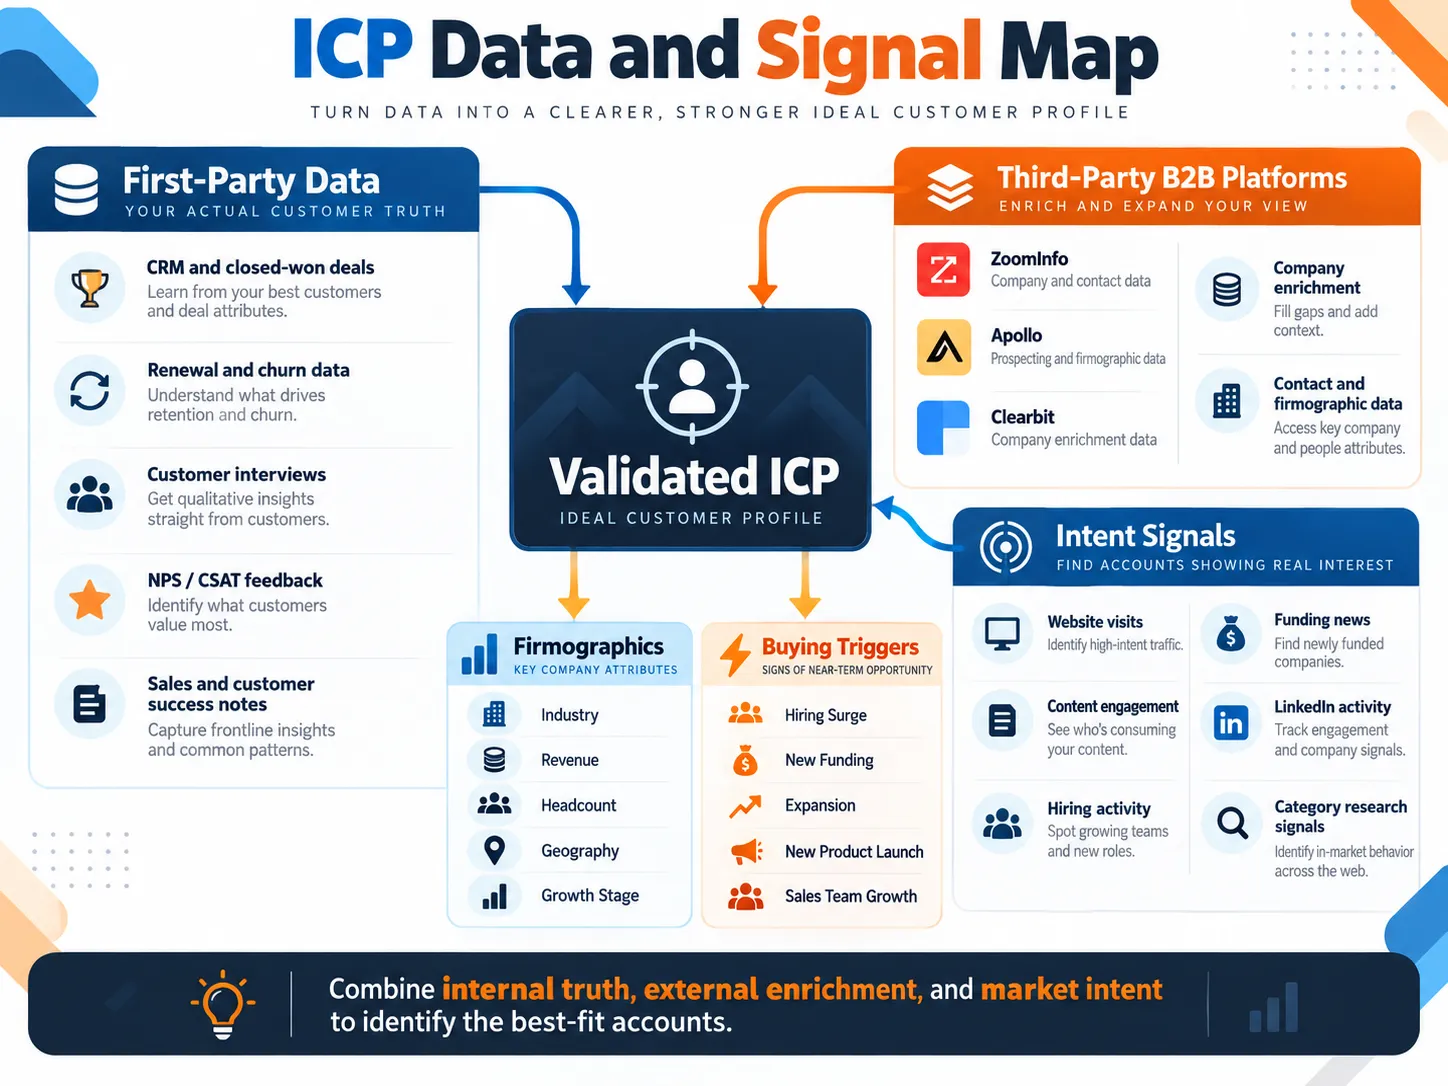
Tools and Data Sources for Building and Validating Your ICP
First-Party Data (Your Own)
Your CRM is the source of truth. Analyse won versus lost deals, renewal rates, expansion revenue, and churn reasons. Export your customer list and pivot by industry, revenue, and headcount to spot patterns.
Customer interviews reveal why customers bought. Record discovery calls and capture key decision factors. Post-implementation, ask: “What would have prevented you from buying?” Churn interviews are equally valuable. Detractors often reveal they were never a good fit in the first place.
NPS surveys uncover insights from your most satisfied and dissatisfied customers. Detractors’ feedback often contains revealing detail: “Your service is perfect for SaaS but not for our recruiting business.” These comments signal which verticals and use cases your solution genuinely serves.
Third-Party B2B Data Platforms
ZoomInfo provides comprehensive company and contact data, including hiring and funding signals. Use it to filter prospect lists and enrich inbound leads with verified company intelligence.
Apollo offers real-time company data, buying signals, and intent tracking at scale. It flags companies visiting your website and tracks mentions of your competitors in news and social media.
Clearbit enriches inbound leads with company insights in real time. When a prospect completes your form, Clearbit automatically appends their company’s industry, funding stage, headcount, and hiring activity.
Intent and Behavioural Data
LinkedIn Sales Navigator enables you to identify people engaging with relevant content, announcing hiring plans, or posting growth updates. Filter for your target industries and job titles. A sales director at a Series B SaaS company who engaged with three lead generation articles in the past month is a warm prospect.

Website tracking platforms (Demandbase, 6sense) show which companies visit your site, how long they stay, and which pages they view. If a company with £20M revenue visits your pricing page three times in one week, they are likely in active evaluation.
Industry reports from IDC, Forrester, and Gartner segment markets by company size and industry. Use these benchmarks to validate your firmographic assumptions and sense-check your ICP thresholds.
Communicating Your ICP Across Your Organisation
An ICP locked in a document serves no one. It must inform daily decisions and shape behaviour across every function.
Sales and Business Development
Print your ICP and display it in the sales area. During weekly pipeline reviews, please flag “off-ICP” deals and ask the team: What is the reason for pursuing this? Sometimes the answer is sound (warm referral from the founder’s network). Often, you are being reactive and losing focus.
Tie compensation incentives to ICP fit. Offer higher commission for ICP deals than off-ICP ones. If you pay 10% commission on ICP deals but 5% on off-ICP deals, behaviour changes quickly.
Create a one-page ICP card for each profile. Include firmographics, pain points, buying triggers, typical contract value, and expected sales cycle length. Sales representatives carry this on their phones or keep it at their desks for daily reference.
Marketing
Use ICP attributes to segment your email list and design account-based marketing campaigns. Create separate content for each ICP profile. A webinar titled “SaaS Scale: Building Sales Pipeline for Series B Teams” speaks directly to ICP 1, while “Practice Growth: Scaling Partner-Led Business Development” targets ICP 2.
Align paid media to ICP keywords and firmographics. LinkedIn ads can target by company size, industry, and job title. Google search ads can bid higher on “lead generation for SaaS” than “lead generation for nonprofits”.
Customer Success and Product
When onboarding a new customer, confirm ICP alignment. If they fall outside your profile, flag it: they may churn sooner, so adjust success processes accordingly. Assign them a dedicated success manager and schedule biweekly check-ins. Off-ICP customers require heightened attention to prevent churn.
Use ICP feedback to prioritise product development. Features that Tier 1 ICP users request often deliver higher ROI than nice-to-haves for off-ICP customers. If your primary ICP (SaaS) all ask for Salesforce integration while your secondary ICP (recruiting) does not mention it, prioritise building Salesforce integration first.
Executive Leadership
Use ICP segmentation to forecast revenue and allocate headcount by segment. If 70% of your close-rate improvement came from ICP 1, staffing decisions should reflect that concentration. Hire resources strategically to serve your highest-revenue, fastest-closing profiles.
Real-World ICP Example: A Lead Generation Agency Case Study
Company: Acme Demand Gen (illustrative example)
Founded: 2019, London-based, 35 staff (2024)
Challenge: Growing from £2.5M annual recurring revenue to £5M, but sales cycles had lengthened to 4–5 months, and win rate had declined from 60% to 35%. Leadership suspected that poor-fit prospecting was diluting results.
ICP Audit Process:
The team reviewed 25 customers signed in 2023, segmented by net revenue retention (how much existing customers spend extra each year), renewal rate, and upsell revenue. The top cohort (12 customers) showed a clear pattern: £15M average revenue, 150 staff, B2B SaaS, Series B–C funded. Net revenue retention: 115%, 100% renewal rate.
The weakest cohort (8 customers): £3M average revenue, 30 staff, mixed industries. Net revenue retention is 85%, with a 62% renewal rate. Sales cycle averaged 5 months.
ICP Definition:
- Tier 1 (Primary): B2B SaaS, £10M–£80M revenue, 100–400 staff, Series A–D funded, US or APAC presence. Sales team: 15–50.
- Tier 2 (Secondary): Professional services (legal, management consulting), £8M–£50M revenue, established (5+ years), profitable, growth driven by new practice areas.
Actions Taken:
Acme filtered their prospect list: 65% now mapped to Tier 1, 25% to Tier 2, 10% off-ICP (strategic partnerships, founder exceptions). They rewrote website copy to remove “we serve all B2B companies” and added specific case studies from SaaS and consulting firms. They restructured email campaigns with separate nurture tracks for SaaS versus services. Sales compensation was adjusted: Tier 1 deals earned 25% higher commission than Tier 2; off-ICP deals earned no bonus.
Results (6 months post-implementation):
- Win rate: 35% to 51% (46% improvement)
- Sales cycle: 4.5 months to 2.8 months (38% compression)
- Net revenue retention across new cohort: 112% (up from 95%)
- Annual recurring revenue: On track to exceed £5M in Q3 (versus original forecast of Q4)
The lesson is direct: an ICP is not theoretical. It measurably impacts sales velocity and unit economics.
Common ICP Mistakes and How to Avoid Them
| Common ICP Mistake | Why It Happens | How To Avoid It |
|---|---|---|
| ICP too broad | Pressure to capture all addressable market; fear of missing revenue | Define a tight segment and own 80% of it rather than 5% of everything |
| Defined once, never revisited | ICP feels “done”; no process for quarterly review | Establish a quarterly review cadence; reallocate resources when new cohorts show stronger unit economics |
| Divorced from unit economics | Impressiveness of the “enterprise” label overrides maths | Run CAC, payback period, gross margin, and NRR before finalising; refine until profitable |
| Ignoring negative signals | Confirmation bias; focus on “perfect fit” traits only | Define anti-patterns explicitly: cost-reduction mode companies, teams without Sales Operations, etc. |
| Sales team not trained on ICP | ICP stays in marketing; sales still chase any lead | Tag all prospects as ICP Match, Near-ICP, or Off-ICP in CRM; train team on filters; measure conversion by tag |
| No measurement or accountability | ICP lacks an enforcement mechanism; treated as aspiration | Track win rate, deal velocity, CAC payback, and NRR by ICP weekly; publish results to leadership quarterly |
| Buying committee composition not mapped | Uncertainty about who influences or blocks decisions | Interview three customers in your ICP. Ask: “Who had to approve this decision?” Typical answer: VP of Sales, IT Director, CFO. Document their goals. |
Reviewing and Updating Your ICP
Do not treat your ICP as static. Markets shift; customer preferences evolve. Your best customers five years ago may not be your best customers today. A stale ICP wastes effort chasing yesterday’s market.
Review your ICP quarterly. When new customer cohorts close faster, renew at higher rates, or show stronger unit economics than your existing ICP, revise your profile and reallocate resources. A lead generation agency’s ICP should evolve as the market matures.
Before finalising any updates, run the numbers again: CAC, payback period, gross margin, and NRR. Your revised ICP must remain profitable.
Summary
An ideal customer profile is your north star for growth. It answers the critical question: Which companies should we pursue, and why?
Core principles:
- ICP focuses on the organisation. Personas focus on people. Both are essential.
- Define personas using firmographics, behaviour, and economic fit. Company size and industry matter, but so do technology stack, sales maturity, and pain-point alignment.
- Operationalise across the organisation. An ICP document is useless unless sales filters it, marketing messages are based on it, and leadership forecasts against it.
- Measure and refine regularly. Track win rate, deal velocity, CAC payback, and net revenue retention by ICP. When patterns shift, update your profile.
- Avoid common pitfalls. Do not define ICP too broadly. Do not create it and then ignore it. Do not ignore unit economics.
For a lead generation agency or any B2B services firm, research suggests a well-defined ICP correlates with:
- Measurable improvement in win rates
- Significant reduction in sales cycle duration
- Sustained lift in net revenue retention and renewal rates
- Reduced wasted prospecting effort and faster time-to-revenue
The best time to define your ICP was when you closed your first customer. The second-best time is today.
Frequently Asked Questions About Ideal Customer Profiles
What is the difference between an ideal customer profile and a buyer persona?
An ideal customer profile describes the organisation you want to serve, including its industry, revenue, headcount, growth stage and operational characteristics. A buyer persona describes the individual you need to influence, including their role, priorities, objections and success metrics. One ICP can contain several buyer personas.
How do I build an ideal customer profile?
Start by auditing your best retained customers, then interview sales and customer success teams to identify recurring patterns. Define minimum firmographic thresholds, map the buying committee and buying triggers, segment the strongest profiles into tiers, and validate each tier against customer acquisition cost, payback period, gross margin and net revenue retention.
What attributes should an ideal customer profile include?
A useful ICP combines company firmographics, behavioural and operational signals, pain-point alignment and economic fit. Typical attributes include industry, revenue, headcount, geography, growth stage, sales maturity, technology stack, hiring signals, buying triggers, procurement complexity and the budget capacity to support your solution.
Can I have more than one ideal customer profile?
Yes. The article recommends segmenting into a small number of distinct profiles when different markets have meaningfully different firmographics, pain points, buying triggers or sales approaches. The goal is focus: each ICP should be distinct enough to justify its own targeting, messaging and measurement.
How often should I update my ideal customer profile?
Review it quarterly. If a new customer cohort closes faster, renews at higher rates or produces stronger unit economics, revise the profile. Likewise, refine or sunset a segment when its performance deteriorates. The ICP should evolve as the market and your business model change.
How do I use my ICP to improve lead generation and outbound prospecting?
Filter prospect lists against the ICP, tag accounts in the CRM as ICP Match, Near-ICP or Off-ICP, and create separate campaigns for each profile. Tailor pain points, value propositions and calls to action by segment, then compare response rates, meeting rates, win rates and deal velocity to decide where to invest more.
How do I know if my ICP is working?
Measure win rate, deal velocity, customer acquisition cost payback and net revenue retention by ICP segment. A useful ICP should help the team identify customer groups that close more efficiently, remain profitable to serve, renew reliably and justify continued investment.
What is the relationship between ICP and account-based marketing?
Account-based marketing uses the ICP as its foundation. The ICP defines which organisations are worth targeting; ABM then identifies matching accounts, maps the buying committee and coordinates more personalised campaigns around those accounts or account clusters. Without a clear ICP, ABM becomes less focused and more expensive.