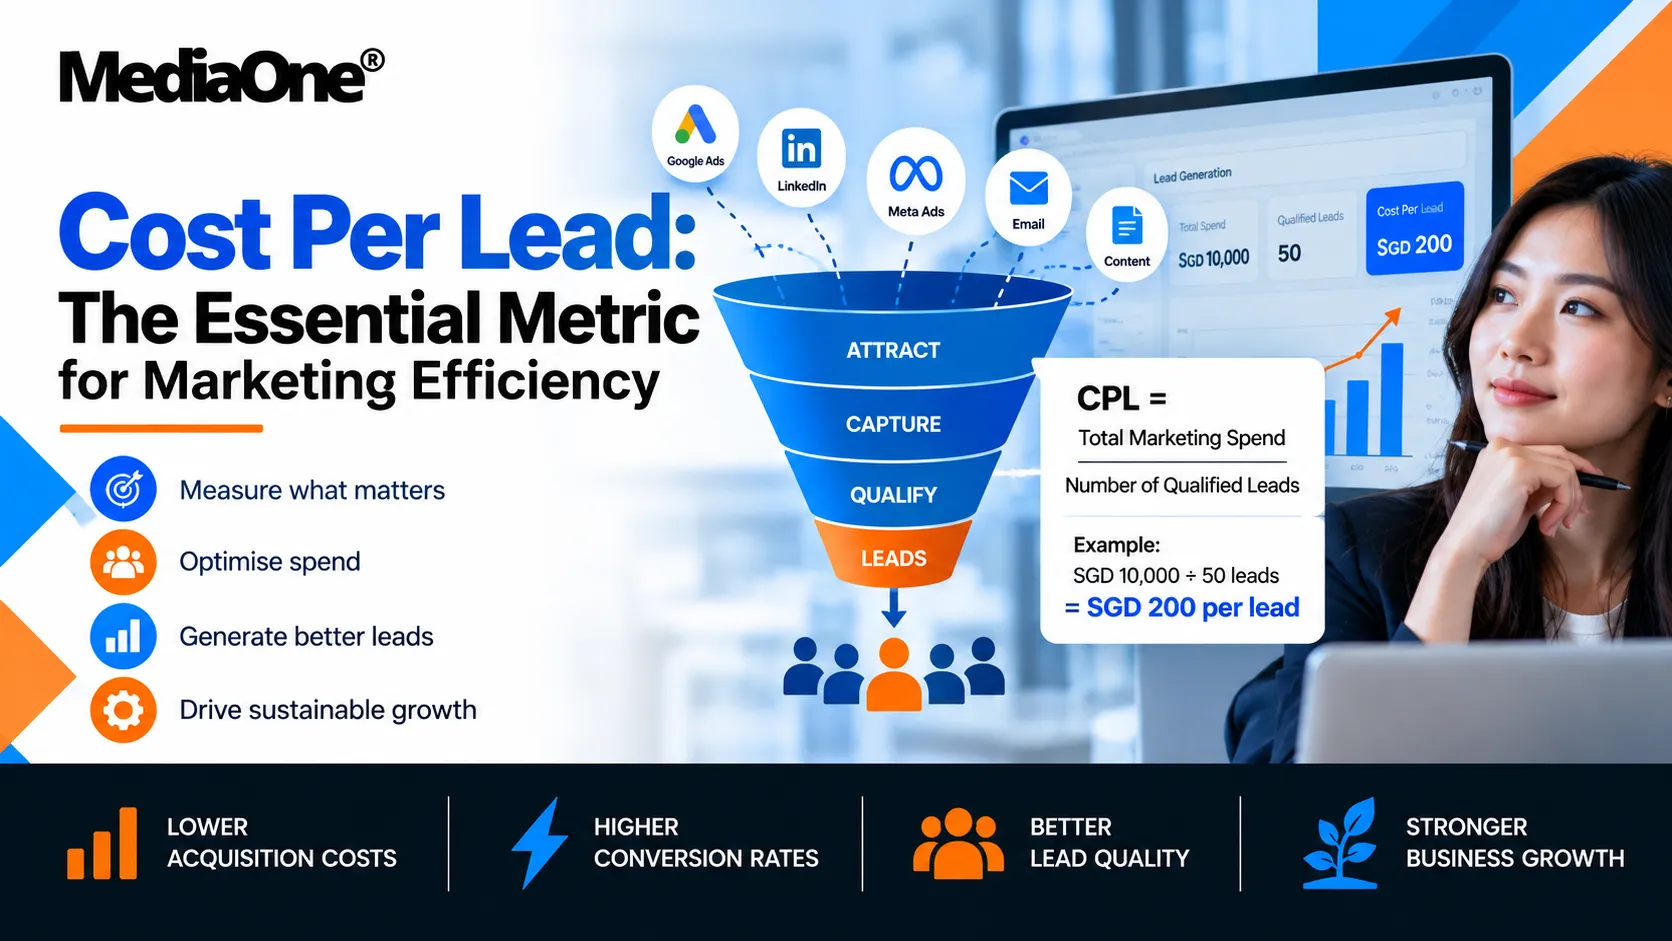
Cost per lead (CPL) is how much you spend on marketing to acquire one qualified prospect. You calculate it by dividing your total marketing spend by the number of leads generated. For any team responsible for driving the pipeline, CPL is the first signal that your campaigns are working.

Unlike metrics that track clicks or impressions, CPL tells you whether your money is moving people closer to a sale. It’s particularly valuable in B2B marketing, lead generation, and longer sales cycles where you can’t immediately measure customers acquired. In Singapore’s competitive digital market, where every marketing dollar counts, understanding and optimising CPL can often make the difference between sustainable growth and wasted spend.
Key Takeaways
- CPL definition: Total marketing spend divided by qualified leads acquired. It measures top-of-funnel efficiency, not customer profitability.
- CPL varies dramatically by channel and industry: Paid search typically costs SGD 50-200 per lead; content marketing, SGD 20-80 at scale; LinkedIn ads, SGD 150-400; outbound sales, SGD 300-1,000+. Your benchmark depends on your context.
- “Good” CPL is relative to LTV: a CPL is sustainable only if it’s no more than 5-10% of your average customer lifetime value. If your customer is worth SGD 5,000, aim for CPL under SGD 500.
- The calculation is simple; the pitfalls are real: Most teams miscalculate CPL by including unqualified leads, forgetting platform fees, or not aligning spend dates with lead dates. Start with a clear definition of “qualified”.
- Small landing page improvements compound massively: Improving the conversion rate from 5% to 8% (a 60% gain) drops your effective CPL 37.5% at the same ad spend. This usually matters more than budget cuts.
- CPL hides lead quality decay: A 20% CPL improvement that coincides with flat or falling revenue usually means you’re acquiring cheaper leads that don’t convert downstream. Always cross-check CPL against closed revenue.
- Track CPL monthly, benchmark quarterly, and act weekly: Calculate CPL by channel every month, compare to industry benchmarks quarterly, and reallocate budget within days if a channel drifts more than 15% above target.
What Is Cost Per Lead (CPL) and Why It Matters
The CPL Definition and Core Formula
CPL is calculated by dividing your total marketing spend by the number of qualified leads you acquired during that period.
Formula: Total Marketing Spend / Number of Qualified Leads = CPL
Here’s a practical example. Suppose you run a Google Ads campaign for a B2B SaaS product. You spend SGD 10,000 over one month and capture 50 leads that meet your definition of “qualified” (e.g., they work at companies with 50+ employees, filled out a form, and clicked through). Your CPL is SGD 10,000 / 50 = SGD 200 per lead.
The word “qualified” is critical. Not every form submission counts. A qualified lead typically matches your Ideal Customer Profile (ICP): the right company size, industry, geography, and job title. If you count every submission, including students, competitors, and unrelated prospects, your CPL will look artificially low. The metric becomes meaningless because you are measuring volume, not utility.
CPL differs fundamentally from Customer Acquisition Cost (CAC). CAC measures the cost to acquire an actual customer, someone who pays. CPL measures the cost to acquire a prospect who has shown interest. If your CPL is SGD 200 and your conversion rate from lead to customer is 10%, your CAC is roughly SGD 2,000. CPL is a leading indicator; CAC is a lagging one. CAC tells you if the business is profitable. CPL tells you if your marketing engine is firing efficiently upstream.
Other metrics often confused with CPL:
- CPC (Cost Per Click) measures ad spend divided by clicks. A low CPC means cheap traffic, but it does not tell you whether those clicks turn into leads.
- CPM (Cost Per Mille) is cost per thousand impressions, a brand metric. It is not a lead metric.
- CAC measures the full cost to land a paying customer, including sales costs. CPL is marketing only.
CPL acts as a health check for your top-of-funnel. If CPL spikes, something is wrong: your targeting is broader, your offer is weaker, or your competitors are bidding more aggressively. If CPL drops, you’ve either tightened targeting, improved your landing page, or market conditions have shifted in your favour. It’s a fast-moving signal that something upstream needs attention before it affects revenue.
When and Why Businesses Use CPL
CPL is the metric of choice for industries where lead volume and early-stage funnel efficiency matter most. SaaS companies, financial services firms, insurance brokers, real estate agencies, and lead-generation services all rely on it.
In SaaS, the sales cycle is often long, taking 60-90 days or more. The sales team cannot immediately convert a lead into a customer. Marketing needs to prove it is acquiring qualified prospects at a reasonable cost, and CPL is how they do it. It separates lead quality from sales effectiveness. If CPL is healthy but customer conversion is 2%, the problem is sales, not marketing.
Financial services (banks, insurance, investment platforms) use CPL heavily because they acquire customers at scale and need to track how much they spend to fill the pipeline. A bank running a mortgage lead-generation campaign might acquire 1,000 leads per month and care deeply about the cost of each one.
Real estate agents and brokers use CPL to measure the efficiency of their listing ads and open-house campaigns. A broker spending SGD 5,000 per month on Facebook ads to generate buyer leads needs to know: Am I acquiring these leads at a price I can afford to close?
CPL shines when your funnel is long or multi-stage. It is the first accountability metric because it is the first outcome marketing controls. You cannot control whether sales close a lead, but you can control how much you spend to acquire it. This makes CPL central to B2B marketing accountability: it is the metric that separates marketing skill from sales skill.
The link to downstream conversion is critical. CPL + conversion rate = effective cost per outcome. If your CPL is SGD 300 and your lead-to-customer conversion is 15%, your effective cost per customer acquisition (before sales costs) is SGD 300 / 0.15 = SGD 2,000. That calculation tells you whether your model is economically viable. Without both numbers, you cannot assess CPL effectively.
How CPL Differs Across Channels and Models
A “good” CPL on Google Search is not the same as a “good” CPL in content marketing or outbound sales. Channel, business model, and funnel structure all change the benchmark dramatically.
Paid search (Google Ads, Bing) typically has a lower CPL because the intent is high. Someone searching “SaaS payroll software” is further along the buyer journey than someone who sees a LinkedIn ad. Search CPLs are often SGD 50-200 globally; in Singapore, they are slightly lower due to lower advertising expenses.
Social media advertising (LinkedIn, Facebook, Instagram) produces higher CPLs because intent is lower. You are interrupting people in the feed rather than meeting them when they are actively looking. LinkedIn CPLs for B2B typically range from SGD 150-400 because targeting is precise, but ads are less intrusive. Facebook CPLs are usually lower (SGD 50-200) but lead quality can be weaker.

Content marketing has an inverted cost curve. Upfront, producing a blog post, guide, or webinar is expensive: SGD 3,000-10,000 per asset. But once published, it generates leads indefinitely at close to zero marginal cost. Over 12 months, a single high-ranking article might generate 500 leads from that one-time SGD 5,000 spend, yielding an effective CPL of just SGD 10. The challenge is that content takes months to produce and rank; ROI is not immediate.
Email marketing to an existing list has the lowest CPL of all: SGD 0.50-5 per lead once the list is mature. But you must build the list first, which requires the other channels.
Outbound/sales development (cold email, cold calls, LinkedIn outreach) has the highest CPL: SGD 300-1,000+ per lead. But the quality is often high because the salesperson qualifies in real time. The tradeoff is volume for precision.
The business model also shapes CPL. A product-led SaaS (where users sign up free and try the product first) has a different CPL than an enterprise sales SaaS (where a salesperson must qualify and demo). The product-led model may have a lower CPL because the barrier to entry is lower: users just sign up. The enterprise model has a higher CPL because you are only counting people who pass a qualification call.
A service-based business (consulting, accounting, design) often has a higher CPL because the lifetime value of one client is very high (SGD 50,000+), so it is economically rational to spend SGD 2,000-5,000 per lead. An e-commerce business with a lower margin cannot support that; they need CPL under SGD 10-30.
In Singapore’s competitive market, CPL tends to be lower than in the US or Europe because the cost of living is lower and ad inventory on channels like Facebook is higher. But this does not mean cheaper is always better. A Singapore agency might acquire leads at SGD 100 each, but if 80% of those leads are unqualified or from outside the target region, the effective CPL is SGD 500. Context and quality always override raw cost.
The critical lesson: compare yourself to your industry and channel, not to a company three sectors and three channels away. CPL benchmarks are only meaningful in context.
Benchmarks and What Constitutes “Good” CPL
The challenge with CPL is that no single number works everywhere. A CPL of SGD 150 is excellent for a lead-generation agency but disastrous for a high-volume e-commerce brand. Before you set targets, you need to know what “good” looks like in your world.
Industry Benchmarks (Global and Singapore-Specific Data)
Real-world CPL data comes from annual marketing benchmarks published by HubSpot, Demand Gen Report, and G2. In 2024, these sources show a clear spread by sector.
B2B SaaS typically lands at USD 100-500 (SGD 135-675). This range reflects longer sales cycles and the need for intent-driven audiences. A data-analytics platform will have a higher CPL than a simple note-taking app, because the buyer is more specialised and competition for their attention is fiercer.
Fintech and financial services run USD 150-600 (SGD 200-810) because regulatory trust and product complexity demand higher-quality leads. A mortgage platform can afford a higher CPL than a savings app because the lifetime value of a borrower justifies it.
Professional services (consulting, law, accounting) see CPLs of USD 200-800 (SGD 270-1,080). These are high-touch sales with long decision cycles. Firms often accept a higher CPL in exchange for better-qualified leads.
E-commerce and retail typically run the lowest CPLs: USD 20-100 (SGD 27-135), because volume is high and conversion windows are short. Email and retargeting dominate here, not cold outreach.
The geographic context matters. Singapore and Southeast Asia consistently show CPLs 30-40% lower than North America or Western Europe, driven by lower labor costs, higher ad inventory competition, and lower willingness-to-pay benchmarks. However, lower CPL often comes with a trade-off: higher bounce rates, lower qualification rates, or slower sales cycles. An SGD 100 lead from Singapore may convert at half the rate of an SGD 250 lead from the US.
| Industry | Typical CPL Range (SGD) | Key Variables |
|---|---|---|
| B2B SaaS | 135-675 | Sales cycle length, product complexity, buyer specificity |
| Fintech / Financial Services | 200-810 | Regulatory trust, lifetime value, risk profile |
| Professional Services | 270-1,080 | Relationship-driven sales, deal size, specialisation |
| E-Commerce / Retail | 27-135 | Volume, conversion speed, repeat purchase LTV |
| B2B Lead Generation | 100-400 | Lead volume, quality threshold, sales follow-up speed |
| Healthcare / Wellness | 80-300 | Patient acquisition cost, lifetime patient value, locality |
Use this table as a starting point, not a rule. Your CPL should land in the range for your industry, adjusted for your specific product complexity, deal size and geographic focus.
Channel-by-Channel CPL Expectations
CPL varies dramatically by channel because each channel attracts different intent levels and requires different cost structures.

Paid search (Google Ads) typically delivers the lowest CPL: SGD 50-200. Why? This is because search ads are only shown to people who are actively looking for your solution. The cost per click is higher than social media, but conversion rates are 2-5 times better, which drives down CPL. Use paid search when you have high commercial intent keywords and a strong landing page.
LinkedIn advertising sits in the middle: SGD 150-400. LinkedIn’s audience targeting is precise (job title, company size, seniority), which attracts qualified leads. But CPM is high because the platform captures a professional-audience premium. LinkedIn works best for B2B campaigns with a clear decision-maker profile.
Facebook and Instagram ads typically run at SGD 100-300 CPL, depending on audience definition and conversion rate. Broad-targeting campaigns cost less per click but convert worse. Narrowly targeted lookalike audiences (built from your best customers) often outperform both on CPL and lead quality.
Content marketing has a deferred cost structure. The upfront investment is high (SGD 2,000-10,000 per piece for quality content), but CPL drops over time as the content accumulates organic search traffic and generates leads passively. At scale, mature content marketing can deliver CPLs below SGD 50, but only after 6-12 months of investment.
Email marketing to an existing list has the lowest CPL of all: SGD 10-30 per new lead acquired, because you already own the audience. The constraint is list size and decay (people unsubscribe). Email works best as a retention and upsell channel, not as a cold-acquisition channel.
Outbound sales and sales development (cold calling, LinkedIn outreach, email sequences from SDRs) often produce the highest CPL: SGD 300-1,000+. Labour is expensive. But the quality is often the highest because the salesperson qualifies leads as they prospect. If a high CPL leads to a 30% conversion rate, the effective CAC is lower than a low CPL with a 1% conversion.
| Channel | Typical CPL (SGD) | Best For | Key Constraint |
|---|---|---|---|
| Paid search (Google Ads) | 50-200 | High-intent keywords, product-led conversion | Keyword competition, landing page quality |
| LinkedIn ads | 150-400 | B2B decision-makers, account targeting | High CPM, smaller audience size |
| Facebook / Instagram ads | 100-300 | Broad brand awareness, lookalike audiences | Ad fatigue, audience overlap |
| Content marketing (organic) | 20-80 (at scale) | Inbound, thought leadership, long-term brand | 6-12 month payoff, content production cost |
| Email marketing (existing list) | 10-30 | Retention, upselling, re-engagement | List decay, audience ownership |
| Outbound / sales development | 300-1,000+ | High-value enterprise accounts, complex sales | High labour cost, low response rates |
The right channel mix depends on your business model. A SaaS startup should probably run 50% paid search and 30% LinkedIn ads, with the remainder split between content and outbound. A service-based firm might flip that ratio: content and outbound first, paid ads as a secondary growth channel.
Factors That Move Your CPL Up or Down
CPL isn’t random. Seven levers directly drive it up or down.
Audience specificity is the loudest lever. Narrower targeting (e.g., “finance directors at UK fintech firms”) produces higher CPL because fewer people match the criteria, and ad platforms have to bid harder to fill your campaigns. Broader targeting (e.g., “anyone interested in finance”) lowers CPL because the audience is larger, but you’ll likely waste spending on unqualified leads. The sweet spot is tight enough that leads are qualified and loose enough that you have volume.
Lead quality requirements raise CPL in direct proportion to strictness. If you require leads to be from companies with 50+ employees, above a certain revenue threshold, and from a specific geography, your CPL will be 2-3 times higher than if you accept anyone who enters their email. The trade-off is real: stricter qualification = higher CPL, lower conversion rate downstream. Looser qualification = lower CPL, higher waste rate and lower downstream conversion.
Seasonal demand and competition move CPL on a calendar. January and September (back-to-business periods) see higher CPLs because every brand is competing for attention. July and August typically see lower CPLs as competition drops. Black Friday and Cyber Monday are expensive for e-commerce but cheap for B2B. Plan campaigns around competitor activity, not just on internal calendars.
Ad spend scale often improves CPL through economies of scale, but the relationship is non-linear. Your first SGD 1,000 spend will likely have a higher CPL than your SGD 10,000 spend because the algorithm needs time to learn. However, beyond SGD 50,000/month, scaling spend can increase CPL if you’re exhausting your best audiences. The optimal spend for a given campaign is rarely “as much as possible”.
Landing page conversion rate is a hidden multiplier on CPL. If your landing page converts 2% of visitors to leads, and you drive 1,000 visitors for SGD 500, your CPL is SGD 250. If you improve that page to 4% conversion, your CPL drops to SGD 125 without touching ad spend. A 50% improvement in page conversion cuts your effective CPL in half.
Geographic targeting significantly affects CPL across Asia-Pacific. Singapore and Hong Kong see lower CPLs than Australia or New Zealand because ad inventory is higher and the cost of living is lower. Within Singapore, CPLs for e-commerce are 20-30% lower than for B2B SaaS because e-commerce audiences are larger and less contested.
The practical takeaway: if your CPL is above the industry benchmark, diagnose which lever is causing it. Is your audience definition too narrow? Your landing page (too low conversion)? Your channel choice (you’re in an expensive channel for your use case)? Once you identify the lever, you can pull it with surgical precision.
How to Calculate and Track CPL Correctly
Calculating CPL accurately is deceptively simple in theory but easy to mess up in practice. The difference between a correct CPL figure and a false one can lead you to optimise the wrong channels, overspend on poor-performing campaigns, and make strategic decisions on flawed data. This section walks you through the calculation step-by-step, shows you how to handle attribution across channels, and flags the mistakes that trip up most teams.
The CPL Formula and Worked Example
The formula for Cost Per Lead is straightforward:
Total Marketing Spend / Number of Qualified Leads = CPL
Let’s use a concrete example. Suppose your company ran a LinkedIn advertising campaign in January 2024. You spent SGD 10,000 across ad creative, platform fees, and account management. The campaign generated 50 leads that met your qualification criteria (more on what “qualified” means in a moment). Your CPL is:
SGD 10,000 / 50 leads = SGD 200 per lead
That number tells you what each lead cost to acquire through that specific channel. On its own, it’s a data point. Compared against your benchmark (say, SGD 150 for LinkedIn in your industry), it signals that your campaign ran slightly above efficiency. Compared against your downstream conversion rate and customer lifetime value, it tells you whether the leads are worth pursuing.
The hard part is not the arithmetic. It is deciding what counts as a “qualified” lead.
What Is a Qualified Lead?
Not every form submission counts. A qualified lead is one that fits your Ideal Customer Profile (ICP) and is worth your sales team’s time to pursue. The definition varies by business model:
- In B2B SaaS, a qualified lead often has a job title matching your ideal buyer (VP of Marketing, CTO), works at a company size you can serve, and is in a geography where you operate. Tools like HubSpot and Salesforce call this an MQL (Marketing Qualified Lead) before sales engagement, or an SQL (Sales Qualified Lead) once a salesperson has validated fit.
- In lead-generation services (insurance quotes, legal referrals), “qualified” usually means the lead answered screening questions correctly (e.g., “Do you own your home?” = “Yes”). Form bots and obvious frauds get excluded.
- In e-commerce, a qualified lead might be someone who signed up for your email list and confirmed their email address (not just filled out a form once).
The stricter your qualification rules, the fewer leads you’ll count. That raises your CPL. The looser they are, the more leads you count and the lower your CPL appears. But looser definitions hide a harder truth: you’re paying for leads that won’t convert, so your effective cost per actual customer is much higher.
Set your qualification criteria before you start the campaign, not after. Document it in your CRM. If you’re new to this, start with a basic definition: the lead came from a qualifying source, had a valid email address, and completed the core questions on your form. As you mature, add attributes like company size, job title match, or industry.
The Timing Problem: When Spend and Leads Don’t Align
Here is a real scenario that catches many teams off guard: you spend SGD 5,000 on Google Ads in January. The leads generated from those ads arrive in January, but some click the ad, leave the site, and don’t fill out the form until February. Your CRM shows those leads as “generated in February”. Meanwhile, you’re trying to calculate January’s CPL using January’s spend but only January’s lead count.
The result is a distorted CPL. January looks artificially expensive; February artificially cheap.
Solution: Use a consistent attribution window. The most common approach is to count leads by the date they were generated (form submission date), not by the date they first clicked. If you spent in January and leads trickled in through February, add both months’ leads to the calculation, but only if the lag is short (under 14 days).
A more robust method, used by teams with longer sales cycles:
- Run the campaign from Day 1 to Day 30.
- Wait 14 days after the campaign ends (to capture delayed form submissions).
- Count all leads generated between Day 1 and Day 44.
- Divide this by the spend from Days 1 to 30.
For campaigns with 90+ day sales cycles (enterprise B2B), you may need to wait even longer. The trade-off is the speed of insight. If you wait 60 days to calculate CPL, your optimisation decision is 2 months late. Most teams accept a 14-day lag as a practical compromise.
Attribution and Multi-Touch Tracking
Here is where most teams stumble: the path a lead takes is rarely a straight line from one marketing touchpoint to a form submission. A prospect might:
- See your LinkedIn ad.
- Click it but leave without filling in the form.
- Search Google for your company name a week later.
- Land on your blog via an organic search result.
- Read an article.
- Click a CTA to a webinar signup page.
- Fill out the webinar form.
Which touchpoint should get credit for the lead? If you give it all to the LinkedIn ad, you overvalue LinkedIn and undervalue your organic content efforts. If you assign it all to the last touchpoint (the webinar), you ignore the LinkedIn ad that started the journey. Both distort your CPL calculation.
Single-Touch Attribution: The Problem
Most platforms default to single-touch attribution: one channel gets 100% of the credit. Google Ads gives the lead to Google. LinkedIn credits the lead to LinkedIn. Your website analytics may credit it to organic search.
Single-touch attribution inflates CPL across all channels except the last one. If a lead took five touchpoints to convert, and you attribute 100% to the last channel, the other four channels appear less efficient than they are. You then cut spending on those channels, not realising they were part of the journey.
A practical example: You spend SGD 2,000 on LinkedIn ads and SGD 2,000 on content promotion. A single prospect touches both (LinkedIn ad first, then blog post last), then fills out a form. Under last-touch attribution, content gets the lead, and CPL is SGD 1.00. LinkedIn gets SGD 0.00 credit. The CPL for LinkedIn ads appears infinitely high, so you cut that budget. But you just removed a key awareness driver.
Multi-Touch Attribution Models
Multi-touch models distribute credit across multiple touchpoints. The most common are:


| Model | How It Works | Best For |
|---|---|---|
| First-Touch | Credits the first touchpoint with 100% of the lead | Understanding awareness channels (what first reaches your audience) |
| Last-Touch | Credits the last touchpoint with 100% (standard default) | Understanding conversion channels (what closes people) |
| Linear | Splits credit equally across all touchpoints | When you believe all channels are equally important |
| Time-Decay | Gives more credit to touchpoints closer to the conversion | Acknowledging that recent interactions matter more |
| Custom | You assign weights (e.g., 20% first-touch, 10% middle, 70% last-touch). | When you have evidence about your specific customer journey |
For most teams starting out, last touch is pragmatic: it’s simple to implement, aligns with sales handoff (the last thing they saw before they contacted you), and avoids the data infrastructure overhead of more complex models. The limitation: it undervalues top-of-funnel awareness channels like display ads, social, and content.
As you mature, move toward a time-decay or custom model, especially if your sales cycle is long and multiple teams influence the prospect before they’re ready to buy.
How to Implement Multi-Touch Attribution
The tooling matters. Here is what you need:
Google Analytics 4 offers native multi-touch attribution. Go to Conversions > Attribution > Model Comparison Tool. You can see how first-touch, last-touch, and other models distribute credit. The limitation: GA4 only sees web touchpoints, not offline events like sales calls or LinkedIn messaging. Free, but incomplete for B2B.
HubSpot tracks touchpoints natively within the CRM. Every time a lead interacts with an email, landing page, or ad, HubSpot logs it. You can run HubSpot reports to see CPL by channel using its built-in attribution. This is popular in Singapore’s SaaS and services sectors. Mid-market friendly.
Marketo / Adobe Marketo Engage offers sophisticated multi-touch models and lead-scoring rules. Enterprise-grade, steeper learning curve. This platform is used by larger B2B organisations with complex sales processes.
Segment, mParticle, or Tealium act as a “customer data platform.” They collect data from all your ad platforms, websites, CRMs, and email tools, then unify it in a single warehouse. You then query the warehouse to calculate CPL using any attribution model you choose. Powerful but requires data engineering. Best for companies running 10+ marketing channels.
Practical Starting Point: Last-Touch Attribution with UTM Parameters
If you’re new to this method, don’t overthink it. Use UTM parameters to tag every ad, email link, and piece of content. When someone clicks a link and lands on your site, the UTM parameter tells you the source. When they convert, you see the source.
UTM format: https://yoursite.com/signup?utm_source=linkedin&utm_medium=sponsored&utm_campaign=jan2024
Then:
- Send all traffic through UTM-tagged links.
- Sync your CRM (HubSpot, Salesforce) with your analytics (GA4, Google Search Console).
- Run a report: leads by UTM source.
- Calculate CPL per source: spend / leads per source.
This works for most teams in their first year of CPL tracking. You’ll miss some touchpoints (offline calls, demo requests), but you’ll capture 70-80% of the journey and avoid the most egregious single-touch mistakes.
Avoiding Double-Counting Across Channels
One lead, multiple platforms: this is where the process can become complicated. A prospect might fill out a form on your website after clicking a Google Ad. The same lead also appears in your LinkedIn lead syncing tool (LinkedIn saw them in the audience). Now you have one lead counted twice: once from Google, once from LinkedIn. Your CPL looks artificially low.
Prevention:
- Deduplicate in your CRM. Tools like HubSpot do this job automatically (they merge duplicate email addresses). Salesforce requires manual rules or a third-party app.
- Count leads only at the source where they were acquired. If LinkedIn’s lead-sync tool submitted the lead, credit it to LinkedIn. Exclude it from Google Ads conversion tracking.
- Use a single source of truth. Pull CPL data from your CRM (HubSpot, Salesforce), not from individual ad platforms. Ad platforms over-claim credit.
Common Mistakes in CPL Calculation
These errors are rampant. Knowing them helps you avoid them and spot them in others’ reporting.
1. Including Non-Qualified Leads
You ran a campaign. The landing page got 1,000 visits. 200 people filled out a form. You celebrate: SGD 5,000 spend, 200 leads, CPL = SGD 25.
Except: you checked the CRM. 120 of those 200 were students (your ICP is working professionals at large companies). 30 had invalid email addresses. 15 were bots. True qualified leads: 35.
Real CPL: SGD 5,000 / 35 = SGD 143 per lead, not SGD 25.
The fix: validate and score leads in your CRM before calculating CPL. Mark leads that don’t fit your ICP. Run CPL on qualified leads only.
2. Forgetting to Exclude Internal Traffic and Test Submissions
Your team tested the form 12 times. Your boss submitted it once. The account manager’s assistant filled it out twice to see what the email workflow does. Now you’re dividing the spend by 200 forms, even though only 197 were real prospects.
This inflates CPL artificially when you exclude test submissions, but it’s the right number.
The fix is to have your marketing or CRM team add a rule. Flag any lead with a company email domain as internal and exclude it from CPL calculations. Better: set up a test user in your analytics (Google Analytics has an “exclude internal traffic” filter) and in your CRM.
3. Not Annualising Seasonal Campaigns
You ran a promotional campaign in November (Black Friday). SGD 10,000 spent, 200 leads generated. CPL = SGD 50. You celebrated and reallocated the budget based on this apparently amazing CPL.
The problem: November is your highest-volume month. You’ll never see CPL = SGD 50 again. Your annual CPL average is closer to SGD 200, but you’re now managing to a November anomaly.
The fix: flag seasonal campaigns separately. Calculate CPL for November alone, but also calculate an “annual CPL” that accounts for seasonality. Use the seasonal CPL for channel-selection decisions, not the global average.
4. Mixing CPL with CAC Without Accounting for Conversion Rate
You have a CPL of SGD 150. Your competitor has a CPL of SGD 100. You think they’re 40% more efficient.
But you don’t know their conversion rate. If your CPL of SGD 150 turns into a CAC of SGD 1,500 (10% conversion rate), and their CPL of SGD 100 turns into a CAC of SGD 5,000 (2% conversion rate), you’re actually more efficient, not less.
The fix: always calculate both. CPL is the lead stage; CAC is the revenue stage. The formula:
CPL x (1 / conversion rate) = CAC
If your conversion rate is 10%, your CPL of SGD 150 means a CAC of SGD 1,500. That’s what is relevant for profitability.
5. Miscounting Spend
You spent SGD 5,000 on Google Ads. But you forgot:
- Google’s platform fees (SGD 200).
- The freelancer who designed the landing page (SGD 800).
- The email marketing tool subscription that month (SGD 50).
- Your agency’s 15% markup (SGD 900).
Real spend: SGD 7,150, not SGD 5,000.
Undercounting spend artificially lowers your CPL. You think you’re more efficient than you are.
The fix: include all costs. When you calculate CPL, include:
- Paid media spend (Google, Facebook, LinkedIn, etc.).
- Agency fees or markups on that spend.
- Tools used exclusively for that campaign (landing page builder, email tool).
- Staff time if you’re allocating it (this is optional for most teams, but include it if you’re trying to calculate true cost).
Do not include general overhead (office rent, salaries of permanent staff) unless you are using a full absorption accounting model.
6. Misaligned Lead Definitions Across Teams
Marketing counts a lead as anyone who fills out a form. Sales counts a lead as someone who’s actually reachable and expressed intent. Finance counts a lead as someone who’s been touched by an SDR at least once.
Now you have three different “lead counts” and three different CPLs for the same campaign. Reporting becomes a mess, and budget allocation decisions are based on conflicting numbers.
The fix: align on a single lead definition across marketing, sales, and finance before you start tracking. Document it in your CRM as a lead scoring rule. Everyone uses the same definition for CPL calculations.
Checklist: CPL Calculation Quality Control
Before you report a CPL number, run through the checklist:
- [ ] Leads are counted from your CRM, not from a marketing tool (the single source of truth).
- [ ] Only qualified leads are counted (using your defined ICP and lead scoring rules).
- [ ] Internal traffic, test submissions, and bots are excluded.
- [ ] Spend includes all costs related to the campaign (media, fees, landing page, and tools).
- [ ] Spends and leads are aligned to the same time period (with a maximum 14-day lag for late submissions).
- [ ] Double-counted leads (the same person from multiple channels) are deduplicated.
- [ ] Invalid email addresses are marked and excluded from the analysis.
- [ ] You’ve calculated both CPL and the conversion rate to determine the true CAC.
- [ ] Seasonal campaigns are flagged separately; annual CPL accounts for seasonality.
- [ ] You’re comparing CPL against the right benchmark (industry, channel, and geography, not a random competitor).
Optimising CPL: Tactics That Work
Knowing your CPL is useful. Improving it is invaluable. This section covers the highest-impact levers that drive CPL down without sacrificing lead quality. The key principle: don’t just chase a lower number. Optimise for a lower CPL that also converts well downstream.
1. Landing Page Conversion Rate Optimisation
Your landing page is where most CPL improvements happen. A 1% improvement in your form conversion rate can cut your effective CPL by 50% or more, without changing your ad spend at all.
The Math: If 1,000 people visit your page and 20 fill out the form (2% conversion), your CPL is SGD 250 (assuming a spend of SGD 5,000). If you improve that to 40 conversions (4% conversion rate), your CPL drops to SGD 125. You just cut your CPL in half by doubling your conversion rate. Same ad spend. Better leads. Better economics.
High-Impact Landing Page Changes:
- Shorten the form. A three-field form (name, email, company) converts 2-3 times better than a ten-field form. Ask only the questions you absolutely need to qualify. If you need additional information, ask for it after they convert or in a follow-up email.
- Match the ad copy to the page headline. If your ad says “The fastest payroll software for startups”, your landing page headline should echo that. Misalignment causes bounce; alignment signals that the person landed in the right place.
- Use specific value props, not generic ones. “Cut payroll processing time by 75%” converts better than “Easy payroll software”. Specificity builds trust and clarity.
- Remove navigation. Don’t provide people an escape route. Remove the header menu and footer links that let them leave your landing page. The only call-to-action should be the form.
- Show social proof or credibility signals. A logo wall (companies using your product), a testimonial, or a security badge can increase form completion rates by 15-30%. People convert more when they see others like them have already done it.
- Use a single-column layout. Multi-column layouts with images on the left and forms on the right often underperform. A single-column layout (value prop at top, form below) is cleaner and converts better on mobile.
- Test the button colour and text. Obvious but true: an orange “Get Started” button often converts better than a grey “Submit” button. Warm colors signal action. Weak verbs signal burden.
Testing Framework: Use A/B testing tools like Unbounce, Leadpages, or even Google Optimise. Test one element at a time (form length, headline, image, button colour). Run each test for at least 2 weeks or 500 conversions, whichever comes first. Document the winner. Apply it to all related pages. Iterate.
The expectation is that a mature landing page should convert 3-8% of visitors into leads. If yours is below 2%, there’s easy upside. You’re doing well if it’s above 8%.
2. Audience Targeting Refinement
Broad audiences generate cheap clicks but low-quality leads. Narrow audiences generate higher CPL but better conversion downstream. The optimisation is finding the sweet spot: narrow enough to be qualified, broad enough to have volume.
Targeting Levers by Channel:
Google Ads (Search): Move from broad match to phrase or exact match keywords. Broad match keywords reach a broad audience but can lead to irrelevant searches. A search for “free payroll software” shouldn’t trigger your paid “premium payroll for enterprises” ad. Use negative keywords aggressively (add “-free”, “-cheap”, and “-DIY” to your negative keyword list if your product is premium). This raises your CPL but improves conversion quality dramatically.
LinkedIn Ads: Layer targeting criteria. Don’t just target “marketing managers”; target “marketing managers at companies with 50-500 employees in Singapore and Australia, in software or financial services, with 5+ years of experience”. Target “marketing managers at companies with 50-500 employees in Singapore and Australia, in software or financial services, with 5+ years of experience.” Narrower targeting yields higher CPL but far better conversion. Test 2-3 audience combinations and measure CPL and downstream conversion rates for each.
Facebook / Instagram Ads: Use lookalike audiences instead of broad demographic targeting. Create a lookalike audience based on your best customers (those who converted and had high lifetime value). Facebook will find people similar to them. Lookalike audiences typically cost 10-20% more per click but convert 2-4 times better, resulting in a lower effective CPL.
3. Channel Selection and Budget Allocation
Not all channels suit every business. If your product is B2B enterprise software, spending 40% of your budget on Facebook is wasteful. If it’s a consumer e-commerce brand, spending on LinkedIn is wasteful.
Channel Selection Decision Framework:
| Business Model | Primary Channels (in priority order) | Why |
|---|---|---|
| B2B SaaS (mid-market) | 1. Paid search, 2. LinkedIn ads, 3. Content, 4. Outbound | High intent, decision-maker targeting, and thought leadership build trust |
| B2B SaaS (enterprise) | 1. Content, 2. Outbound/SDRs, 3. LinkedIn ads, 4. Industry events | Complex sales, relationship-driven, multiple stakeholders |
| B2B Services (consulting, law) | 1. Content, 2. LinkedIn ads, 3. Thought leadership (speaking), 4. Referral programmes | Trust and authority are primary buying factors; repeat business from referrals |
| E-Commerce (consumer goods) | 1. Paid search, 2. Facebook / Instagram ads, 3. Email, 4. Influencer partnerships | Quick decision cycles, impulse-driven, visual appeal matters |
| Lead Generation (insurance, legal referrals) | 1. Paid search, 2. Content, 3. Display / retargeting, 4. Affiliate/partnerships | High intent + high volume, problem-specific search terms |
| Local Services (plumbing, real estate, salons) | 1. Google Local Services, 2. Facebook / Instagram, 3. Google Business Profile, 4. Referral programmes | Geographic targeting, visual reputation, trust signals |
Budget Allocation Principle: Allocate budget to channels where CPL is lowest and conversion to revenue is highest. If paid search has a CPL of SGD 100 but converts to revenue at 8%, and LinkedIn has a CPL of SGD 200 but converts at 20%, LinkedIn is actually more efficient on a CAC basis. Allocate 70% of the budget to LinkedIn and 30% to search, then optimise from there.
Reallocation Frequency: Review channel performance monthly. If a channel’s CPL drifts 15%+ above the benchmark, reduce the budget by 20-30% and shift it to the best performer. If a channel’s CPL is consistently low and conversion is high, increase the budget incrementally (10-20% per month) until either the CPL rises or the volume plateaus (a sign you’ve saturated the audience).
4. Lead Scoring and Follow-Up Speed
CPL tracks acquisition cost, but lead quality matters downstream. A cheap lead that never converts is expensive in true cost. A more expensive lead that converts quickly and closes is efficient.
Lead Scoring: Assign points to leads based on their attributes and behaviours. A person who filled out a form is +10 points. They work at a 100+ person company: +15 points. They visited your pricing page: +10 points. They clicked the “book a demo” button: +20 points. Total: 55 points.
Set a threshold (e.g., 45+ points = Sales Qualified Lead). Leads below the threshold get nurtured with email content. Leads above the threshold go to sales immediately. This ensures your sales team spends time on leads most likely to convert, improving both the conversion rate and effective CAC.
Follow-Up Speed: A lead that is contacted within 5 minutes of form submission is 100 times more likely to convert than a lead contacted after 24 hours. Implement automated follow-up: within 5 minutes of form submission, send an email or trigger a sales notification. If possible, please send an SMS for high-priority leads.
Tools: HubSpot, Salesforce, and Pipedrive all offer automation workflows. Set up a rule: “If a lead comes in from [channel] and the score is [threshold], send email template [X] within 5 minutes, then escalate to sales 15 minutes later.”
Impact on CPL: Better lead scoring and faster follow-up don’t lower CPL directly, but they lower CAC by improving the conversion rate. If CPL stays at SGD 200 but conversion improves from 5% to 10% due to faster follow-up, your effective CAC drops from SGD 4,000 to SGD 2,000. This is a CPL optimisation win.
5. Retargeting and Sequential Messaging
Most people don’t convert on their first visit. They visit your landing page, read the value prop, get spooked by pricing or a form field, and leave. If you re-target them with a different message, conversion rates improve dramatically.
Retargeting Strategy:
- Someone visits your landing page but doesn’t convert. Tag them as “landing page visitor, non-converter”.
- Over the next 7 days, show them a retargeting ad with a different message. If the original ad was “Save time”, the retargeting ad should be “See how much you’ll save” (with a customer testimonial or ROI calculator).
- If they still do not convert, consider sending a second retargeting sequence. Use a different angle and, if possible, a different channel (e.g., search retargeting, then social retargeting, then email).
- Stop after 3 retargeting touches. At that point, they’re either not interested or need to be nurtured in a longer email sequence rather than chased with ads.
Impact on CPL: Retargeting doesn’t lower CPL (you’re paying to reach people again), but it improves the overall conversion rate. If 2% of first-visit users convert, and 1% of retargeted users convert on their second or third visit, your total conversion rate rises to 3% from the same audience. Cost per visit stays the same, but cost per lead drops because more people convert.
6. Content Marketing as a CPL Lever
Content marketing has a high upfront cost but a low marginal cost. A blog post costs SGD 2,000-5,000 to produce and optimise for search. But if it ranks for a keyword with 500 monthly searches and converts 1% of visitors into leads, it generates 5 leads per month indefinitely. After 12 months, that’s 60 leads for SGD 5,000, or SGD 83 per lead. Compare that to SGD 200/lead from paid search in the same period, and content is 2.4x more efficient.
Content Topics That Drive CPL Down:
- Comparison guides (“HubSpot vs. Salesforce”, “benchmarks for SaaS payroll software”). People reading these are in decision mode. High conversion rates.
- How-to guides (“How to reduce payroll processing time”). Intent is clear; people are ready to learn and take action.
- Beginner’s guides to your industry. These attract early-stage prospects who aren’t ready to buy yet, but nurturing them into customers has a high lifetime value.
- ROI calculators and interactive tools. Users input their data and see a personalised result. These require an email to see the result, so lead capture is built in.