Most businesses track their SEO investment the wrong way. They obsess over rankings, celebrate traffic spikes, and monitor keyword positions, then wonder why revenue stays flat at the end of the quarter.


The problem is rarely the metrics themselves. The problem sits one layer deeper: treating SEO as a visibility exercise when finance directors fund it as a commercial engine.
Real performance from your SEO investment lives in the underexplored territory where search behaviour meets purchase intent and margin contribution. Most competitors are still chasing rankings against keyword lists that look impressive in a slide deck. The genuine opportunity sits in connecting organic visibility directly to customer lifetime value, transaction patterns, and product-level margin. That is where the majority of Singapore businesses leave seven-figure sums on the table every year.
This guide introduces MediaOne’s Revenue Intelligence Framework, our proprietary methodology that reframes SEO measurement around financial outcomes. It is built from more than 800 client audits across Singapore, Malaysia, and the wider APAC region, and it is the same approach we use to decide whether a client should keep, scale, or restructure their SEO programme.
If you have ever searched “how to calculate SEO ROI accurately” or “is my SEO agency actually making me money”, this is the framework you were looking for.
Key Takeaways
- The precise calculation method that exposes whether your SEO spending generates profit or quietly burns budget
- How to identify which 15–20% of your keywords drive 70–85% of organic revenue (we call this the Revenue Corridor)
- Why measuring revenue instead of profit creates an illusion of success that collapses under financial scrutiny
- The hidden costs that make 60% of “in-house SEO” more expensive than agency work once fully loaded
- Three-dimensional optimisation that increased one client’s revenue per session from S$1.06 to S$1.97 in four months
- Why AI search in 2026 is forcing a complete rethink of attribution, and how to adapt before your reporting falls apart
Why Standard SEO Metrics Create Commercial Blind Spots
Walk into any marketing meeting where SEO investment decisions gets discussed and you will hear the same vocabulary every time.

- “We are ranking number three for that keyword.”
- “Traffic is up 40% year-on-year.”
- “We have built 50 new backlinks this quarter.”
If you have ever asked yourself “what SEO metrics actually matter to my CFO”, you already know these statements describe activity, while saying almost nothing about value.
The question every finance director eventually asks: for every dollar we invest in organic search, how many dollars of attributable profit come back?
Most agencies cannot answer this in a single meeting. That is the gap the Revenue Intelligence Framework closes.
A Real Audit That Exposed the Problem
In 2023, we audited a Singapore logistics company spending S$7,182 per month on SEO. Their incumbent agency reported impressive surface-level progress:
| Metric | Performance |
| Organic Traffic Growth | +67% year-over-year |
| Page-One Rankings | 23 target keywords achieved |
| Domain Authority | Increased from 32 to 41 |
The finance director asked one question during the quarterly review: “How much revenue did this generate?”
The agency could not answer. Neither could the internal marketing manager. That silence, repeated across hundreds of boardrooms in Singapore every quarter, is the real reason SEO budgets get cut.
We implemented proper attribution tracking over the following six weeks. The truth was uncomfortable:
| Financial Reality | Amount |
| Monthly Organic Revenue | S$14,364 |
| Company Gross Margin | 22% |
| Gross Profit Generated | S$3,160 |
| Monthly SEO Investment | S$7,182 |
| Net Result | -S$4,022 loss |
| Actual ROI | -56% |
Despite growing traffic and improving rankings, SEO was destroying value at roughly S$48,000 per year. Across dozens of audits we conducted between 2022 and 2024, we found that 40% of businesses spending S$3,420+ per month on SEO cannot accurately link their investment to profit contribution. Most do not realise this until a new finance leader joins and asks the question nobody wanted to ask.
This is the uncomfortable truth our SEO audit services are built around: rankings without revenue are a vanity exercise.
How to Calculate SEO ROI: The Core Formula
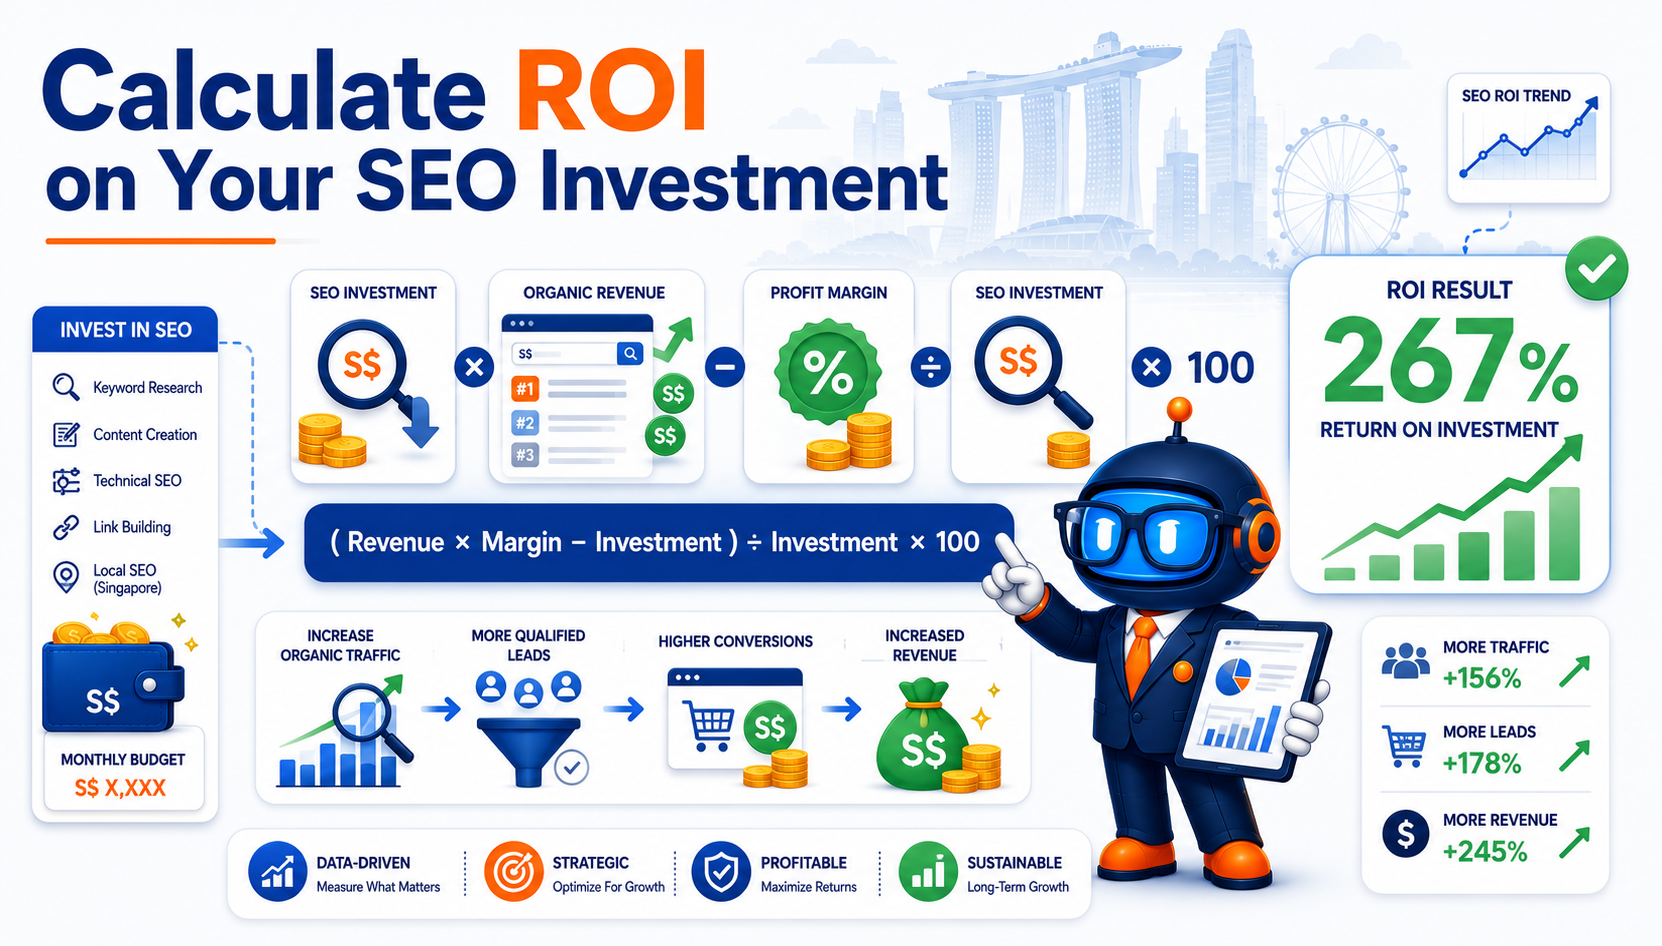
The commercial return from your SEO investment is the attributable profit generated by visitors who arrived via organic search, minus the fully loaded cost of all optimisation activity.
The Revenue Intelligence Formula
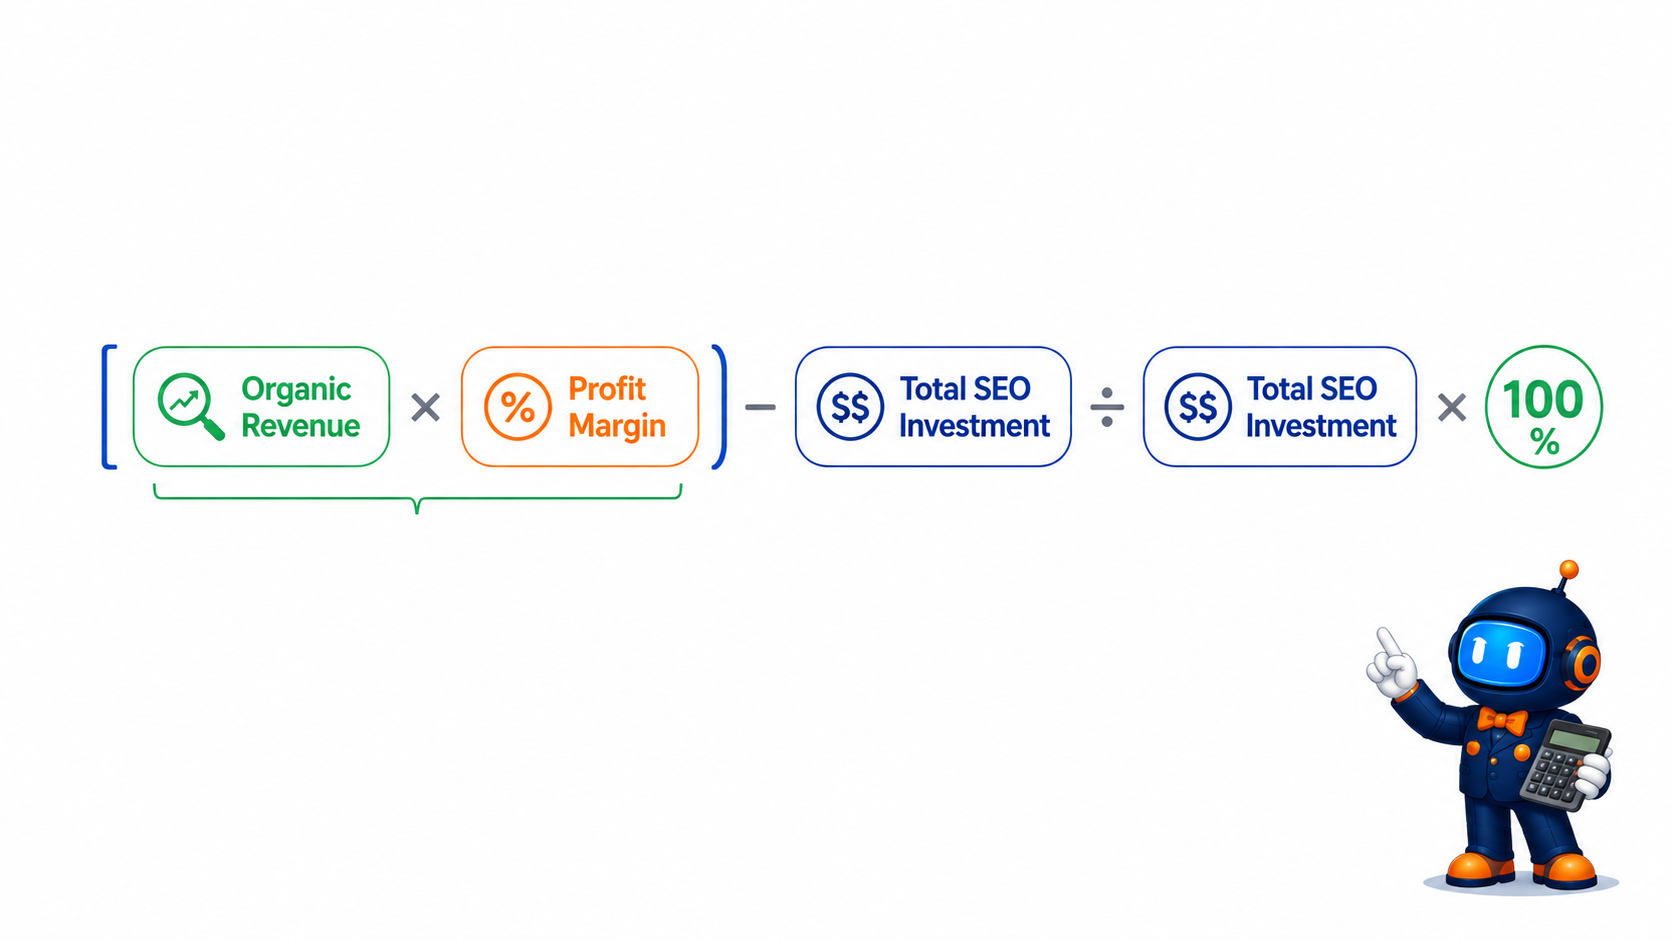
[(Organic Revenue × Profit Margin) – Total SEO Investment] ÷ Total SEO Investment × 100
Two Scenarios, Two Different Realities
Scenario One: E-Commerce Business (Profitable)
| Component | Value |
| Monthly SEO Investment | S$10,260 |
| Organic Revenue Generated | S$37,620 |
| Gross Profit Margin | 38% |
| Gross Profit | S$14,296 |
| Net Gain | S$4,036 |
| ROI | 39.3% |
Scenario Two: Professional Services Firm (Unprofitable)
| Component | Value |
| Monthly SEO Investment | S$10,260 |
| Organic Revenue Generated | S$37,620 |
| Net Profit Margin | 18% |
| Net Profit | S$6,772 |
| Net Gain | -S$3,488 |
| ROI | -34% |
Identical investment. Identical revenue. Completely different commercial outcomes.
The second business loses money because its margin profile cannot cover its cost structure. This is the single most common error we see in client-side reporting and the reason revenue-based ROI calculations are commercially dangerous. They ignore margin, and margin determines whether revenue creates profit or just creates activity.
If your current reporting stops at revenue, you are flying blind. We have walked into rooms where senior management was celebrating “positive SEO ROI” while the channel was quietly destroying gross margin.
The Margin Analysis That Changes Everything
In 2024, we worked with a Singapore furniture retailer that spent S$8,892 per month on SEO and generated S$71,820 in organic revenue, an apparent 808% ROI that looked like a textbook success story. The founder was prepared to triple the budget.
We asked to see the product-level margin breakdown before signing anything.
When we analysed margin contribution by category, the picture changed completely:
| Analysis | Before | After Restructure |
| Monthly Organic Revenue | S$71,820 | S$80,370 |
| Weighted Margin | 23% | 37% |
| Gross Profit | S$16,519 | S$29,737 |
| SEO Investment | S$8,892 | S$8,892 |
| Net Gain | S$7,627 | S$20,845 |
| Actual ROI | 85.8% | 234% |
Their existing keyword strategy was inadvertently funnelling traffic toward low-margin items, dining chairs sitting at 12–15% margin, while their high-margin categories such as designer lighting (45–52%) received almost zero organic visibility.
We rebuilt the keyword strategy around margin-weighted opportunity rather than search volume. Revenue rose only 12%. Monthly profit contribution rose 80%. The founder doubled the budget instead of tripling it, and the channel paid back faster.
We call this approach Margin-Weighted Keyword Targeting. It sits at the heart of how we run our SEO agency, and it is the single biggest unlock for retailers and B2B firms running multi-product catalogues.
So, if you’ve ever asked “why is my SEO traffic growing but my profit isn’t”, this is almost always the reason.
Calculating Your True SEO Investment (Including Hidden Costs)
Most businesses dramatically underestimate the actual cost of their SEO investment by failing to account for hidden expenses and internal time allocation. We call this the Iceberg Investment Problem: the agency retainer is the visible 30%, while internal coordination, content SME time, and developer hours form the invisible 70% sitting below the waterline.
Complete Outsourced SEO Cost Structure
| Cost Component | Monthly Range |
| Agency Retainer | S$5,130–S$13,680 |
| Internal Coordination | S$1,368–S$2,565 |
| Content SME Time | S$855–S$2,052 |
| Developer Implementation | S$1,710–S$3,420 |
| Content Assets | S$855–S$3,420 |
| Paid Amplification | S$342–S$2,565 |
| Total Fully-Loaded Cost | S$10,260–S$27,702 |
A business with a S$7,695 monthly agency retainer often has a true, fully-loaded cost of S$11,115–S$12,312 once internal hours are properly accounted for.
This matters because calculating ROI based on S$7,695 while actually spending S$11,628 overstates return by 51% and distorts every downstream decision. If you are searching “what does SEO actually cost in Singapore”, the honest answer is “more than the invoice you are looking at.” For the agency-side numbers specifically, our breakdown on SEO company pricing in Singapore walks through what you should expect to pay and what should raise concerns.
In-House SEO: The Hidden Cost Reality

We worked with a Singapore financial services company that considered their SEO cost to be S$3,078 per month (tool subscriptions plus freelance content). The CMO was convinced they were running a lean operation.
After a comprehensive cost audit, the actual investment looked very different:
| Cost Component | Monthly Amount |
| SEO Manager Salary Allocation | S$7,182 |
| Content Writer Allocation | S$3,591 |
| Developer Time | S$3,078 |
| SEO Platforms | S$1,710 |
| Link Acquisition | S$2,394 |
| Content Production | S$1,026 |
| Training & Conferences | S$599 |
| Total Actual Investment | S$19,580 |
They were calculating ROI based on S$3,078 while actually spending S$19,580. A 636% underestimation that made unprofitable SEO appear highly successful and almost cost the marketing director her role when finance ran the numbers independently.
If your in-house SEO cost calculation does not include fully-loaded salary allocations, you are not calculating cost, you are calculating an invoice. The two are not the same thing.
Measuring Attributable Profit: The Revenue Side
Multi-Touch Attribution Models Compared
The best attribution model for SEO measurement depends on your conversion volume.
| Attribution Model | Credit Distribution | Best For |
| Last-Click | 100% to the final touchpoint | Simple tracking (undervalues SEO) |
| Position-Based | 40% first, 20% middle, 40% last | Balanced journey view |
| Data-Driven | Algorithm-weighted by performance | High-volume conversion data |
Example with Position-Based Attribution:
A S$342 purchase with 38% margin generates S$130 profit. For a customer journey involving organic search (discovery), social media (consideration), and branded search (conversion), that S$130 is allocated as follows:
- Organic Search: S$52 (40% credit)
- Social Media: S$26 (20% credit)
- Branded Search: S$52 (40% credit)
Under last-click attribution, organic search receives S$0 credit. Under position-based attribution, it receives S$52. That single modelling choice changes whether SEO looks like a budget drain or a top-three channel.
We approached this problem by implementing position-based or data-driven attribution for clients with 500+ monthly conversions. For lower-volume businesses, we apply a Discovery Multiplier of 1.3–1.6× to organic search conversions to account for assist value that last-click models systematically erase. This sits inside our broader conversion rate optimisation work, because attribution and conversion design are two sides of the same commercial picture.
Service Business Attribution: Case Study Results
A Singapore commercial property consultancy tracked organic lead volume for 18 months but had no visibility into actual lead value. They suspected SEO was working. They could not prove it.
We implemented an integrated tracking path: Google Analytics → Enquiry Forms → HubSpot CRM → Revenue Records.
Results after four months:
| Metric | Performance |
| Total Organic Leads | 72 leads |
| Converted to Clients | 11 clients (15.3% close rate) |
| Average Project Value | S$48,564 |
| Total Attributable Profit | S$224,365 |
| Quarterly SEO Investment | S$28,728 |
| Quarterly ROI | 681% |
Before proper attribution, the partners considered SEO “questionable but worth continuing.” Afterwards, it became their highest-return channel and they redirected paid search budget into organic content production. This is the kind of shift that only becomes visible once the measurement layer catches up with the actual customer journey.
Important Commercial Metrics That Drive Real Profit
The Commercial Traffic Framework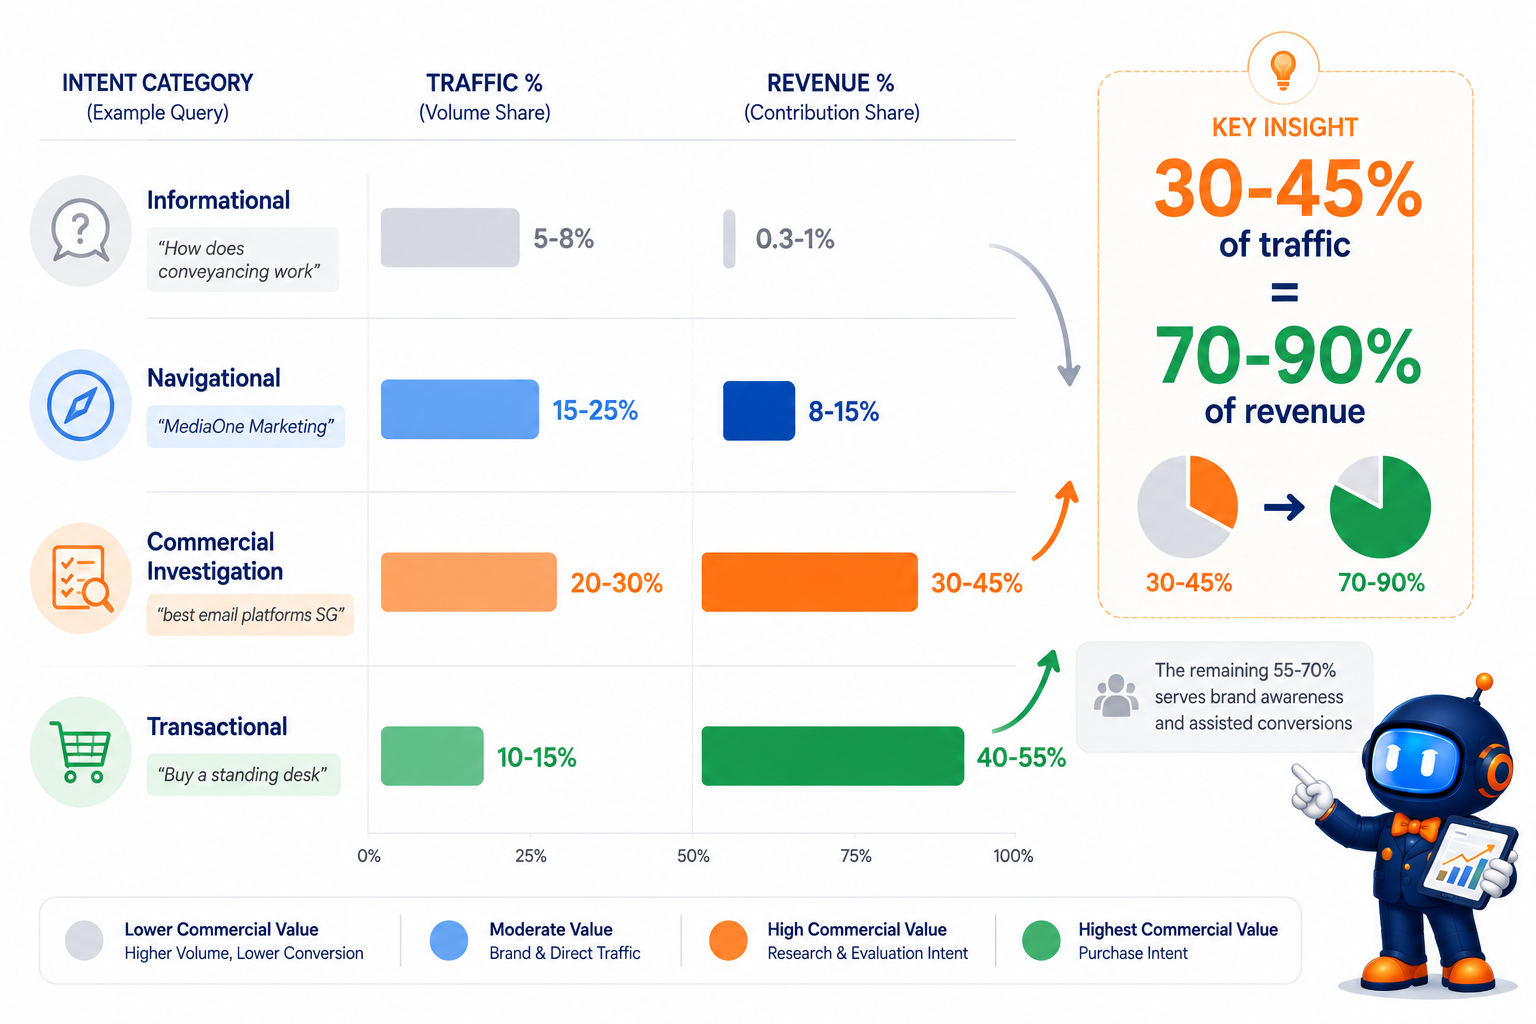
We segment organic traffic into four intent categories, along with a working model we use across every client audit.
| Intent Category | Example Query | % of Traffic | % of Revenue |
| Informational | “How does conveyancing work” | 5-8% | 0.3-1% |
| Navigational | “MediaOne Marketing” | 15-25% | 8-15% |
| Commercial | “best email platforms SG” | 20-30% | 30-45% |
| Transactional | “Buy a standing desk” | 10-15% | 40-55% |
30–45% of traffic generates 70–90% of revenue. The remaining 55–70% of traffic exists primarily for brand awareness and assisted conversions, which is fine as long as you stop reporting on it as if it were primary revenue.
The Revenue Corridor: Where Profit Actually Lives
Revenue Corridor is our proprietary term for the specific keyword set where improved visibility directly influences transaction volume. For most businesses, this represents 15–25% of total keyword targets but drives 70–85% of organic revenue. Once you have identified it, every other keyword is a secondary priority.
How to identify your Revenue Corridor:
- Export all keywords from Google Search Console
- Filter to keywords with ≥1 conversion in the last 90 days
- Calculate revenue per keyword using attribution data
- Rank keywords by revenue contribution
- Identify the minimum set capturing 75% of revenue
B2B Software Company Results:
| Metric | Before | After | Change |
| Total Keywords Tracked | 2,847 | 164 | -94% |
| Traffic to Corridor Keywords | Baseline | +67% | Concentrated |
| Organic MQLs | Baseline | +94% | Breakthrough |
| New Organic Customers | Baseline | +94% | Direct impact |
| Additional Annual Revenue | – | S$2.96M | Commercial proof |
We restructured their entire strategy around 164 keywords (5.8% of total) that generated 81% of MQLs. The remaining 2,683 keywords were quietly retired from the active tracking dashboard. Nothing was lost commercially, and reporting cycles shortened from four hours per week to about 35 minutes.
Conversion Rate: The Value Multiplier
| Conversion Rate | Average Order Value | Revenue Per Visitor |
| 2% | S$342 | S$6.84 |
| 4% | S$342 | S$13.68 |
Doubling the conversion rate doubles the value of every ranking improvement, without acquiring a single new visitor. This is why we never run an SEO programme in isolation from conversion design. According to Baymard Institute checkout usability research, the average documented cart abandonment rate sits at roughly 70%, which means even modest conversion improvements compound aggressively against organic traffic.
Pet Supplies Retailer Case Study:
| Metric | Before | After | Change |
| Conversion Rate | 1.41% | 2.36% | +67% |
| Monthly Revenue | S$53,010 | S$101,232 | +91% |
| SEO Investment | S$6,498 | S$6,498 | Unchanged |
| CRO Project Cost | – | S$7,182 | One-time |
| Additional Monthly Profit | – | S$18,276 | 12-day payback |
Conversion improvements implemented:
- Mobile page speed: 4.2s → 1.8s via technical SEO improvements
- Product descriptions: 80 words → 300–500 words with structured specifications
- Review system: None → integrated review platform with verified purchase tags
- Add-to-cart: Below fold → above fold on mobile
The 12-day payback is not unusual for retailers with established traffic. It is unusual for retailers whose SEO and conversion teams sit in separate silos and never share data.
Customer Lifetime Value Changes Everything
Meal Kit Subscription Service:
| Calculation Basis | Initial Purchase | Lifetime Value |
| Profit Per Customer | S$24.90 | S$181.75 |
| Monthly New Customers | 340 | 340 |
| Total Monthly Profit | S$8,466 | S$61,795 |
| SEO Investment | S$10,602 | S$10,602 |
| ROI | -20% | +483% |
The difference between -20% (unprofitable) and +483% (top-performing channel) depends entirely on measuring lifetime value instead of first-purchase value. If your reporting still stops at first transaction, you are systematically underfunding the channel that produces your most loyal customers.
This is the single most expensive measurement error we see in subscription, SaaS, and repeat-purchase businesses. The Harvard Business Review’s research on customer retention economics found that increasing retention by 5% can lift profits by 25–95%, depending on the industry. Yet most SEO dashboards still treat every conversion as a one-time event.
The Three-Dimensional Optimisation Approach
Most SEO programmes optimise one dimension at a time, usually visibility. The compounding gains live in optimising all three simultaneously: visibility, conversion, and cost.
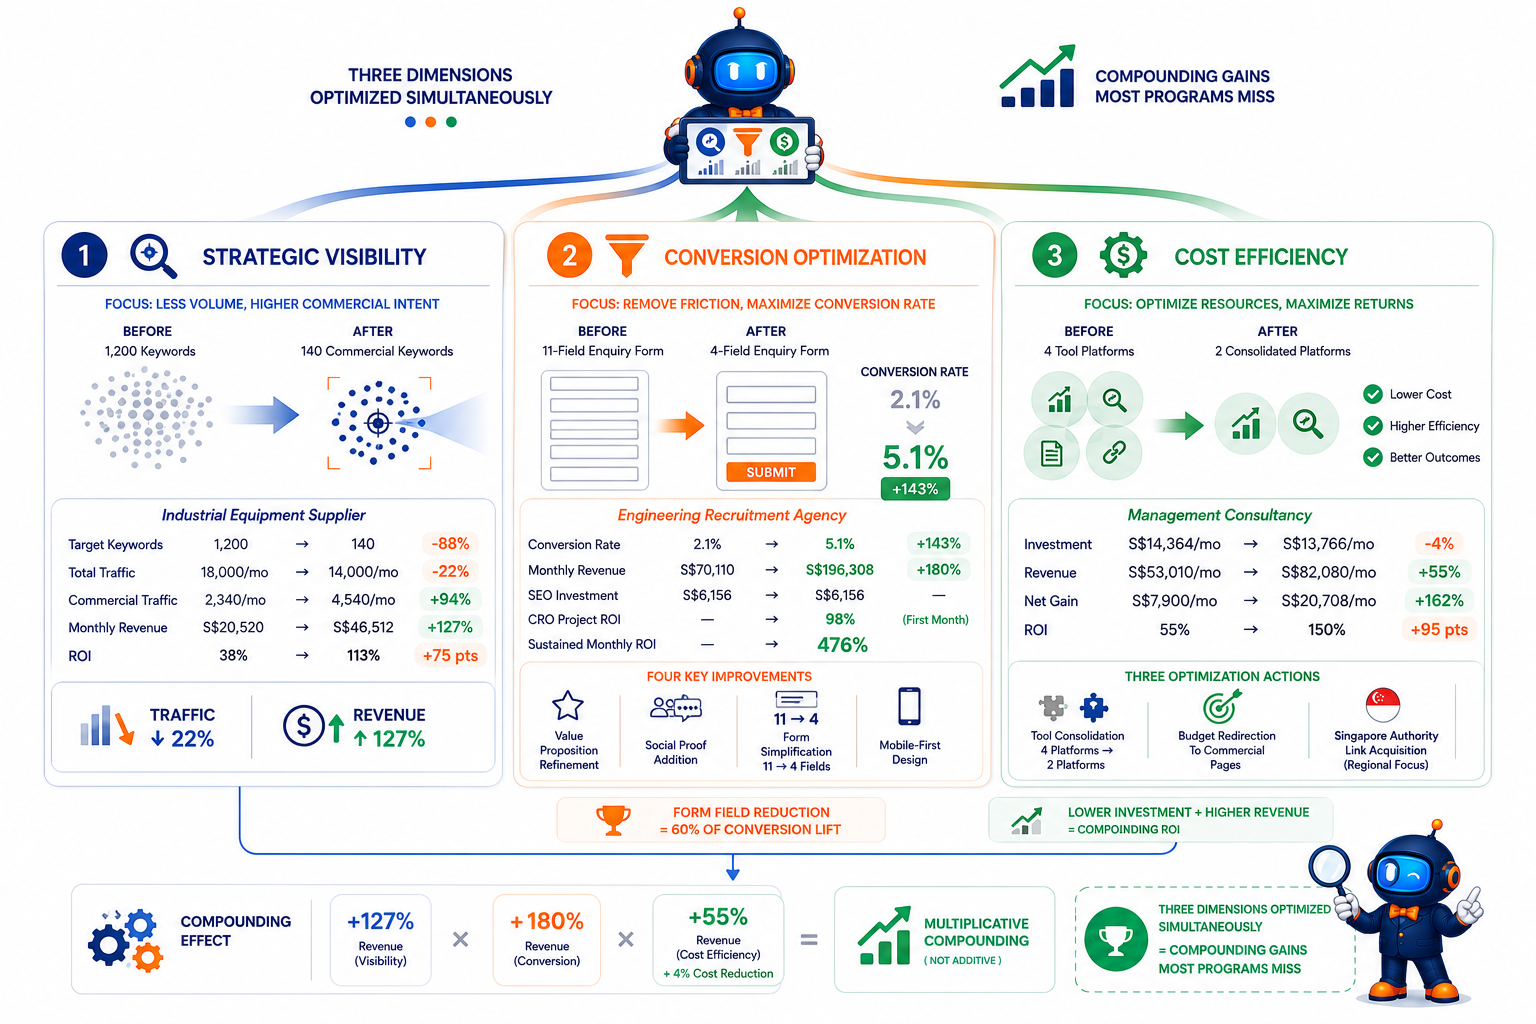
Dimension One: Strategic Visibility
Industrial Equipment Supplier Results:
| Metric | Broad Strategy | Strategic Focus | Change |
| Target Keywords | 1,200 | 140 | -88% |
| Total Traffic | 18,000/month | 14,000/month | -22% |
| Commercial Traffic | 2,340/month | 4,540/month | +94% |
| Monthly Revenue | S$20,520 | S$46,512 | +127% |
| ROI | 38% | 113% | +75 points |
We cut their target keyword list from 1,200 to 140, eliminating all informational keywords and focusing exclusively on commercial queries. Traffic fell 22%. Revenue rose 127%. The marketing director initially pushed back hard, because traffic is the metric most marketing teams have been measured on for a decade. Six months later, the same director presented the case study at an internal leadership summit as a model for the rest of the marketing portfolio.
Reducing traffic to grow revenue is not the kind of strategy most agencies will recommend, because traffic is what shows up in quarterly slide decks.
Dimension Two: Conversion Optimisation
Engineering Recruitment Agency Results:
| Metric | Before | After | Change |
| Conversion Rate | 2.1% | 5.1% | +143% |
| Monthly Revenue | S$70,110 | S$196,308 | +180% |
| Ongoing SEO Investment | S$6,156 | S$6,156 | Unchanged |
| CRO Project ROI | – | 98% | First month |
| Subsequent Monthly ROI | – | 476% | Sustained |
Improvements applied: value proposition refinement, social proof addition, form simplification (11 fields reduced to 4), and mobile-first design implementation. The 11-to-4 form field reduction alone accounted for roughly 60% of the conversion lift.
A practical observation from running this kind of work: most enquiry forms in Singapore B2B sites are designed by people who have never had to fill one in on a phone during a commute. Cutting form fields is uncomfortable for sales teams who want every data point upfront, and it is almost always the right commercial decision.
Dimension Three: Cost Efficiency
Management Consultancy Optimisation:
| Metric | Before | After | Change |
| Investment | S$14,364/month | S$13,766/month | -4% |
| Revenue | S$53,010/month | S$82,080/month | +55% |
| Net Gain | S$7,900/month | S$20,708/month | +162% |
| ROI | 55% | 150% | +95 points |
Achieved through tool consolidation (four overlapping platforms collapsed into two), redirecting low-impact content budget to commercial pages, and focused link acquisition targeting Singapore-specific authority sites.
Cost optimisation is the most overlooked dimension because it has no obvious champion inside the business. Nobody gets promoted for cancelling a software subscription. Everyone gets promoted for launching a new initiative. The Revenue Intelligence Framework forces this conversation into the open during every quarterly review.
AI Search Impact in 2026: The Measurement Crisis
Most ROI guides published before 2025 are silently missing this specific section, and it is the single biggest threat to traditional SEO reporting in 2026.
According to research published by Pew Research Center on AI search behaviour, users encountering AI-generated summaries click through to source websites at roughly half the rate of traditional results. For businesses in Singapore, this has created a measurement crisis nobody is fully prepared for: organic visibility is rising while click volume is falling, and most ROI dashboards have no way to record the value of being cited inside an AI answer.
The MediaOne View on AI Search ROI
The businesses still treating AI search as “experimental” line item inside their SEO investment are the same ones who treated mobile search as experimental in 2014. By the time the reporting catches up, the competitive position is already lost.
We call the emerging measurement gap the Invisible Authority Problem: brands cited by AI answer engines build commercial value that does not appear in click-based reporting until the customer later searches the brand name directly. The lag is typically 2–14 days.
Adapted Measurement Framework
| Challenge | Our Solution |
| Attribution Complexity | Brand search tracking + direct traffic behaviour analysis |
| Zero-Click Searches | Content performance via AI citations + featured snippets |
| Commercial Intent Shift | Multi-session attribution tracking 2–3 sessions after contact |
Practical adaptations we have implemented across the client base in 2026:
- Branded search velocity tracking as a leading indicator of AI citation share
- Direct traffic quality analysis filtered by referring AI surface where detectable
- Session-stitched attribution linking AI-driven discovery sessions to later conversion sessions through hashed user identifiers
- Citation share monitoring across major answer engines on a fortnightly cadence
The businesses adapting their measurement framework now will be the ones still defending SEO budgets in 2027. The rest will be cutting them because their dashboards no longer match commercial reality.
For a deeper look at how AI answer engines are reshaping organic visibility in Singapore specifically, our work on GEO optimisation services covers how we operationalise this for client portfolios.
How We Implement Revenue Intelligence
Our SEO services are structured around the Revenue Intelligence Framework from the initial engagement conversation. We do not start with keyword research. We start with the question: what does a profitable organic visitor look like for your business?
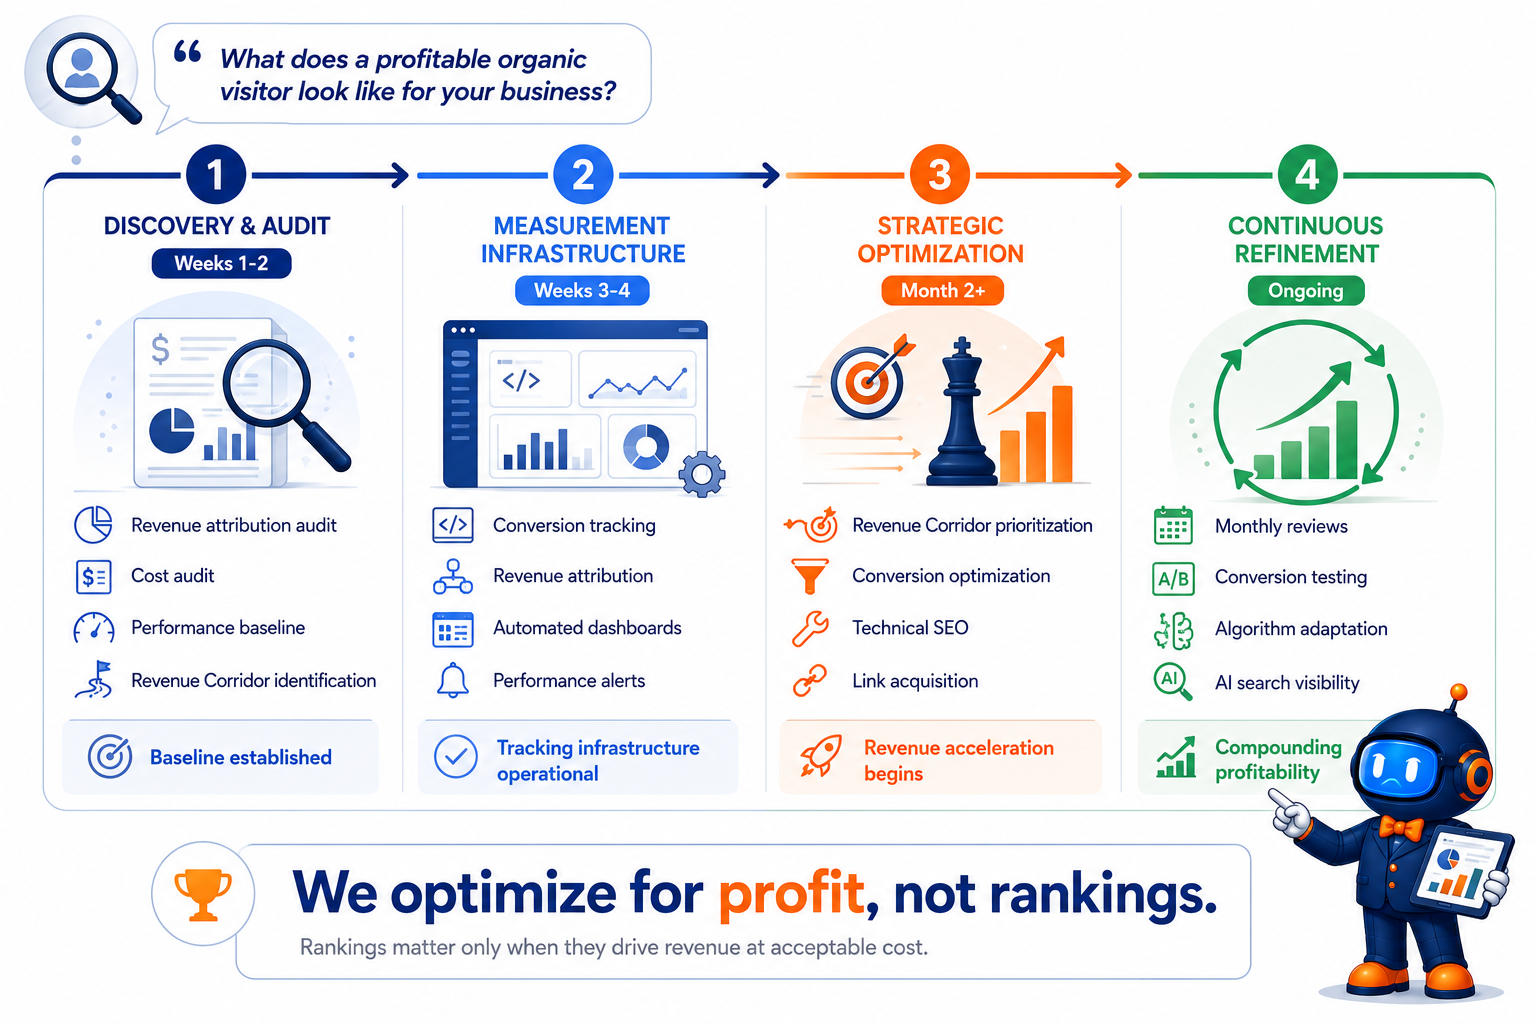
Implementation Timeline
| Phase | Duration | Key Activities |
| Discovery & Audit | Weeks 1–2 | Revenue attribution audit, cost audit, performance baseline, Revenue Corridor identification |
| Measurement Infrastructure | Weeks 3–4 | Conversion tracking, revenue attribution, automated dashboards, performance alerts |
| Strategic Optimisation | Month 2+ | Revenue Corridor prioritisation, conversion optimisation, technical SEO, link acquisition |
| Continuous Refinement | Ongoing | Monthly reviews, conversion testing, algorithm adaptation, AI search visibility |
The difference is that we do not optimise for rankings. We optimise for profit. Rankings matter only when they drive revenue at an acceptable cost, and when they do not, we say so directly during the monthly review.
Frequently Asked Questions
How do you calculate ROI on SEO investment?
Use this formula: [(Organic Revenue × Profit Margin) – Total SEO Investment] ÷ Total SEO Investment × 100. This calculates the profit generated by organic search, subtracts all SEO costs, and expresses the result as a percentage. Always use profit margin, not revenue, to avoid misleading calculations that disguise unprofitable activity.
What’s the difference between measuring revenue and profit for SEO ROI?
Revenue disguises unprofitable activity. A business generating S$85,500 monthly revenue with 18% margin produces S$15,390 profit. If SEO costs S$18,810 monthly, the investment loses S$3,420 despite impressive revenue. Across hundreds of audits, we have found that 40% of businesses reporting “positive SEO ROI” are actually unprofitable when measured using margin-adjusted profit.
What metrics should I track to measure SEO commercial performance?
Focus on five commercial metrics: (1) organic revenue and revenue per session, (2) margin-adjusted profit contribution, (3) cost per organic customer acquisition, (4) customer lifetime value, and (5) Revenue Corridor keyword performance (the 15–25% of keywords driving 70–85% of revenue). Everything else is secondary diagnostic data.
How long does it take to see a positive ROI from SEO investment?
For established sites in moderate competition, expect 3–6 months for meaningful ranking improvements and 6–12 months to reach positive ROI. For new sites or highly competitive markets, profitability may require 18–24 months. This is why pre-investment forecasting is essential. Agencies promising positive ROI in the first 90 days are usually either overpromising or counting branded search traffic as incremental.
Can service businesses measure SEO ROI as accurately as e-commerce?
Yes, but it requires more sophisticated tracking: (1) lead source capture for every enquiry channel, (2) CRM integration flowing lead data into sales pipelines, (3) sales stage tracking, (4) revenue attribution connecting closed deals to sources, and (5) lifetime value calculation. Service businesses implementing full-funnel attribution discover that organic leads convert at 1.5–3× higher rates than paid channels and generate 20–40% higher customer value.
How is AI search changing SEO ROI calculation in 2026?
AI search has compressed the click-to-revenue path and introduced citation-based visibility that does not show up in click data. Businesses still calculating ROI purely from click-based attribution are underreporting organic value by an estimated 15–35% in 2026. Adapt by adding branded search velocity, citation share, and session-stitched attribution to your measurement model before the gap becomes commercially material.