
| AI Summary
The most important social media metrics in 2026 are engagement rate, click-through rate (CTR), conversion rate, cost per acquisition (CPA), return on ad spend (ROAS) and customer lifetime value (CLV). These metrics help businesses evaluate audience engagement, lead generation and profitability. We recommend tracking 8–12 metrics aligned with your business goals. Use Google Analytics 4, UTM parameters and platform analytics to measure performance. Review results weekly and prioritise campaigns that generate qualified leads, conversions and profitable revenue. |
Your follower count can double while your revenue stays flat. Most businesses measure social media by the wrong numbers: followers, likes and impressions are easy to report, but they rarely predict revenue, retention or growth.

The social media metrics that matter are tied to actions: clicks, customers acquired at a known cost, repeat purchases and revenue by platform. This guide shows which ones to track, which formulas to use, how to set up tracking and how to move budget based on results. You’ll get comparison tables, sourced benchmarks and a six-step set-up.
Key Takeaways
- Social media metrics fall into three categories: audience behaviour (engagement, reach), business outcomes (conversions, revenue, customer lifetime value) and operational efficiency (cost per result). Tracking all three prevents you from optimising for vanity metrics.
- Engagement rate, click-through rate and cost per acquisition are better decision-making metrics than follower count and total impressions. UTM parameters on every link enable accurate attribution of traffic and conversions.
- Platform ranking signals differ. Instagram emphasises watch time, sends and likes per reach; TikTok emphasises watch time and completion; LinkedIn emphasises dwell time and meaningful comments; YouTube emphasises viewer retention and thumbnail click-through. Optimising the same way everywhere wastes budget.
- ROAS and ROI require proper conversion tracking and attribution. Treat commonly cited targets, such as 3:1 ROAS for e-commerce, as starting points and calculate your own break-even.
- Native analytics are free but don’t connect to website or CRM data. Management tools such as Hootsuite or Sprout Social centralise reporting, and Google Analytics 4 closes the loop from social click to conversion.
- The most common mistake is optimising ads for reach or impressions instead of conversions. Shift budget weekly toward channels and campaigns above your break-even ROAS, and set alerts so underperformers surface before month-end.
What Social Media Metrics Really Tell You
Understanding social media metrics means separating vanity numbers from indicators that affect your bottom line. Followers, likes and shares are easy to report, but on their own they rarely correlate with revenue or retention. A brand with 50,000 followers and 0.3% engagement is commercially weaker than a brand with 5,000 followers and 3% engagement.
Useful social media metrics measure three things:
- Audience behaviour: what people do on your channels.
- Business outcomes: sales, leads and inquiries tied to social.
- Operational efficiency: how much time and money you spend per result.
The difference between vanity metrics and actionable metrics
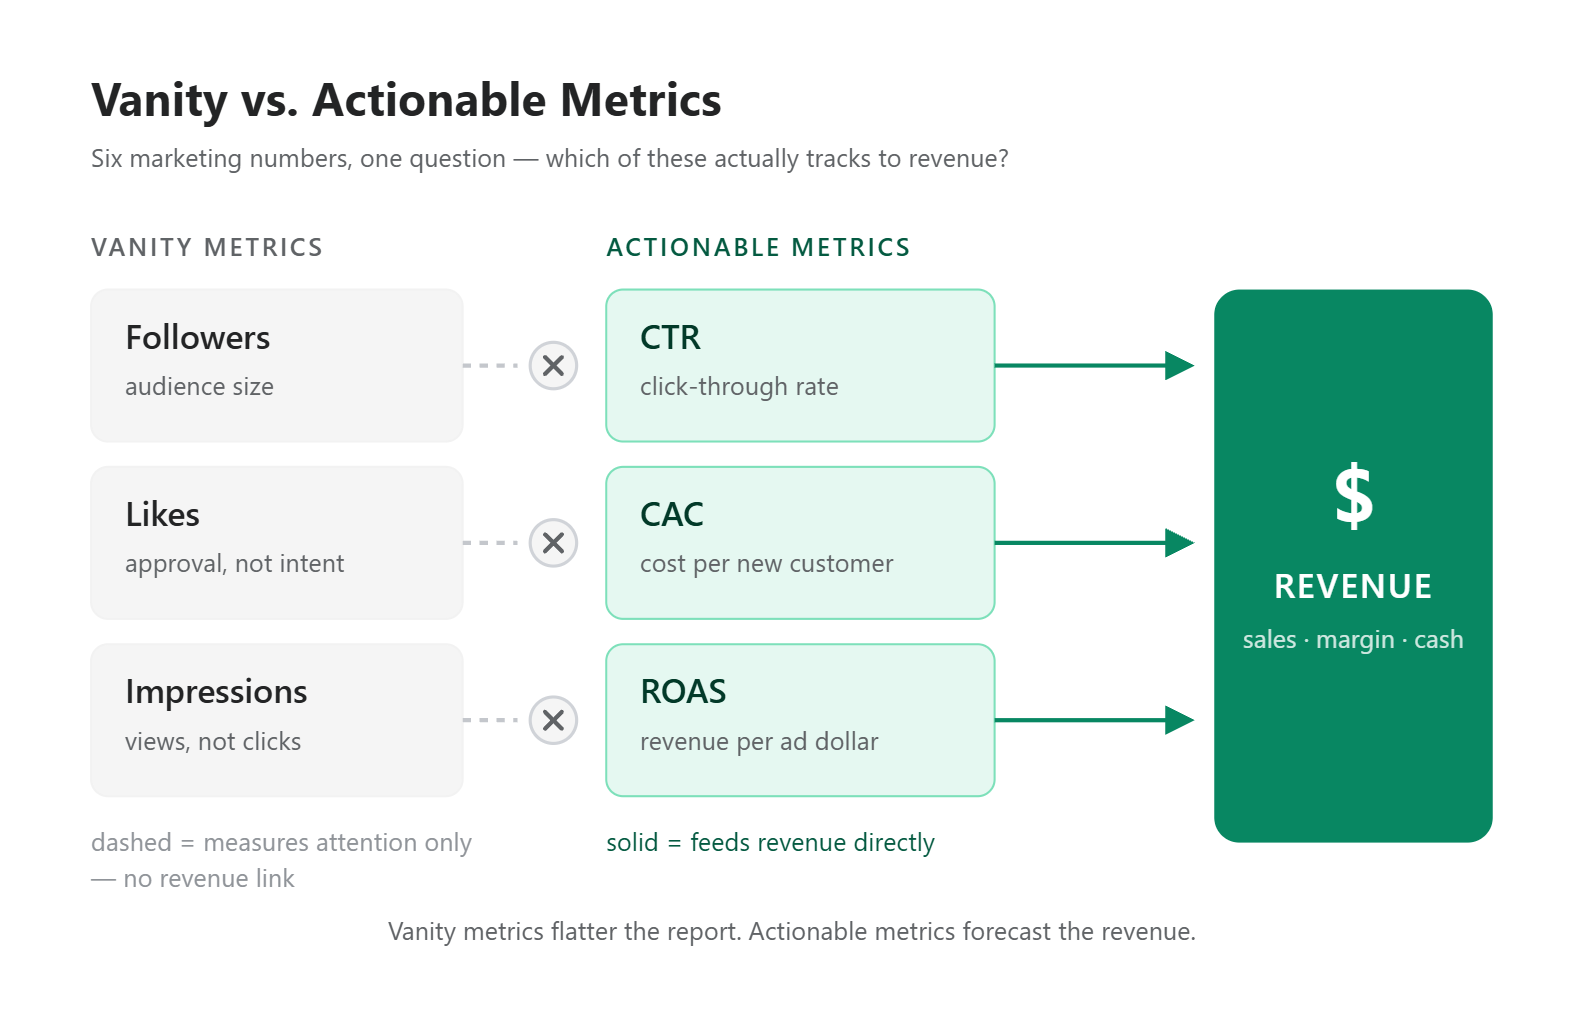
Vanity metrics look impressive in a board presentation but don’t predict business performance. Follower count, total impressions and likes per post are examples. Actionable social media metrics directly inform a decision you can change: click-through rate (CTR), cost per lead acquired through social, customer acquisition cost (CAC) by platform, and return on ad spend (ROAS).
The gap matters because tracking only vanity metrics leads you to optimise for the wrong things, such as posting more often to boost impressions rather than posting content that converts.
| Vanity metric | Why it misleads | Actionable replacement |
|---|---|---|
| Follower count | Grows without anyone buying or engaging | Engagement rate, follower-to-customer rate |
| Total impressions | Counts repeat views and says nothing about action | Reach, frequency, CTR |
| Likes per post | Cheap, passive signal | Likes per reach, sends per reach, comments |
| Total video views | Includes accidental plays | Average watch time, completion rate |
| Total shares | Can come from the wrong audience | Cost per lead, conversion rate by source |
A three-question test for any metric
- Is it actionable? Can you change your strategy based on this number? If not, remove it from your reports.
- Does it connect to a business outcome? Engagement signals content resonance, click-through rate shows whether that interest becomes visits, and conversion rate turns visits into revenue. Chain your metrics back from revenue; a metric that doesn’t connect to that chain is decoration.
- Is it behaviour or a result? Behaviour metrics (engagement, watch time, clicks) guide content improvements. Result metrics (conversions, revenue, customer lifetime value) justify budget. You need both.
Why this matters in 2026
Three shifts make metric discipline more important than before:
- Organic reach is low. On Facebook, one large 2025 dataset put average organic reach at about 1.65% of page followers, with standard post reach down 41% year on year in 2024 while Reels reach rose. Reach was around 16% of followers in 2012 and about 6% in 2014. Relying on organic numbers alone means invisibility.
- Privacy rules limit targeting. Apple’s App Tracking Transparency framework restricts cross-app tracking, and data protection laws such as Singapore’s Personal Data Protection Act (PDPA) govern how organisations collect, use and disclose personal data. First-party data, such as your email list and repeat customers, is now more valuable and more predictable than cold audiences.
- Every platform rewards different behaviour. Instagram, TikTok, LinkedIn and YouTube each rank content on different signals, so each demands a different measurement focus.
Singapore’s market is small, highly competitive and often B2B-driven. A regional retailer cannot rely on organic reach the way a brand targeting a much larger market can. Singapore businesses therefore prioritise metrics tied to immediate action: website clicks, form submissions, phone inquiries and repeat customer rates. The PDPA also makes owned-audience metrics more valuable than third-party audience targeting, which affects what you should prioritise in your measurement plan.
Core Social Media Metrics Every Business Should Track
These social media metrics appear across platforms and connect directly to business decisions. Not every business tracks all of them; treat the list as a menu and choose based on your industry and goals.
Start with these six social media metrics:
- Engagement rate: whether content resonates, normalised to audience size.
- Click-through rate (CTR): whether interest becomes website visits.
- Conversion rate: whether visits become customers or leads.
- Cost per acquisition (CPA): what each customer costs you.
- ROAS and ROI: whether your spend pays back.
- Customer lifetime value (CLV): how much you can afford to pay for a customer.
Engagement rate and why raw engagement numbers mislead
Engagement rate by followers = (likes + comments + shares + saves) ÷ total followers × 100. It normalises engagement to audience size, so a brand with 500 followers and 50 engagements (10%) is performing better than a brand with 50,000 followers and 2,000 engagements (4%), even though the second brand has more total engagement.
Track engagement rate rather than total engagements to see whether your content resonates. Be careful when comparing it with published benchmarks, because studies calculate it differently (by followers, by reach or by views) and the results differ widely. Always compare like with like.
Engagement rate benchmarks by platform (2025–2026)
| Platform | Typical engagement rate | How it is measured | Source |
|---|---|---|---|
| 0.30–0.48% median | Per follower (Quid) and per view (Socialinsider) | PostPlanify roundup | |
| TikTok | About 2.0–4.2% | Per follower for brands (Quid) and per view (Socialinsider) | PostPlanify roundup |
| About 2–6% | Varies by study; Buffer’s per-follower figure is 6.5% | Adintime | |
| About 0.15% | Per follower, 25 million posts (Socialinsider) | Socialinsider |
Studies use different formulas, so compare your results using the same method.
Click-through rate and traffic attribution
Click-through rate (CTR) = clicks to your website ÷ total impressions. For a social post, it tells you what percentage of people who saw it visited your link. Commonly cited starting points are roughly 2–4% for B2B software and 0.5–1.5% for retail, but these vary by platform, format and audience, so treat them as rules of thumb and replace them with your own baseline as soon as you have data.
Use UTM parameters (utm_source, utm_medium, utm_campaign) on every social link so your analytics platform (Google Analytics 4, Mixpanel and similar) attributes traffic and conversions to the right post. Without them, you cannot calculate return on investment (ROI).
Conversion rate and cost per acquisition
Conversion rate on social = (purchases or signups from social ÷ clicks from social) × 100. Cost per acquisition (CPA) = total ad spend ÷ number of conversions. These are the metrics that move the budget.
If Instagram Ads deliver customers at S$85 each and TikTok at S$120, you have a data-driven reason to shift budget toward Instagram. That only works if conversions are tracked and attributed correctly. Use Meta’s Conversions API or platform-native conversion tracking to reduce underreporting of offline or delayed conversions.
Reach, impressions and frequency
Reach is the number of unique people who see your content. Impressions are the total number of times it is displayed (one person seeing it twice counts as two impressions). Frequency = impressions ÷ reach, the average number of times each person sees the content.
These matter most for awareness campaigns. As a rule of thumb, frequency above 4–5 often brings diminishing returns, while direct-response campaigns such as a limited-time offer commonly work well at 2–3. Test both against your own results.
Platform-Specific Social Media Metrics and What They Mean
Each platform emphasises different signals and exposes different data. Treating them all the same wastes the insight specific to each channel.
Platform ranking signals at a glance
| Platform | Signals that matter most | Metrics to track | Where to find them |
|---|---|---|---|
| Watch time, likes per reach, sends per reach | Average watch time, sends per reach, likes per reach | Instagram Insights, Meta Business Suite | |
| Format: Reels earn more reach than standard posts | Reach, Reels views, engagement rate | Meta Business Suite | |
| TikTok | Watch time, completion rate | Completion rate, average watch time, traffic source | TikTok Analytics |
| Dwell time, substantive comments | Impressions, comments, link clicks, inbound inquiries | LinkedIn analytics, UTM-tagged landing pages | |
| YouTube | Viewer retention, thumbnail CTR | Average view duration, percentage viewed, impressions CTR, subscribers gained | YouTube Studio |
Platforms rarely publish exact weightings, so treat these as informed guides from creator statements and third-party analyses.
Meta platforms: Facebook and Instagram
Meta’s primary metrics are reach, impressions, engagement, video view time and actions on page (clicks, adds-to-cart, signups). For paid campaigns, Ads Manager reports reach, cost per result, frequency and ROAS automatically.
On Instagram, Adam Mosseri has named watch time, likes per reach and sends per reach (DM shares) as the top ranking signals. Reporting on his comments says sends carry roughly three to five times the weight of likes when Instagram decides whether to show content to non-followers, while likes matter slightly more for content shown to existing followers. Saves are still counted but are generally described as a weaker signal than these three. In practice, track average watch time, likes per reach and sends per reach for each post, not just total likes.
On Facebook, benchmarks are low. One 2026 analysis of 25 million posts put the average engagement rate at about 0.15%, and Reels now earn disproportionately more reach than standard posts.
TikTok: watch time, completion rate and sound usage
TikTok’s recommendation system gives heavy weight to watch time and completion rate (the share of viewers who watch to the end). As a simplified illustration, a 30-second video watched to the end by 1,000 people is a stronger signal than one abandoned at 15 seconds by 5,000, although TikTok does not publish exact weightings.
TikTok analytics also show which sounds, effects and hashtags appear in your top videos, and for brands they separate organic from paid views and show traffic sources (For You page, followers, hashtag page and so on). That helps you see whether content reaches new audiences. Studying the format and audio of high performers is a legitimate way to learn what works on the platform.
LinkedIn: dwell time, comments and message inquiries
LinkedIn’s feed rewards content that holds attention and prompts discussion. Several 2026 explainers describe dwell time (how long people spend on a post) and substantive comments as among the strongest signals, with posts that perform well in an early test group expanded to second- and third-degree connections.
LinkedIn rarely publishes weightings itself, so treat these as informed observations rather than fixed rules. In August 2026 LinkedIn also began ranking comments per viewer, using signals such as professional interests, connections and engagement activity.
For B2B brands and recruiters, message inquiries and connection requests that follow a post are meaningful but often missing from analytics. Track them with a UTM-tagged landing page tied to your LinkedIn content, or log inbound inquiries and applications after each campaign.
YouTube: average view duration, thumbnail CTR and subscribers gained
YouTube’s recommendations are driven largely by how viewers respond: how long they watch, whether they click the thumbnail (impressions CTR) and whether they subscribe. Average view duration and average percentage viewed are usually more informative than total views.
For example, a 10-minute video watched for 3 minutes on average (30% viewed) is retaining viewers worse than a 5-minute video watched for 4 minutes (80% viewed), even if it has a longer absolute watch time per view. Subscribers gained from a video is a further signal of how well it converts casual viewers.
Calculating Return on Investment and Attribution
Knowing your social media metrics is half the job. Attributing revenue to channels is where most brands fail, and where the best performers pull ahead.
Setting up proper tracking and UTM parameters
Every link you share should carry UTM parameters so your analytics platform can identify the source and campaign. The minimum set is:
- utm_source: the platform, for example facebook, tiktok, instagram or linkedin.
- utm_medium: how the link was used, for example social, paid_social or organic_social. Pick one convention and use it consistently.
- utm_campaign: the campaign, for example black_friday_2026 or new_product_launch.
Use a UTM builder or a link tool that supports UTM generation (Bitly, for example) and keep a shared naming sheet so the team uses identical labels. Without UTM parameters, social clicks are often reported as “direct” or other channels in Google Analytics 4, making ROI calculation unreliable.
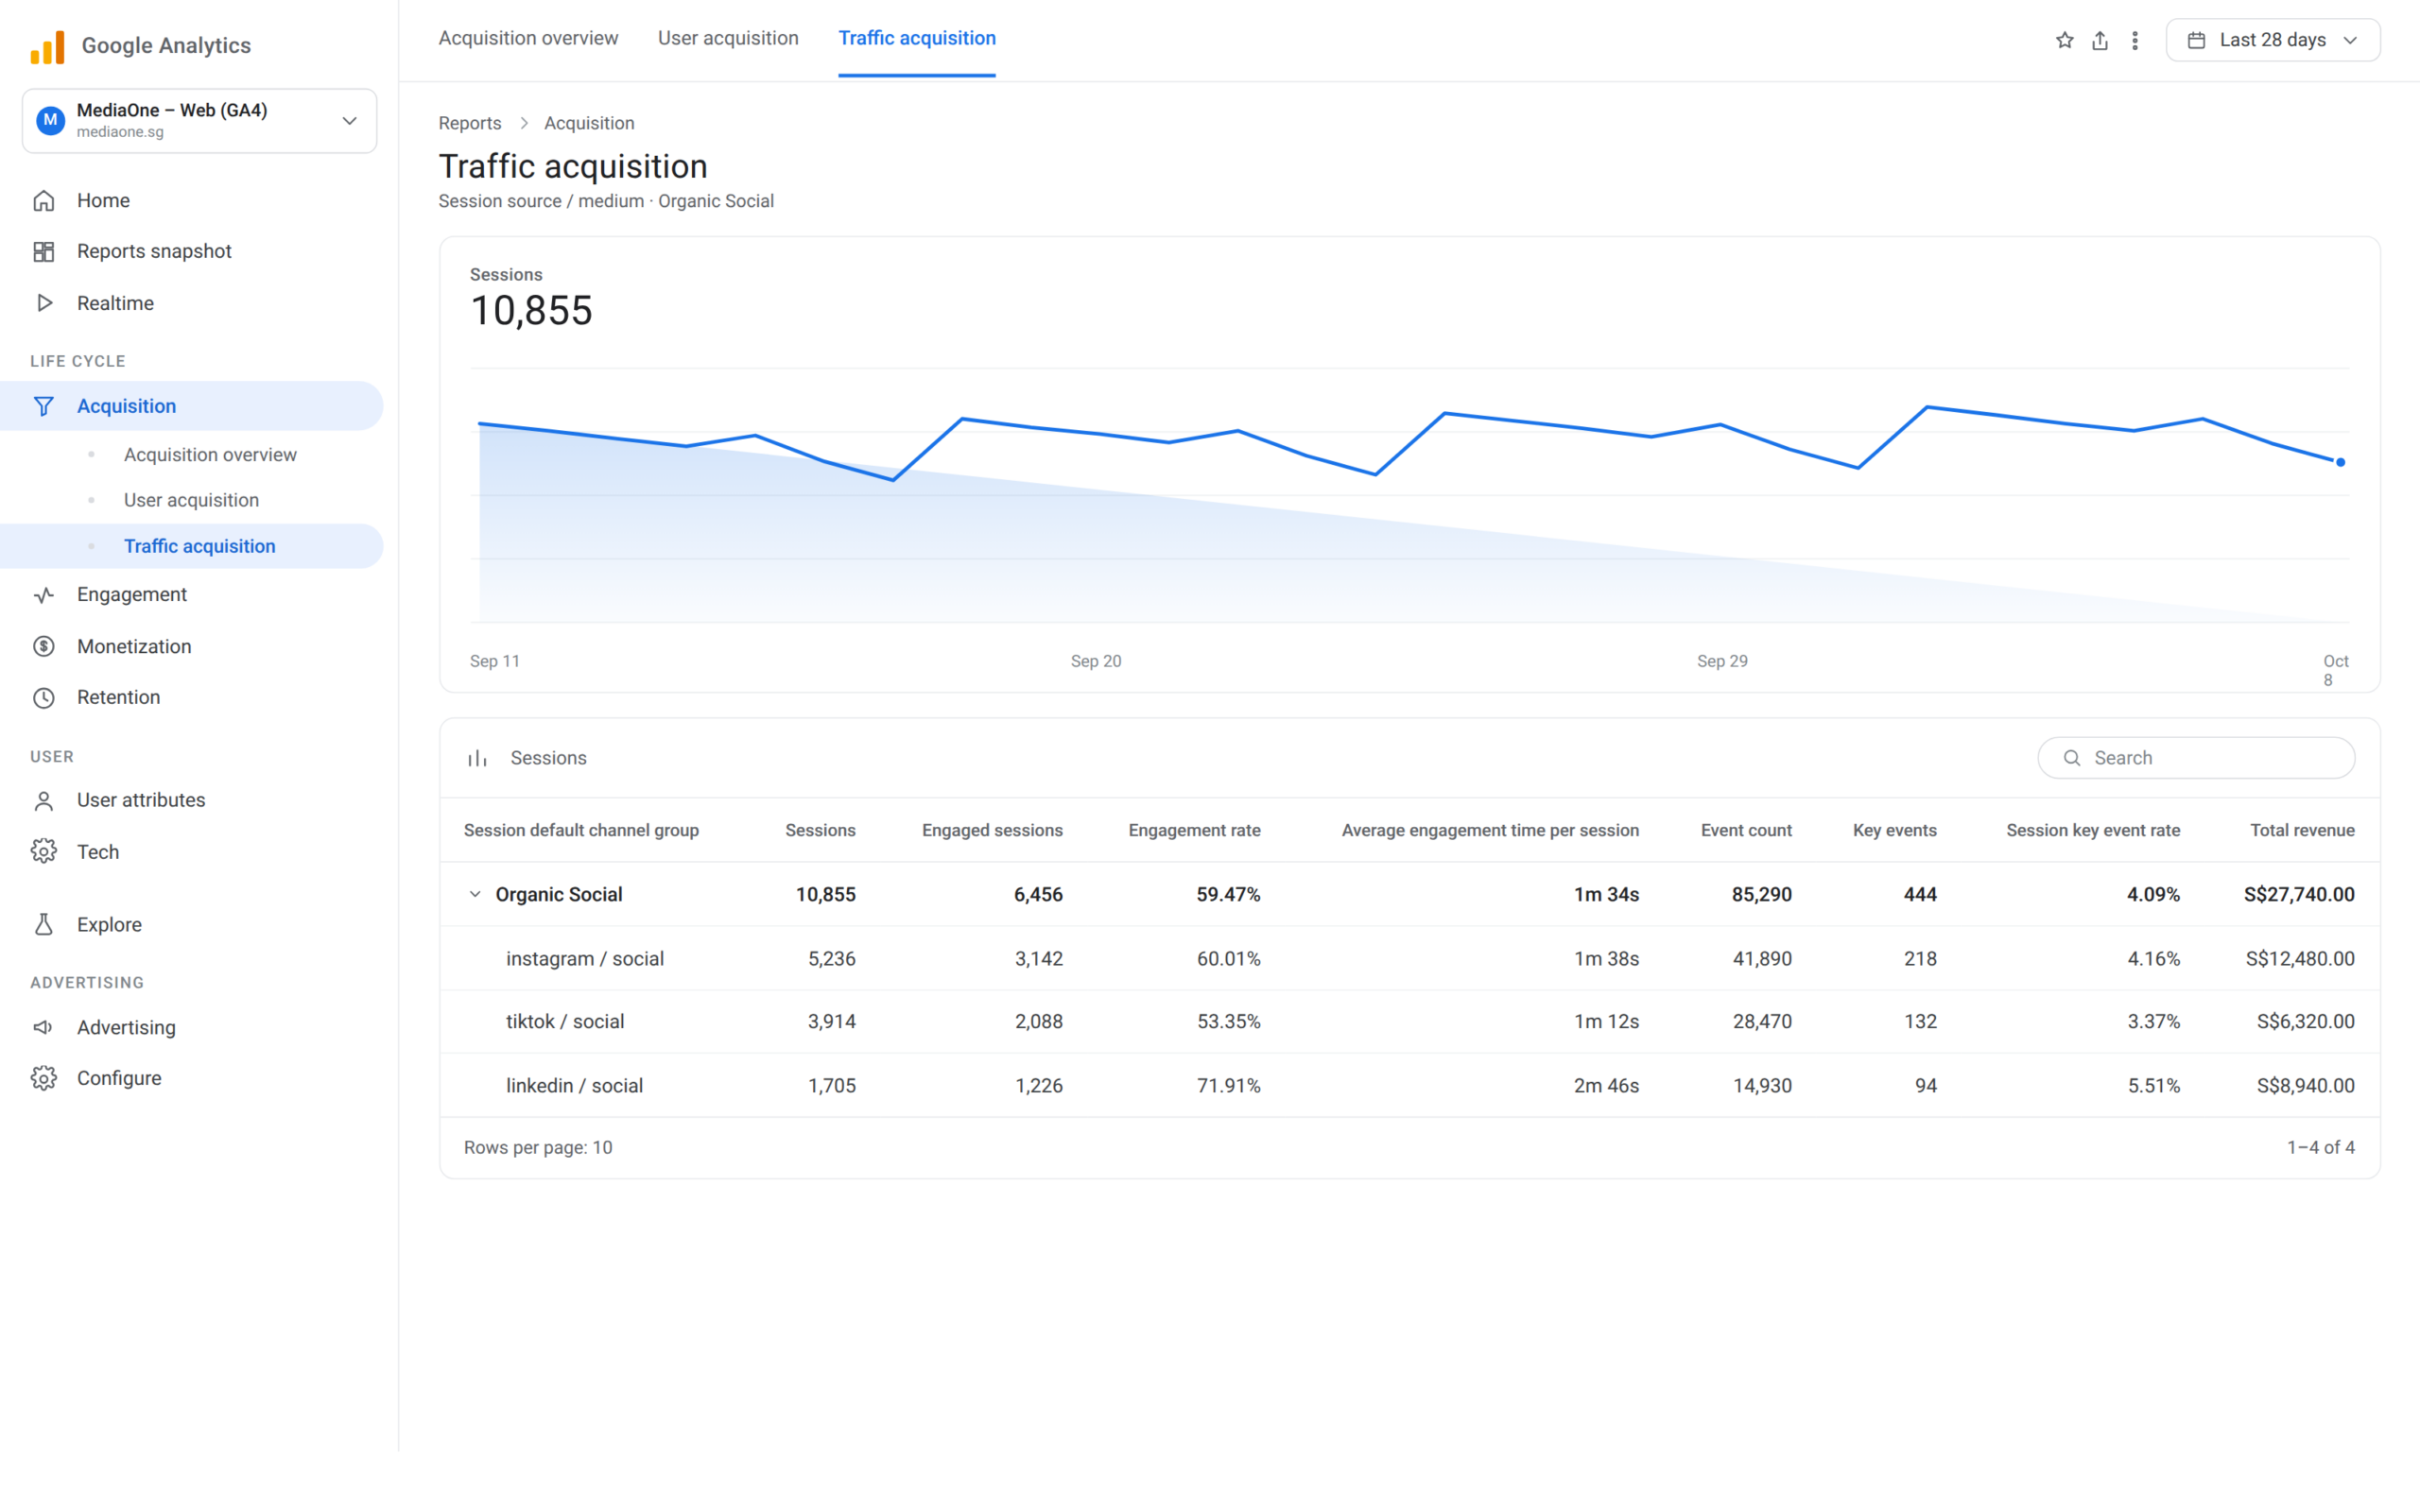
- Pick one business goal: revenue, qualified leads or retention.
- Choose 8–12 social media metrics from the tables in this guide.
- Tag every link with utm_source, utm_medium and utm_campaign.
- Mark key events in GA4 and install platform conversion tracking (Meta Conversions API, TikTok Events API).
- Build a Looker Studio dashboard and set alerts for ROAS, engagement rate and overspend.
- Review weekly and move budget toward channels above your break-even ROAS.
Multi-touch attribution and the limits of last-click
Last-click attribution gives 100% of the credit to the final channel a customer used before converting. It is simple but often misleading: a customer may see your Instagram ad, read a blog post, then click a LinkedIn message before buying, and last-click credits only the LinkedIn message.

Multi-touch attribution distributes credit across touchpoints. Linear attribution gives equal weight to each; time-decay gives more weight to touchpoints closer to conversion. First-party data (customer records and your email list) supports better attribution than platform data alone.
For small businesses, simply asking new customers “How did you find us?” at checkout or in a post-purchase survey is often more accurate than algorithmic attribution.
Return on ad spend (ROAS) = revenue from social ads ÷ total ad spend. A ROAS of 4:1 means S$4 earned for every S$1 spent.
Return on investment (ROI) = (revenue − total cost) ÷ total cost × 100. Total cost includes ads, content creation, community management and tools.
Example: You spend S$2,000 on Instagram ads and S$1,500 on content creation and management in a month, so total cost is S$3,500. You generate S$12,000 in attributed revenue. ROI = (12,000 − 3,500) ÷ 3,500 × 100 = 243%. ROAS from ads alone = 12,000 ÷ 2,000 = 6:1.
Benchmark ROAS against your industry and margins. A common rule of thumb is that e-commerce brands aim for 3:1 or higher, while B2B lead generation may accept lower ratios, such as 1.5:1, if customer lifetime value is high. Calculate your own break-even ROAS from your margins; once you know it, you can scale with confidence.
Organic reach and the cost of not paying for placement
Organic reach on Facebook has fallen for more than a decade. Recent studies put the average at roughly 1–5% of followers per post, depending on page size and method, with about 1.65% in one large 2025 dataset. A page with 10,000 followers might therefore expect a few hundred people reached per post at best, and often closer to 100–200.
Consider the opportunity cost. If a post reaches 200 people organically but a S$100 ad reaches 5,000, you have forgone thousands of potential impressions. For conversion-focused campaigns, organic reach alone is rarely sufficient.

Advanced Social Media Metrics for Specific Business Goals
Not every business optimises for the same outcome. Use these metrics when your goal is narrower than general growth.
Customer lifetime value and cohort analysis
Customer lifetime value (CLV) is the total profit you expect from a customer over the relationship. If your average customer spends S$500 over three years and your margin is 30%, CLV is S$150.
When you know CLV, you know the most you can spend to acquire a customer profitably. If CLV is S$150 and you acquire a customer at S$85, you have room to scale. If CAC is S$180, you are losing money.
Cohort analysis groups customers by acquisition channel and tracks their behaviour over time. Customers who arrive through organic social may have higher lifetime value than those from paid ads, which can justify investing in community building alongside paid campaigns.
Share of voice (SOV) = your brand’s social impressions ÷ (your impressions + all competitors’ impressions) × 100. If you and two competitors generated 10,000 impressions combined and you generated 3,000, your SOV is 30%.
Tools such as Semrush, Brandwatch or Sprout Social can benchmark your engagement rate, follower growth and ad spend against competitors. If your engagement rate is consistently below theirs, you may have a content or community problem. If your CAC is higher, your messaging or targeting may need work.
Sentiment analysis and brand perception
Sentiment analysis uses natural language processing to classify brand mentions as positive, negative or neutral. It is offered by listening and management tools such as Brandwatch, Sprout Social (in higher-tier plans or its listening add-on) and Hootsuite (through its Talkwalker listening products).

Sentiment is useful for crisis detection: a spike in negative mentions may signal a customer service failure or PR issue that needs a fast response. Over time, improving sentiment suggests your content and service are resonating. Automated scores are imperfect, though, because sarcasm and context cause errors. Use sentiment to flag items for human review, not as a standalone metric.
Tools and Platforms for Tracking Social Media Metrics
Effective tracking requires the right tools. Your choice depends on budget, platform focus and whether you run paid campaigns.
Native platform analytics
Meta Business Suite (Facebook and Instagram), YouTube Studio and TikTok Analytics are free and adequate for basic tracking: reach, impressions, engagement, follower growth and top content. Their limitation is that they don’t connect to your website analytics or CRM, so attribution is incomplete. Use them for content performance and external tools for conversion tracking.
All-in-one management platforms
Hootsuite, Buffer and Sprout Social centralise analytics from multiple platforms and add scheduling, content calendars and automated reporting. Sprout Social also includes inbox and listening features. For agencies managing several clients, these tools are close to essential.
Pricing changes often and is usually quoted in US dollars. As of 2026 list prices, Sprout Social charges per seat, from about US$199 (Standard) to US$399 (Advanced), with sentiment features in higher tiers. Hootsuite plans start at about US$99–199 per month depending on the plan. Check each vendor’s current pricing page and convert to Singapore dollars for budgeting.
Social media metrics tools compared
| Tool | Best for | Starting price (USD list, 2026) | Limitation |
|---|---|---|---|
| Meta Business Suite, YouTube Studio, TikTok Analytics | Day-to-day content metrics | Free | No website or CRM attribution |
| Google Analytics 4 | Traffic, key events and conversions by channel | Free | Needs UTM tagging and key events set up |
| Looker Studio | Shared dashboards | Free | Meta and some other sources need partner connectors |
| Hootsuite | Scheduling and multi-platform reporting | About 99–199 per month, by plan | Price depends on plan and accounts |
| Sprout Social | Reporting, inbox and listening for teams | $199 (Standard) to $399 (Advanced) per seat per month | Sentiment features sit in higher tiers |
| Brandwatch | Enterprise listening and sentiment | From about $800 per month | Enterprise-level cost |
Prices change often, so confirm them on each vendor’s pricing page.
Website analytics: Google Analytics 4 and alternatives
Google Analytics 4 (GA4) is free and connects your website to social traffic. Configure it to show which social channels drive traffic and what share of each channel’s visitors convert.
Mark your important actions (form submissions, purchases, video plays) as key events so you can measure conversion rate by channel. GA4 replaced the Universal Analytics concept of goals with key events. You can also build GA4 audiences and remarket to site visitors through social ads, which closes the loop from awareness to conversion.
Alternatives include Mixpanel (event-based, strong for product and mobile analytics), Amplitude (cohort and funnel analysis) and Segment (a customer data platform that routes data to other tools and warehouses). These are typically used by larger teams or those with complex data needs.
Ad performance dashboards
Meta Ads Manager and TikTok Ads Manager are the native platforms for managing and measuring paid campaigns. Both report reach, impressions, clicks, conversions, cost per result and ROAS in near real time. For most small and mid-sized businesses they are sufficient and should be your primary source of truth for paid performance, provided your pixel and server-side events are set up correctly.
Building a Social Media Metrics Dashboard
A dashboard consolidates your most important social media metrics in one place, updated automatically, so you can make decisions without pulling reports by hand.
Choosing metrics for your dashboard
Limit your dashboard to 8–12 metrics chosen for your primary business goal. A typical e-commerce dashboard includes:
- Total ad spend and ROAS (top line)
- Click-through rate and cost per click (efficiency)
- Conversion rate and cost per acquisition (effectiveness)
- Organic reach and engagement rate (content health)
- Follower growth rate (audience expansion)
A B2B lead generation dashboard might replace conversion rate with lead quality score and cost per qualified lead, reflecting the longer sales cycle.
| Business goal | Primary metrics | Supporting metrics |
|---|---|---|
| E-commerce sales | ROAS, CPA, conversion rate | CTR, cost per click, engagement rate |
| B2B lead generation | Cost per qualified lead, lead quality score | CTR, inbound inquiries, CLV |
| Brand awareness | Reach, frequency, share of voice | Engagement rate, sentiment |
| Content or creator growth | Watch time, completion rate, subscribers gained | Engagement rate, sends per reach |
| Local services | Calls, form submissions, repeat customer rate | Reach, UTM-tracked clicks |
Review your dashboard weekly. Monthly reviews are too slow to catch failing campaigns, and daily reviews are mostly noise outside high-budget campaigns. Set alerts, for example if ROAS drops below your break-even level, if engagement rate falls below your average, or if spend exceeds budget by 10%.
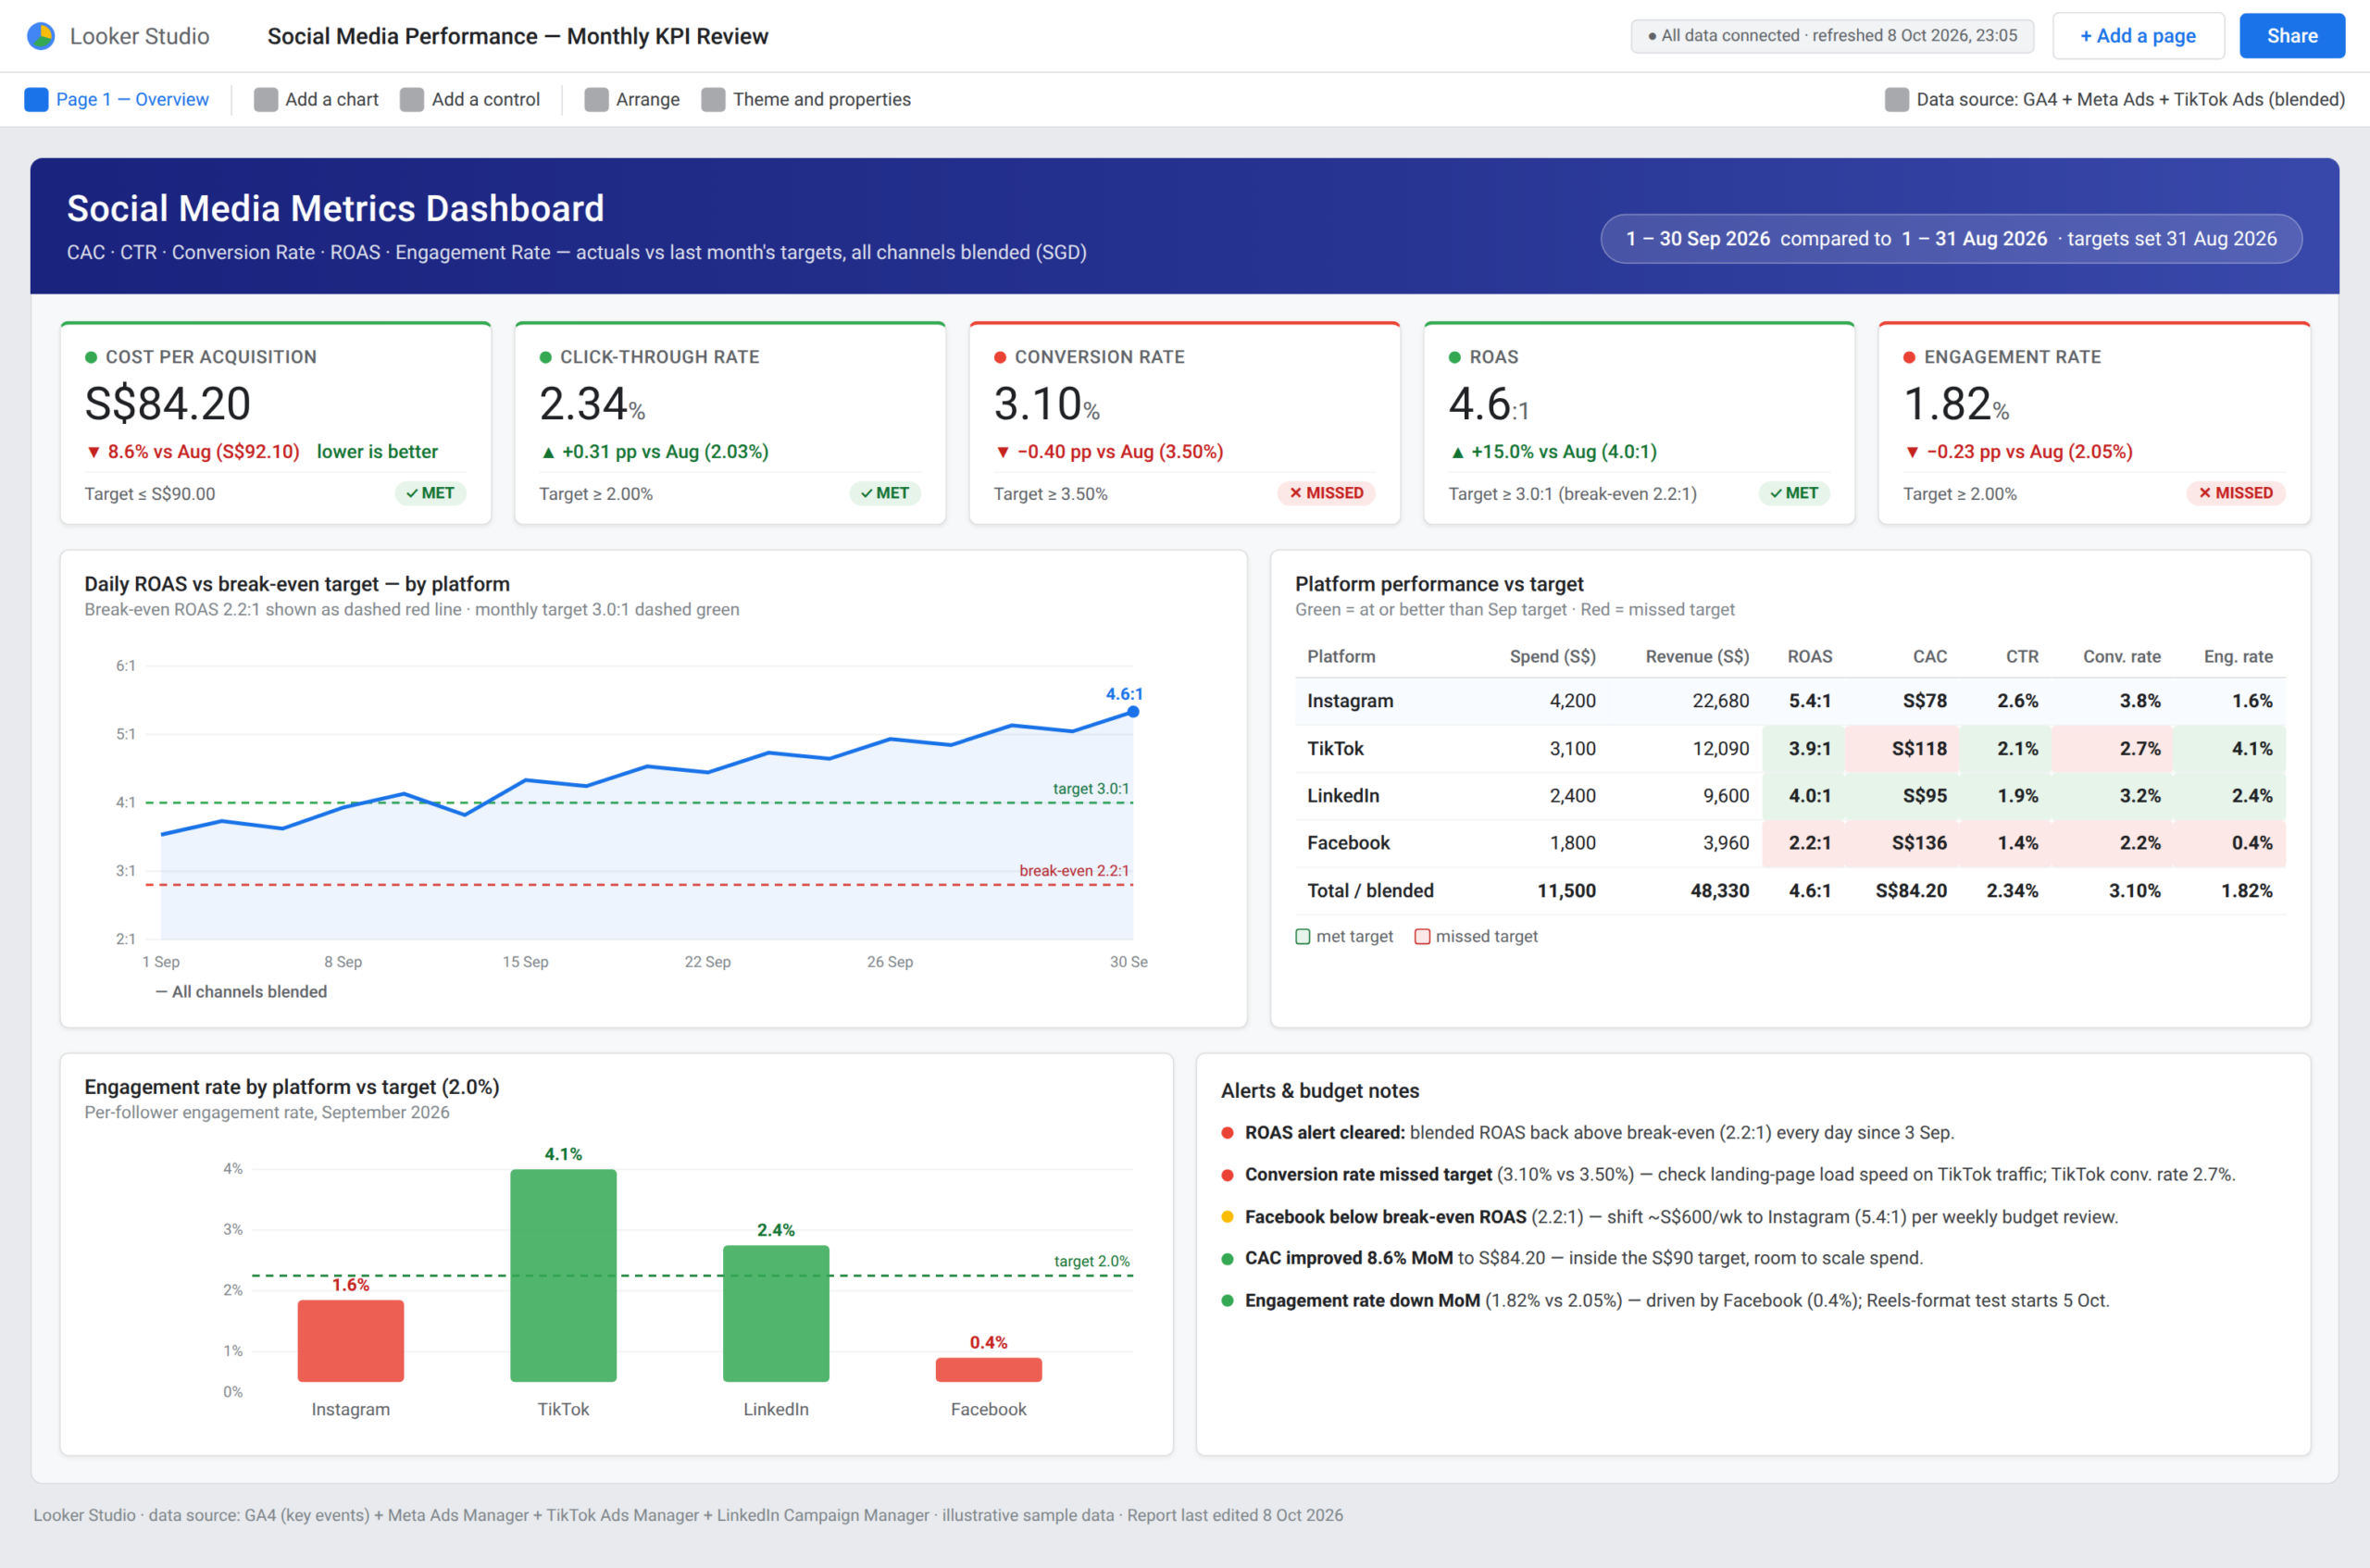
Automating reporting with Looker Studio, Looker and Tableau
Looker Studio (formerly Google Data Studio) is free and connects to Google Analytics 4 and many other sources, often through partner connectors for platforms such as Meta. A basic custom dashboard can be built in under an hour and shared with stakeholders by link. Looker and Tableau are enterprise tools with higher cost and more flexibility, and for most businesses Looker Studio is enough.
Automate report distribution by emailing stakeholders every Monday, or by sending a Slack alert when a metric crosses a threshold. Automation keeps your social media metrics visible and actionable.
Benchmarking and setting realistic targets
Establish a baseline for each channel and content type, then set improvement targets. If your Instagram engagement rate is 1.2%, a target of 1.5–1.8% (a 25–50% improvement) is reasonable.
Compare against industry benchmarks where possible. Publishers such as Hootsuite, Sprout Social, Buffer, Socialinsider and Rival IQ release annual figures by industry and platform. Check how each study defines engagement rate before comparing, and use the figures as a sanity check. If your target is a 5x increase in 90 days while your industry is flat, you need a bigger strategy change, not just better execution.
Common Mistakes in Tracking Social Media Metrics
These pitfalls are common. Avoiding them puts you ahead of most competitors.
Chasing vanity metrics and “growth at any cost”
Chasing follower count, impressions and likes often produces hollow growth: large audiences with little purchasing power or engagement. Make engagement rate and conversion rate your primary targets, and if you report follower count, pair it with engagement rate so the full picture is visible.
Ignoring platform algorithm changes
Platform ranking systems change constantly. Instagram has leaned into watch time and sends, Facebook reach has shifted toward Reels and away from standard posts, and LinkedIn has changed how it ranks comments. Brands that ignore these shifts spend budget on tactics that no longer work. Follow platform announcements and industry newsletters, and run monthly A/B tests to catch changes early.
Attribution errors and the cost of mismeasurement
Failing to use UTM parameters or platform conversion tracking usually understates social’s impact. Revenue gets credited to “direct” traffic when social earned it, which leads to underfunding. Fix tracking now. If you have six months of bad data, accept the loss and start clean.
Optimising for the wrong metric
A common error is optimising ads for reach or impressions and then being surprised by poor conversion rates. Reach is cheap; conversions are expensive. Optimise ads for conversions or value unless your goal is genuinely awareness. Likewise, comment bait such as “What’s your favourite?” can inflate engagement while attracting low-quality audiences. Judge organic content on engagement rate and click-through rate together.
Social Media Metrics Statistics and Sources
These figures support the benchmarks above. They are as reported by the linked pages in October 2026; confirm them against the original studies before publishing.
| Statistic | Figure | Source |
|---|---|---|
| Facebook organic reach per page post (2025 average) | 1.65% of followers | Shno: Facebook statistics (Metricool data) |
| Facebook standard post reach, change in 2024 | −41% year on year; Reels +13% | Shno: Facebook statistics |
| Facebook organic reach in 2012 | About 16% of followers | ProfileTree |
| Facebook average engagement rate (2026) | 0.15% | Socialinsider |
| Instagram median engagement rate, per follower | 0.30%, down 17% year on year | PostPlanify (Quid 2026) |
| TikTok engagement rate, per view | 4.20%, up 9% year on year | PostPlanify (Socialinsider 2026) |
| Instagram weight of sends vs likes for non-followers | About 3–5 times | Eclincher |
| Sprout Social list price | 199–399 per seat per month | CostBench |
Build a Metrics-Driven Social Media Strategy in 2026
Effective social media management requires disciplined measurement. The businesses doing well in 2026 track three categories of social media metrics: audience behaviour (engagement, reach), business outcomes (conversions, revenue, customer lifetime value) and channel efficiency (cost per result, ROAS, cost per acquisition).
Which metrics you track depends on your industry and model. An e-commerce brand tracks conversion rate and ROAS; a B2B SaaS company tracks lead quality and cost per qualified lead; a creator focuses on watch time and subscriber growth.
Avoid the trap of tracking only vanity metrics. Set up proper tracking (UTM parameters, conversion pixels, analytics integration), choose 8–12 metrics tied to your goal, and review them weekly. Use what you learn to guide budget, content and platform decisions. The advantage in 2026 is not better content or better ads; it is measuring impact accurately and iterating quickly.
Frequently Asked Questions
What is the difference between reach and impressions?
Reach is the number of unique people who see your content. Impressions are the total number of times it is displayed. One person viewing a post twice counts as one reach but two impressions. For awareness campaigns, focus on reach; to understand repeat exposure, look at impressions and frequency (impressions ÷ reach).
Weekly, ideally on the same day each week, so you can spot trends and underperformance early. Monthly reviews are too infrequent, and daily reviews are mostly noise unless you manage high-budget ad campaigns.
It depends heavily on the platform and how engagement is calculated. By followers, recent 2025–2026 studies show roughly 0.3–0.5% median for Instagram, about 2–4% for TikTok, about 2% median for LinkedIn in some studies (others report higher), and well under 1% for Facebook. Benchmark against your own baseline and direct competitors, and aim for a 25–50% improvement over your baseline.
Calculate ROI as (revenue − total cost) ÷ total cost × 100. Many businesses aim for 100–300% (S2–S4 of revenue for every S$1 spent), but the right target depends on your margins and customer lifetime value. If your ROI is below 50%, review your strategy, targeting and creative.
Should I use a management platform or native analytics?
Use both. Native analytics (Meta Business Suite, YouTube Studio, TikTok Analytics) are free and integrated with your accounts; use them for day-to-day content performance. A management platform such as Hootsuite or Sprout Social is worth it if you manage multiple platforms or clients, or need consolidated reporting. Start with native analytics and move to a platform when you outgrow them.
Ask customers “How did you find us?” at checkout or in post-purchase surveys. Use UTM parameters on all social links, and connect your CRM (through integrations such as Zapier or platform APIs) so form submissions are tied to social traffic. For high-ticket B2B sales, have the sales team log the social touchpoint that started the conversation. First-party data is generally more reliable than algorithmic attribution.